Table of contents
We have been asked numerous times to share how we optimize blog posts for SEO and get better search rankings, so here we are.
Not only are we going to share parts of our optimization process, but we have also asked more than 100 SEOs and marketers to share their SEO best practices for blog posts.
Apart from the mentioned, we are also going to talk about when is the best time to optimize your content for SEO, how to update old content and how to identify blog posts that need an SEO update.
Excited to learn how to write SEO blog posts?
Here’s a peak of what we’ll share before we dive into the details.
- What is Blog SEO?
- Why is Blog SEO Important?
- Does Blogging Help SEO?
- How Often Should You Blog for SEO?
- How to Write SEO-Friendly Blog Posts: 10-Point Checklist
- How to Optimize Blog Posts for SEO: Additional 16 Expert Tips
- How to Update Old Blog Posts for SEO? 21-Point Update Checklist
- How to Find and Update Old Blog Posts for SEO Using Databox

What is Blog SEO?
Simply explained, blog SEO is the practice of optimizing your blog’s content for search engines. Blog SEO doesn’t only involve adding rich keywords to your content, but implementing all on-page SEO best practices, with a particular focus on your site’s architecture and HTML code. Blog SEO also includes improving page loading speed, internal linking, etc.
Why is Blog SEO Important?
A survey conducted by Orbit Media found that SEO and social media are the two biggest sources of traffic for bloggers. And Databox is the living proof of this research – we get almost all of our organic traffic through SEO.
Or to be exact, we get a bit less than 250,000 sessions a month (or as we like to say sometimes — almost a quarter of a million).
Here is our data from May.

Needless to say, without blog SEO, our site would have probably grown at a much slower pace. So, if you want to learn how to optimize your blog for SEO and boost organic traffic, make sure you check out our expert SEO tips sourced from over 100 marketers.
But, before we begin, let’s answer some FAQs.
Does Blogging Help SEO?
The short answer: absolutely!
To go deeper, blogging helps improve SEO in multiple ways that boost your ranking or positioning in the search engine results pages (SERPs). Some of the top ways include:
- Blogging answers questions that your target audience has, therefore, helping to position you as an authority and showcase your expertise.
- As you answer your audience’s questions and they read your blog posts, their dwell time on your site (time spent on the site) increases.
- If your blog posts boast high quality content that offers value, bounce rate on blog posts should be lower.
- Blogging gives you a good opportunity to use long tail keywords and get backlinks, both of which improve your ranking in the SERPs.
So, if you want to learn how to write SEO-friendly blog posts that also appeal to your readers, keep reading.
How Often Should You Blog for SEO?
Studies suggest that publishing more than 11 posts a month is the magic number that moves the traffic needle in favor of both B2B and B2C blogs.
However, reaching the right answer here isn’t as straightforward as this, since your blogging frequency depends on multiple factors, including:
- Your goals: Are you planning to drive traffic or are you aiming to increase brand awareness?
- Your company size: Creating blog content takes time and effort. Of course, a small team can’t afford to do what a large one can.
Not sure where to start? Here’s help based on recent research:
- If your goal is to drive organic traffic, you need to blog 3-4 times a week in case you’re a small business and 4-5 times weekly including both fresh and updated content if you’ve a large blog.
- If your goal is brand awareness, work on 1-2 fresh blog posts weekly in case you have a small blog. For a large blog, create 3-4 new posts and refresh others every week.
Whatever your blogging frequency is, keep in mind that you want to follow a consistent posting schedule, so your audience knows when to hear from you.
Now, finally, let’s get into the meat.
How to Write SEO-Friendly Blog Posts: 10-Point Checklist
A lot of things come to mind when you are about to start writing a new blog post.
Should you add keywords from the start or later on? How many times should I insert a certain keyword? What is the best way to format and optimize body copy? Which related keywords should I cover? And more…
But frat not, because I’ll answer this and much more as I share the process of optimizing blog posts for SEO at Databox.
Here’s a peak at what we are focusing on:
- Start with proper research (keyword and topic research)
- Create an outline of your topic (format your content for search engines)
- Add a table of content
- Add bulleted/numbered lists
- Keyword placement (create content around primary and secondary keywords)
- Internal linking best practices
- External linking best practices
- Anchor text optimization
- Content length (optimal word count for SEO)
- Image optimization tips
Now let’s dive in.
1. Start with Proper Research (Keyword and Topic Research)
Obviously, you can just start writing without doing any research, not only keyword-wise but also topic-wise.
Our contributors also agree that this is the best way to start writing an SEO optimized blog post: “Effective keyword research is the key to create blog posts that are best placed to rank highly on Google. Begin with keyword research and go on to decide which keyword you are targeting, and whether it is a ‘low hanging fruit’ target, or higher volume. Create your content accordingly, researching similar blogs that have ranked highly for that term.” shares Amelia Whyman from Global App Testing.
Peter Thaleikis of Bring your own ideas Ltd. echoes the same idea. “Your keyword research should aim to answer the following questions:
- Which keywords are more often searched for?
- What questions are frequently asked?
- How difficult are these keywords?
Often a glimpse over the SERP can give you an idea: Are Q&A sites such as Quora or StackOverflow in the top ranks? If so, these are usually easier to replace than established blogs with strong internal backlinking.
If you have access to a tool such as Ahrefs you can check the keyword difficulty there. However, you should know that the numbers are more estimated than actual facts.”
So, to conclude, to increase the search visibility of a specific article the first thing you should do is to do thorough keyword research. Keyword research also includes finding additional/related keywords that align with the primary keyword.
You can find related keywords (well, actually all the keywords you need) in a couple of ways:
- By using an SEO tool
- By relying on Google search
Using Google to Do Keyword Research
For example, if you are writing a post about “blog SEO tips”, start your research by entering the keyword into your browser, and manually research the top 10 ranking pages. Keep in mind that you should look only at organic search results.
Carefully observe how your competitors structured the post, which keywords were they after, the length of the article and so on.
This is important because “This is the content that Google has deemed most relevant to the searcher, and it’s the content you have to ‘beat’ to get the traffic,” as Shortlister’s Jakub Rudnik puts it.
Alex Deckard of Aeroflow Healthcare recommends doing competitor research for your blog post in the following way: “After you have determined your primary keyword for the post, search that keyword in Google. See what type of content is ranking.
Is it an ebook, long-form article, infographic, or video?
Additionally, record what people also ask and people also search.”
On top of that, ask yourself the questions that Rudnik asks when looking at the “top five articles for the target term:
- What does each do well?
- What sections are essential?
- What doesn’t make sense for the search term?
- What headers do they use?
- How could your blog post become the best of the group?”
Once you’re done, Brooks Manley suggests taking “a different approach, going more in-depth, or getting creative” than what’s already ranking, or mimic the model that these ranking posts follow as Henry Chen of Ergo Ventures Ltd. suggests, “If the ranking posts for your target keyword are list posts, then you need to create list posts. If they are guides, then you need to create better guide posts.”
Now, once you’re done with competitive research, carefully research your primary keyword. Check the Q&A snippet toward the top of the results page. Here you will find a bunch of additional questions that you can use as subheadings of your blog post.
By searching for the primary keyword in Google, you can also see its variations — keyword synonyms, partial matches, stemming and modifiers, abbreviations etc.
They can be found by looking at the bold terms in SERPs.
Note that these are a ranking factor for our primary keyword. When you optimize for the primary keyword, you also rank for secondary keywords. And secondary keywords follow the primary keyword — creating a cluster.
To find related keywords, look for secondary keywords at related searches, Google Trends, and auto-suggest dropdown. As you can see in the example below, you can get 3 different groups of keywords just from searching for the primary keyword in Google.

One of our contributors, Martin Woods from Indigoextra Ltd’s, explains how answering questions from sections such as ‘People Also Ask’ section helps:
- “It gives you the chance to appear in the ‘People Also Ask’ sections yourself.
- It ensures that you are addressing the questions or concerns that people have when looking for a particular keyword. In turn, this will mean people spend longer on your site.
- It helps create a clear structure for your article before you even start writing.”
Using SEO Tools to Do Keyword Research
If you have access to SEO tools like Ahrefs, SEMrush, or (my favorite one) Page Optimizer Pro, you can complete the keyword research process much faster since the mentioned tools will automatically extract the top competitors, keywords and everything else that you need to start crafting an SEO-friendly blog post.

And here is the SERP analysis for the keyword SEO blog tips where you can see your top 10 competitors for the keyword.

Now those are some pretty strong competitors!
We might not ‘win’, but considering the keyword difficulty, we could at least put up a good fight.
On a side note, here are some other SEO tools that our contributors recommended either for keyword research or optimizing the body text of your article.:
Google Search Console
Sharon Hayward of Digital Platypus recommends this free tool to “identify any search phrases or questions for which your site is already appearing, but maybe not very well, perhaps on page 6 or so.”
Hayward further explains, “Start there because Google has already recognised your site as an appropriate response to this question. Then ensure the blog title matches the search question, and the first sentence explains how the blog will answer the question.”
Surfer SEO
Chili Fruit Web Consulting’s Milosz Krasinski applauds Surfer SEO tool’s “Content Editor feature”
“This allows you to use suggested keywords based on the top 10 results in a Google for given result. Make sure you click the NLP function so it will give you even more long phrases, semantic keywords, LSI and God knows what else. Overall, it will tell you the basics like the number of required headings you need and so on. It did work not only for myself but for all my SEO professional circles so it’s something to definitely look into.”
2. Create an Outline of Your Topic (Format Your Content for Search Engines)
If you want your post to rank, you need to base your outline on competitor analysis. Your post should follow a similar structure. Again, see what subheadings (related keywords have they covered), what FAQs, and so on.
For more details, check out this post on how to create a good blog post outline.
Blog optimization-wise, your article must be structured and organized neatly, not only for your users/website visitors but also to help Google better understand and pull the information from your blog post (ultimately rewarding you with a featured snippet.)
So, how can you ensure that your page is readable both to Google and web visitors?
The easiest way to ensure this is by using a roman numeral outline to structure your content.
Google looks at the hierarchical order of your content and H tags, so in order for the search engine bots to read your page, you need to format content in a specific way.
For example, this article is formatted using cascading headings. Here is another example of cascading headings.
- Types of SEO [H1]
- On-page SEO [H2]
- HTML tags [H3]
- Image optimization
- Internal linking [H3] etc.
- Off-page SEO [H2]
- Link building [H3] etc.
- Technical SEO [H2]
- URL structure optimization
- Data Structured Markup implementation
- Robot.txt optimization etc.
- On-page SEO [H2]
The point is to think of them as a hierarchy based on importance, the above being more important than the below, and add proper H tags to each.
Similar to this, an SEO expert recommended: “Write your posts in ‘reverse pyramid’ style with the key information at the top, and less important info towards the bottom. This is a style of writing taught in journalism and goes a long way towards increasing visitor engagement on a page.” shares Brendan Tully of The Search Engine Shop.
Another approach of structuring your blog posts for SEO comes from Olivian Stoica of 23FormBuilder. Stoica does the following: “Divide your content into 3 parts:
- Firstly, answer or define the topic/question the reader is interested in.
- Next, follow up with some examples and facts.
- Lastly, write your conclusions, add your own input (the ‘wow’,
- your angle of the story), something that comes as a plus and is fresher than your competitors’ content.”
The outline (or topic model as I call it) should contain your keyword-optimized title (or H1), and all of the keyword-optimized headers (H2, H3, H4…) that address the highest search volume queries that relate to the main keyword you are targeting.
This will help you rank for many of the associated keywords as well as guide the content of your article to focus on the most in-demand subtopics, which gives you a strong starting point for ranking in search.”
3. Add a Table of Content
Inserting a table of contents toward the end of the blog post introduction is not only great user experience, but it helps Google understand what information is contained in the post.
And our contributors agree. Here’s what Rob Sanders of Socially Found has to say in favor of a table of content for SEO optimization. “When creating a blog post, start making it a habit to include a table of contents.
Back in the day, when blog articles could be knocked at around 300-500 words, you would have the article read before even thinking about adding a table of contents.
Today, with articles reaching the word count in the 1000’s, it can provide the reader with a clear understanding of what you’re about to offer and how it is laid out.
Like any good book, you can use the table of contents to highlight the key headings of the article, allowing the reader to jump to that part if they are looking for something in particular to their search.”
Another reason to add a table of content to your blog post is because it also increases your chances of getting a featured snippet.
4. Add Bulleted/Numbered Lists
Any time you mention a specific number of tips in a subheading (H2 or H3), list out the tips using bullet points. This helps Google crawl and categorize the content.
Marc Andre of Vital Dollar explains why adding such elements is important when writing an SEO-friendly blog post: “Use short paragraphs, headers and subheaders, bold text, bullet points, and images to make it easy for visitors to read or scan your content. Visitors who arrive at a page that is a long wall of text are likely to bounce, and that sends a signal to Google that your page wasn’t helpful to them.”
5. Keyword Placement (Create Content Around Primary and Secondary Keywords)
This is the most important part of SEO blog optimization, and the easiest one to mess up.
So, how should you do basic on page SEO? where should you place your primary keyword? And what about other types of keywords? How many times should you add a specific keyword in your body text and headings?
Let’s start by dividing the primary keyword placement into four groups. Let’s go with A, B, C, and D.
These keyword groups are also hierarchy-based as your H tags. So, adding a keyword to group A and B is more important than adding a keyword to group C and D.
- Group A: Add to meta title/page title, H1, body content and URL – add your primary keyword here (exact match).
- Group B: H2, H3, H4 and anchor text. While anchor text is any clickable text on the page, I recommend you to focus on adding an exact keyword in your table of content and use the variations for subheaders.
- Group C: image alt text and image file names – add keyword variations and LSI terms here.
- Group D: schema, open graph, html tags – these have varying levels of strength, and they are good to establish trust authority.
When it comes to keyword variations, Kris Hughes from Domain Authority Pros highlights: “it’s essential to add variations of your primary keyword to all headings (H2, H3, H4 etc.), however do not awkwardly force these into the headings.
Think of how people talk and how would they search for the heading of the section. That’s how you should weave these in.”
To conclude, it should always be natural to use these keywords if you set your topic right.
And when it comes to the number of times you should add different keywords throughout the content, I highly recommend using an SEO tool that will analyze your competitors and show you how many times you need to add a specific keyword in your article. Surfer SEO is a great tool for that since it also counts the words as you add them and highlights them green once you’ve hit your target. It also highlights certain keywords red if you are over your limit.
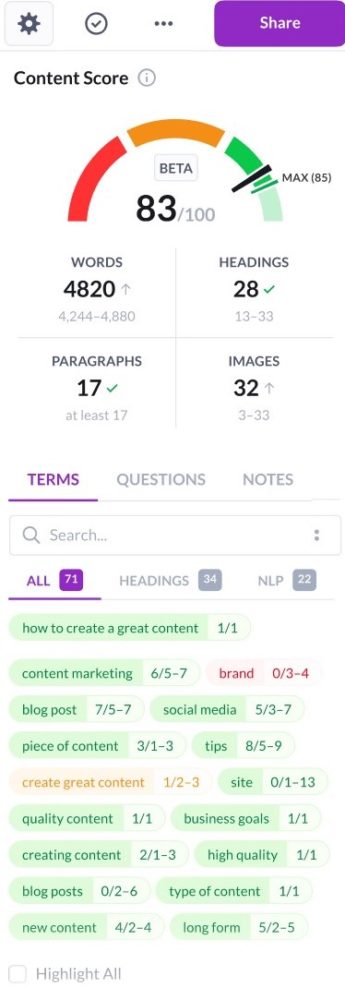
But if you want to take your blog optimization to the next level, I recommend using Page Optimizer Pro or CORA SEO Software.
Page Optimizer Pro takes your blog optimization on a completely different level because it doesn’t show you how many times to add certain keywords throughout the entire post, but how many exact match keywords, variations, LSI terms etc. should you add in your title, subheadings, anchor text (referring to the table of content) and more.
Just note that POP relies on raw keyword density (and raw word count). It’s an amazing tool for in-depth on-page optimization.
This is how the content editor looks like.
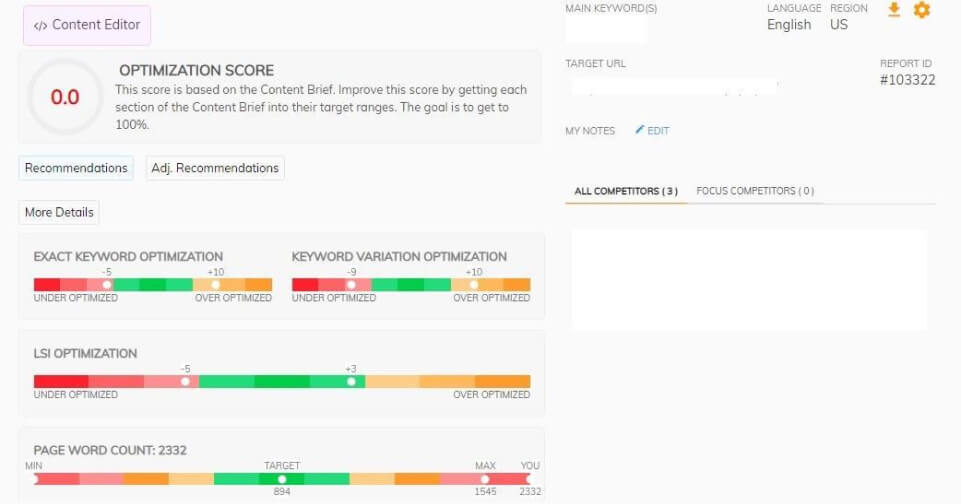
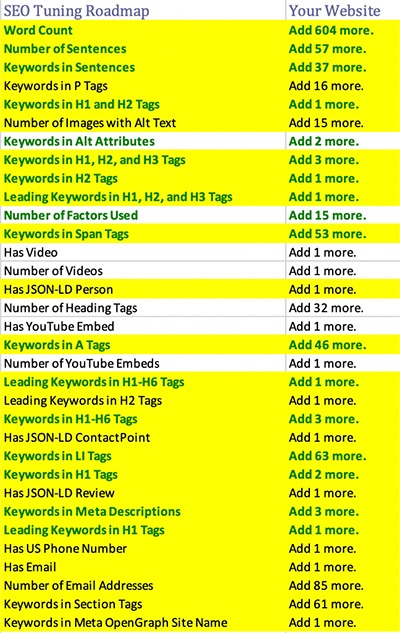
And if you want to go even further, I suggest using CORA. CORA SEO Software is an expert level SEO Diagnostics tool that measures up to 2040 ranking factors. It identifies the strongest ranking factors and tells you exactly how much of each one your page needs.
Note that (as far as I know) this is the only SEO tool on the market that automatically adapts to Google updates. Another thing you should be aware of is this is not a tool for beginners.
6. Internal Linking Best Practices
Internal links connect pages and posts on your own website and help build topical authority, distribute PageRank, and improve rankings and organic visibility.
The deeper within your website the internal link resides, the more valuable it is to add since the reader would be unlikely to find it on their own otherwise.
So, following the same logic, the more internal links a piece of content has, the more authority Google thinks these specific pages hold. However, internal linking should always make sense.
Internal links are important because they:
- Help search engines to understand your site’s structure.
- Demonstrate the contextual relationship between two pages.
- Pass authority.
- Improve UX and average time on page.
For internal linking, it’s best to follow a reverse silo structure – or simply put content clusters. A silo structures content in a manner that allows for the best possible chance for high rankings and traffic for target pages and supporting pages – they both work together synergistically through internal and external linking.
Here is a nice SEO silo illustration that shows what I’m talking about.

Our respondents also rely on internal linking and “create content clusters to rank highly for more competitive key phrases,” Mary Clare Bland of Bespoke Digital Solutions notes and further advises our readers, “Create content that serves as a reference on a particular topic. It should be well researched and written. Then, write blog posts related to this topic and link them to this post.
Google’s crawlers think a page is important if it has a lot of links to it. The more links, the better. This is true even of internal links. When you link from content in your site to other content in your site, you are sending a message to Google’s crawlers that your content is relevant.”
To ensure you’re creating internal links for SEO correctly, follow the suggestion from Daniel Cody of No Majesty: “Make sure that each post is built with other posts in mind. Blog posts on their own can rank well for specific, long-tail keywords, however when these are linked to other posts about a wider subject, these can start generating visibility for broader, higher competition keywords with larger search volume.
7. External Linking Best Practices
External or outbound links are links that point from our website to another.
In blog posts, external links are often used as references/sources (similarly to using footnotes when writing a college paper). That’s why they can also be called authority links.
So, whenever a fact, a certain number, statistic, and similar is mentioned in the article, it’s important to back up that claim with an external link (source of information).
External links are important because they:
- Explain what your site is about
- Demonstrate the depth of the topic
- Build trust and demonstrates expertise
- Improve your website domain ranking (DR/DA)
When it comes to best practices, the only right way to use outbound links is the same as you did in school/college.
Outbound links should be used to either cite your sources or to allow your readers to navigate to a website that you reference.
It is important that you consider carefully the sites that you link out to, and whether or not they are trustworthy sources.
Consider the following when choosing the best page to link to:
- How relevant is the page to your point?
- Does it cite sources itself?
- Is it the original source of data?
- Does the organization producing the page have a good reputation?
- Is the author a credible expert?
- How recently was the page published or updated?
8. Anchor Text Optimization
Anchor text should always clearly communicate the content on the other side of the link.
It shouldn’t be general or too broad (avoid general words like traffic, conversion, Facebook but rather use traffic sources, conversion optimization, Facebook ads etc.)
Anchor text selection depends on the context of:
- The piece of content where you are placing the link and
- The content behind the link itself
The best advice I can give here is to be as precise as possible.
9. Content Length (Optimal Word Count for SEO)
You don’t want a blog post that doesn’t sufficiently answer questions that readers may have. At the same time, you don’t want a wordy document that delves into unnecessary detail.
So, what is the ideal length of an SEO-optimized blog post? According to our research, between 1200-1500 words, but my advice here is to look at your competitors. Certain SEO tools like Page Optimizer Pro also suggest the length of the blog post you plan to write and rank for.
In order for your content to rank, you need to address the topic comprehensively. And our contributors agree. In words of SoftwarePundit’s Bruce Hogan, “If you want your blog post to rank at the top of Google’s search results, it needs to be the most authoritative article that matches the user’s search intent. In general, this means a longer article that covers the core topic and adjacent topics is better.”
“What’s more, Google tends to rank content that is thorough and reflects the expertise of a given website or company. As such, when writing a blog for SEO, ensure that your content is thorough, covers all of the important information and possible questions from users, and reflects your entity’s industry expertise,” concludes Dylan Zsigray of Kiwi Creative.
However, keep in mind that creating long-form content doesn’t mean you go for run-on sentences or verbose language.
10. Image Optimization Tips
Optimizing an image takes only a few seconds, yet so many people skip this step.
Keep in mind that your images are also a part of your content, and that you have to include them in your optimization process just as your text.
And doing so will make it much easier for Google to understand your content. Another benefit of image optimization is that you can show up on Google Images or beside the Featured Snippets.
So how do you optimize images for SEO?
You can optimize your images by using your keywords (and variations) in the image file name and in the alt text. This will help search algorithms understand the content of your post.
Also, use captions to describe your images (this is also a good place to weave in your keywords).
Not sure what makes a great caption?
Smallpdf’s Hung Nguyen suggests the following, “I typically add ‘Question’ keywords to these captions, which flows nicely, e.g., ‘How to do XYZ with ‘Brand Name’ below a GIF tutorial of our product.”
In addition to using keywords to describe images, you should also compress your images to avoid running into any load speed issues.
As Green Thoughts Consulting’s Jeff Green advises, “use image compression and in doing so choose the right size for each image you’re serving.”
Aim for condensing “the images to 100kb or lower,” as Chris Gadek from AdQuick recommends and remember that “there’s a delicate balance between quality and speed. Since Google is more and more interested in user experience and how fast pages load. It would be wise to focus on things that lower page speed.”
In short, these are the things we have in mind when writing and optimizing blog posts for SEO. Now let’s take a look at what our experts pay attention to the most.
How to Optimize Your Blog Posts for SEO: Additional 16 Expert Tips
We went through a 10-step checklist that shows ‘the ideal way’ to optimize your blog posts for SEO. However, you can always do more and there will always be additional things you can do to further increase your chances of ranking.
Remember how I mentioned CORA analyzes more than 2000 Google’s ranking factors to determine the best way to optimize just one page? Well, you can go that deep with SEO optimization, if you want to of course.
Here are additional 15 expert tips we sourced from our SEO contributors.
- Consider user and search intent
- Use Q&A platforms to learn more about your audience
- Conduct a content audit
- Use long-tail keywords
- Use topical keywords
- Add in semantically related keywords
- Write a compelling title for your blog post
- Find the right balance between creativity and keyword addition
- Write authoritative content
- Get to the point immediately
- Write conversationally and use your audience’s language
- Include video content in your blog posts
- Use Google’s Natural Language API demo
- Don’t over-optimize
- Always favor quality over quantity
- Review higher-ranked content
PRO TIP: How to Monitor and Evaluate Your SEO Performance
If you want to understand how your visitors are behaving on your landing pages, there are several on-page events and metrics you can track from Google Analytics 4 and Google Search Console that will help:
- Organic clicks by queries. Which search queries generate the most clicks to your website?
- Organic clicks by page. Which pages receive the most clicks from search results pages?
- Organic sessions. How many organic search sessions does your website receive?
- Organic engaged sessions. How many website visitors were engaged with your content? An engaged session lasts longer than 10 seconds, has a conversion event, or has at least 2 pageviews or screenviews.
- Views per channel. Which channels generate the most views to your website?
And more…
Now you can benefit from the experience of our SEO and website conversion experts, who have put together a plug-and-play Databox template showing the most important metrics for monitoring your landing page performance. It’s simple to implement and start using as a standalone dashboard or in marketing reports!

You can easily set it up in just a few clicks – no coding required.
To set up the dashboard, follow these 3 simple steps:
Step 1: Get the template
Step 2: Connect your Google Analytics 4 and Google Search Console accounts with Databox.
Step 3: Watch your dashboard populate in seconds.
1. Consider User and Search Intent
Tony Mastri of MARION Integrated Marketing Agency recommends, “while creating SEO-optimized blog posts, qualify all of your keyword research for intent.”
Wondering why? Because “you could spend hours researching, writing, and publishing a blog post about a transactional topic, only to find out that your blog post will never rank on the first 10 pages of search engine results.
For example, writing a blog post about ‘shoes’ is a bad idea because search engines have established that people searching for ‘shoes’ are trying to shop for and purchase shoes, not read an informational blog post about shoes.”
Therefore, “before pursuing a topic, do an actual search to see if blog posts like the one you plan to create show up in the results. If all of the results are Navigational or Transactional in nature, your topic doesn’t belong in a blog format. If the results are Informational, you are safe to pursue the topic.”
“This is what’s going to drive on-site optimization moving forward” Carlo Barajas of Alert Logic opines.
“It isn’t just about picking a keyword and optimizing an article for it anymore. Instead, we need to consider if the content we’re presenting actually meets the needs of the searcher, and additionally, that it’s in the format most useful. In other words, content needs to *deserve* to rank.”
What’s more, “your article needs to address a common pain point across your target audience in order to attract site visitors. Searchers are looking for immediate answers to their questions and you need to position yourself as a resource for your target audience. Try to anticipate the needs of your ideal site visitor and write to those needs with your search engine optimized blog content,” as FiG Advertising + Marketing’s Niles Koenigsberg elaborates.
As you go about reading blog comments, analyzing the SERPs, and checking out Answer the Public keep one thing in mind: the customer journey. This one’s a hat tip to Tom Shapiro of Stratabeat. According to Shapiro, “it’s critical to look at the entire customer journey when optimizing your blog posts.”
Ask yourself:
- “What triggered their search?
- Where do they go outside of Google for information online?
- What questions are running through their mind when they land on your site?
The more you can understand the ‘why’ underlying their visit, the easier it will be to deliver an experience that aligns with their precise search intent.”
2. Use Q&A Platforms to Learn More About Your Audience
VIP Spades’s Ognian Mikov shares another tip: “find out what information people are looking for in Q&A websites and include it in your content.”
Ashish Gupta from CodeLathe further elaborates on this, “before writing, research on the target audience, what they are already reading on blogs like Medium, Quora, Reddit and try to replicate the language. Always write for the end user while thinking about how this blog will answer their questions and solve one of the use cases.”
Mikov goes into the details: “when looking for inspiration for keywords and ideas you can head to Q&A type of websites such as Quora and Reddit. These sites are known for their huge audience covering every subject you could imagine. No matter the industry you are in, you will be able to get a few cool topics to write about.”
Here’s an example: “if you are in the card game niche, simply type ‘card games’ in Quora’s search field.
In a matter of seconds, you will get some juicy ideas.

They will be sorted by the number of answers. As a general rule of thumb, the more answers, the more popular the topic.
In our example, questions such as ‘what are the most popular card games’ will appear. That’s a killer topic to write about.”
Mikov adds, “another cool thing is that if you go briefly over the answers people left, there is a handy little info-number of views. So, in our case, we can quickly see that they are in the range of 5-6-7k which is pretty solid.
People are definitely interested in learning the answer to this question, so it makes sense to prepare a blog post on the topic. After all, we want to create content about something that people are searching for.”
Dylan Zsigray of Kiwi Creative adds, “when creating optimized blog posts for SEO, your content should reflect what users are searching for on Google.
“Most marketers understand the fundamental SEO best practices when writing blogs. You could write an amazing blog post that follows every single SEO best practice. However, if no one is searching for that topic before landing on your website, then this piece of content is not valuable.”
The solution, you ask? Zsigray has the answer: “before writing a blog, take some time to look over the queries your website shows up for on SERPs. Concentrate on those with an average page ranking… Look at terms relating to your business that users are searching for. Do you have impactful pieces of content for these? If not, steer your blog strategy in this direction.”
3. Conduct a Content Audit
This is another important task to add to your checklist as you plan which topics to cover.
Nicole Sengers of Spitfire Inbound reminds, “keep in mind that helpful, useful content that offers value to users is always the best approach for blog posts. Great content that adds value to your buyer personas is critical.”
This begs the question though: how do you always make sure you’re offering value to your readers?
While you’ll get the answer to this through this in-depth guide, here’s an important answer to begin with: “you should perform a content audit at least once a year.”
The aim is to “ensure that you update outdated content, update old blog posts and have a clear understanding on what content you have on your blog. Like many other marketing strategies blog posts should not be published and forgotten but instead, they should be optimized and updated and having a formal content auditing process can assist with this.”
4. Use Long-Tail Keywords
Hung Nguyen of SmallPDF commends long-tail keywords as alternatives to using the same set of keywords.
Nguyen recommends, “instead of keyword stuffing your articles to death—which doesn’t work in the long run (natural-sounding content helps to return users), add long-tailed keywords to your image alt tag.”
5. Use Topical Keywords
Gleb Myrko of RGray opines, “you should target TOPICAL keywords. It means keywords that are parents for the whole topic – a list of keywords that are assigned/clustered to the topical keywords by Google Robot.”
Myrko goes on, “a topic can contain from one to hundreds of supportive keywords. The main reason to target topical keywords is that if your blog post is ranked by a topical keyword at TOP 10, most probably it will also be ranked high by the majority of keywords related to the parent topic.”
You can always use a tool to unearth cluster keywords and find the topical ones too. For instance, Myrko uses Ahrefs for this.
6. Add LSI Terms (Semantically Related Keywords)
Lastly, weave in semantically-related keywords in your content.
Ariel Lim of Ariel Lim Consulting shares, “instead of using the same keyword or phrase over and over, use different variations of it as well as other keywords that provide more context about the main topic you’re writing about. For example, if you’re trying to rank for ‘SEO optimized blog posts,’ some words you can use are ‘SEO-friendly articles’, or ‘creating an article for SEO.’”
MintResume’s Joseph Wilson shares the same thoughts. “I recommend not only doing standard keyword research that involves finding head and long tail keywords but also to find semantically related keywords, aka TF*IDF.
There are tools out there that can help find keywords that commonly occur throughout top ranking posts based around a specific keyword. These TF*IDF words can help to guide a writer on new subtopic ideas or even just to sprinkle semantically related words throughout a blog post.”
7. Write a Compelling Title for Your Blog Post
Before you work on your draft: work out a title for your blog post. If you’d like, you can always revisit this part later after you’re done with the piece.
Whatever you decide, remember that “the title of your blog post is extremely important for Google search rankings. Writing compelling titles and meta descriptions grab the attention of the searcher and entice them to click,” as Supriya Agnihotri of SurveySensum puts it.
To this end, IMPACT’s Brian Casey advises, “before you decide on a title you need to do some intent research.”
“Historically, marketers do keyword research beforehand to determine a good topic and title. But if that keyword and title are going to drive unqualified traffic, you’re wasting your time. To get traffic that’s interested in your content and can turn into prospects, your search result has to be found with the right keywords and align with the type of results the searcher wants to see.”
Once done, follow these tips from Agnihotri to pen down the perfect traffic-driving title for your blog post:
- “Your title and description should not cut off on the Google page
- It should contain your primary keyword
- It should not be overstuffed and should look more natural”
8. Find the Right Balance Between Creativity and Keyword Addition
As you put pen to paper or fingers to your keyboard, remember what Endear’s Leigh Sevin comments, “strike a balance between creative excellence and strategic keyword-driven distribution.”
How so? A simple tip can help “never optimize while writing.”
So, “instead, take the seedling of an idea first (that can be a straight up keyword, e.g. ‘future of retail,’ or that can be a creative idea or customer pain point, like ‘what will the next few years of ecommerce look like.’). Then write, using your experience, research, etc.
Your goal is to craft the best possible piece. Only after you’re finished do you edit for SEO (which can be done using tools like Ahrefs or Clearscope, or just your own intuition).”
9. Write Authoritative Content
George Sheaffer of Sheaffer Construction thinks, “While understanding the power of valuable keywords is often talked about, the most important thing is to be authoritative and answer search intent.”
But why? “If someone lands on your page, you want them to trust that you know what you are writing about. That means writing strong content, supporting your content with research and providing useful, interesting or relevant information.”
Undoubtedly, authority comes from answering the questions your reader has in depth. Which is why it’s important you “write a post that really educates your readers and answers their questions or gives them the information/benefit they are looking for,” Delta Growth’s Sarah Taher prompts.
However, depth doesn’t parallel writing high word count “in an effort to use quantity as a proxy for quality,” as TJ Kelly from RaySecur, Inc puts it.
“Several of Google’s 2020 algorithm updates made clear that length does not equal strength. Instead, deliver the best possible answer and experience that solves your audience’s search.”
“The way to rank quickly and efficiently for any size niche is to look at themes, and how your competitors explore them in their content. If you don’t want to create a 5,000-word blog post – work up to it with shorter form content on the same theme. Usually 8-10 individual posts can build a strong piece of themed content. When you’re done, create a master/pillar post and link to your short-form content.”
In a nutshell, “put yourself inside the mind of your ideal reader, and answer every question. Above all, give them so much value that they want to share it with other people. A blog post that isn’t worth sharing, isn’t worth writing,” in Dewing’s words.
10. Get to the Point Immediately
One of the biggest hurdles that come with writing in-depth content is the risk of dilly-dallying around the topic.
Michael Norris of Youtech agrees, “understand the intent of your target keyword. For example, if someone searches for a recipe, they don’t need five paragraphs about your family’s heritage to kick it off. While it’s okay to elaborate to provide context, make sure you’re answering the searcher’s needs first and foremost.”
As for the technical SEO details, keep in mind that this answer immediately comes after your keyword-packed H2.
Shook explains this with an example, “if my H2 is ‘How to Identify Hornets’ the body text would say, ‘You can identify a hornet by their similar size and shape to honey bees and their distinguishable smooth, black coloring.’
By answering the question immediately and in a complete sentence, this increases the chances of your blog getting a featured snippet or showing up in the People Also Ask feature.”
11. Write Conversationally and Use Your Audience’s Language
Or, as Sy Naqvi from Make The Logo Smaller calls it, “write as if you are speaking.”
To do so, “record your articles and share them as podcasts. Google now uses audio in its SEO arsenal. Not only will your blog posts come across more authentic, the repurposed audio version of the blog will work just as hard to gain inbound traffic as the audio is scraped by search engines.”
At the same time, “write the way your prospects and customers would speak,” Jasz Joseph of SyncShow advocates. This means you say goodbye to “industry jargon and internal terminology.”
Seb Atkinson of Know Your Money is on the same page here. “Structure your article subheadings in the wording that your customers use when searching for those particular answers. This helps to make your content a closer match to what your reader is after, which could improve your search visibility for traffic driving terms.
You can use tools like alsoasked.com and answerthepublic.com to identify what phrases your customers use to find the answers you could offer them.”
Related: 29 SEO Copywriting Tips for Writing High-Quality, High-Ranking Content
12. Include Video Content in Your Blog Posts
In case you’re wondering if that works, here’s Henry O’Loughlin of Buildremote’s experience for you: “I’ve used video as a way to increase rankings for blog posts you already have ranking.
For example, if a blog post (all text) ranked in spot six in Google for a targeted keyword, we’d add video and republish the post to move it higher in Google results. Video has been worth about two spots on Google’s page one across a number of times we’ve tested it.”
The lesson learned is simple: add video content, but make sure it’s “above the fold,” adds MiCapital’s Michael Kirkegaard Clausen.
Clausen explains, “I analyzed 200 blog posts from the same blog. Half of them with video content and the other half without. Besides the embedded YouTube videos the content was written in the same style. With video, the bounce rate was significantly lower, and dwell time was increasing.”
13. Use Google’s Natural Language API demo
Another interesting SEO tip for blog posts comes from Sagapixel’s Frank Olivo who confesses, “I’m almost reluctant to share this tip since SEOs have a tendency to ruin good things, but Google’s Natural Language API demo is incredibly useful for creating ‘SEO-optimized’ content.”
Olivo explains, “at Sagapixel, we’ve trained our writers to run their blog posts through the NLP API demo just to see how Google interprets it.
To start, the categories should align well with the category of the blog post. If too many categories show up or if the confidence score is too low for the most appropriate category, that’s a sign that the post probably needs some revision.
Also, the salience of the entities relevant to what we’re writing about should be high.
If we’re writing a blog post about content marketing tips for SaaS companies, related terms should show as the most salient entities; if writing a locally-relevant blog post, the city or relevant geographic area should be in the top 10 most salient entities.”
There’s only one thing you need to be aware of here though: “don’t treat the Google NLP API tool as a glorified TF/IDF tool. Use it to get an idea of how Google is interpreting the topic you’re writing about and edit it in response.”
14. Don’t Over Optimize
As we near the end, it’s important to include this tip: never over optimize. Meg Coffey of Coffey & Tea comments, “understand what you’re writing for and make sure that you don’t over optimize.
Write for the reader not the algorithm. Yes, we want to get all the Yoast lights green but sometimes we can overdo it. Keep the reader in mind. Why are you writing this article and who are you writing it for?”
15. Always Favor Quality Over Quantity
It’s easy to get lost in the charm of ‘more content.’ Like Tom Dehnel of Dehnel Consulting notes, “many content creators get so focused on the SEO basics they forget content quality. It’s easy to overlook because content quality is such a subjective thing.
But if readers of your work don’t get that nice, quality feeling, they’re much more likely to hit the back button and spend time with someone else’s content instead. And that’s bad because user engagement is only going to become more important for SEO.”
Summarizing, Vital Dollar’s Marc Andre says, “focus on creating the best content possible. Ultimately, Google wants to show searchers the content that will be exactly what they are looking for.
Creating good, helpful, interesting content that will satisfy human visitors is also good for SEO. Google is constantly changing and tweaking its algorithm with the goal of providing better search results. Don’t try to game Google, just try to provide content that will satisfy those who are searching for it.”
More importantly, “don’t try to outsmart the algorithms of search engines,” ACTIVEWIN MEDIA’s Bernadette Kelly adds.
Instead, “stick to the fundamentals of keyword placement, informative meta-descriptions, file name, correct headings, and internal/external links to build authority.”
16. Review High-Ranked Content
“One of the most effective tactics for optimizing old blog posts is to review what high-ranking competitor content is doing, and applying what makes sense,” says Fundera’s Nicolas Straut.
“For example, if a competitor’s blog post has 25 list items, see what you can add to reach 30 list items. If competitor content is 2,000 words, consider making your content more thorough,” Straut says.
Digital House Creative’s Melissa DeMayo agrees: “Read the articles that are already appearing in the top results for your keywords, and make your post even more thorough and in-depth.”
“Identify the content gaps between existing top search results and your own content, and make sure to cover each and every key area in your post,” says Marko Saric of How To Make My Blog. “Your post should be more informative and easier to understand than all of the other top results.”
Related: How to Run An Effective Competitive Analysis & Uncover Hidden Opportunities
How to Update Old Blog Posts for SEO? 21-Point Update Checklist
And what about updating old content for SEO? What exactly does updating old posts entail? Is it the same as optimizing newly-written posts? What are the best tactics for updating old blog posts for SEO?
Well, it goes almost the same way, but not exactly.
Your primary focus with updates is to make your post “more comprehensive” to both people and search engines and “freshen it up,” but what do those things mean?
In short, “It’s important to update all areas that need it: review the copy, source new stats and imagery, and see if you can add more interest with your title. Even with evergreen content, your brand style may have evolved: your formats may have changed and now need updating. Your target audience may even have changed slightly.” advises Lucy Jones of Strategic IC.
To help you streamline the process of updating your old content, use this seo blog update checklist sourced from more than 70 SEO experts.
- Cover your topic more comprehensively
- Merge multiple posts (content consolidation)
- Consider search intent (again)
- Add, update, or replace your visuals
- Embed a video
- Freshen up your content
- Check your outbound links
- Add additional internal links
- Reoptimize for new keyword opportunities
- Refresh your titles, meta descriptions, and HTML
- Improve your blog title
- Reformat your content (if needed)
- Update the published date
- Update your URL (if you have to)
- Speed your page up
- Build new links to old content
- Add author bylines and bios
- Reconsider old posts with new goals in mind
- Create seasonal content
- Repromote old content
- Delete old content
You can find a more in-depth guide on updating old blog posts for SEO here.
1. Cover Your Topic More Comprehensively
When we asked our respondents to weigh in on the most effective factor when updating a blog post to improve its search position, comprehensiveness received the most votes:

“A great way to update an old blog post is to add new, relevant content,” says Online Optimism’s Lauren Walter. “Not only will this help keep audiences engaged, but it will also add to your word count.”
“Ideally, if you can take a shorter post and develop it into a long-form content piece that is optimized for the keywords you want to improve your ranking for, you can create a better content piece that will rank better as well,” Walter says.
Survicate’s Anna Rubkiewicz agrees: “We’ve recently discovered that a lot of our top-performing blog posts have one thing in common: they’ve been significantly built upon after the original publication. They originally fell between 500-1,000 words and were updated at least by another 500.”
“There’s one condition to keep in mind, though: the content you add to your post has to be actionable. No bloviating will do the trick,” Rubkiewicz says.
One way to make a blog post more comprehensive is to answer questions you hadn’t considered when you were writing the piece. There are a couple of ways to find questions you still need to answer.
“After a post has been up for a while, you’ve likely received some comments and questions on the post,” says Nick Leffler of Exprance. “If you can take some of those questions and add them into the post where relevant, it’s a great way to update the content for things you know readers are interested in.”
Bill Ferris of Decor Interiors recommends a second option: “Enter the main keywords from your blog post in Ahrefs Keyword Explorer and then look at the questions people are asking about the topic. You can even see the number of times each question is asked monthly.”

“If you don’t have a subscription to Ahrefs, you can also use AnswerThePublic or Google Search—the ‘People also ask’ section is a dead giveaway for what is searched most,” Ferris says.
“The most popular blog post on one of my sites is one of the very first pieces of content I published,” says Josh Wardini of Serpwatch. “To make the most of its popularity, I updated the content and turned it into an ultimate guide, adding some ‘People also ask’ phrases as sub-headings.”
“This has greatly improved the ranking of the post and also brought in more conversions,” Wardini says.

2. Merge Multiple Posts (Content Consolidation)
“If you have multiple posts on the same topic, merge those posts into one extensive post, and redirect the old posts to the new one,” says Chris Steele of Knowmad Digital Marketing.
Blair McKee of Constellix also recommends this approach: “Check if you have any related content that could augment your primary blog topic. Pull together as many resources as you can, freshen up your research, and combine everything to create a longer, more thorough piece of content.”
“If you want to preserve your existing link-building efforts, you can update the old blog, or you can write a new one and redirect the old URL to the new blog,” McKee says.
3. Consider Search Intent (Again)
Brad Smith of Codeless agrees: “Rewrite content not just to update old data and examples, but also to bring it more in line with search intent and what people are looking for. That includes word count length—sometimes shorter is better.”
“It also helps to upgrade your existing visuals and create custom illustrations to help make the content stickier—and for use in re-promoting it so it looks and feels new.”

“We did this to one old blog post, and it decreased the content exit rate by 23%, increased average session duration of SERP visitors by 280%, and decreased Facebook ad CPC for that content by 70%,” Smith says.
4. Add, Update, or Replace Your Visuals
Fisher Unitech’s Angelle Erickson recommends updating old blog posts by “adding in other engaging pieces of content such as videos, infographics, and polls.”
“If you add more visual interest, you can make the blog post more useful and increase the average time on the page, which can positively impact your search engine rankings,” says Vital Dollar’s Marc Andre.
“Simply adding quality images is one option, but depending on the content of the article, adding graphs or custom infographics can be even better. Even adding a table can add visual interest and make the post more helpful and useful,” Andre says.
And Raquel Addams of Zillion Designs recommends “changing hero images, creating quote images, or building mini infographics.”
Or go for GIFs
“Recently, we repurposed one of our old blogs about web design trends by updating the content with recent web trends and GIFs to show off the different examples,” says Blue Compass’ Mallory Cates.
“This blog used to have still images for each example, but since scroll animation and video have become more prominent on websites, our images weren’t doing a great job of showcasing these interactive design trends. By using GIFs, we were able to give our users a clear idea of what the design trend looked like.”
“Immediately after its release in December, we noticed a substantial month-over-month increase in organic traffic to our website coming from this blog. We started ranking higher in search results and began ranking for more broad keywords involving 2019 web design trends.”

5. Embed a Video
“One of the best ways to boost an old blog post is to make a video on the same (or a closely aligned) topic, embed it in the post, and republish it as a new post with a current date stamp and slightly tweaked title,” says Stephan Roussan of ICVM Group.
HQdigital’s Meghan Hultquist agrees: “Engaging video content enhances a good blog post like nothing else. Make sure your video is relevant, clear, and helpful to your audience. And for maximum user engagement (and time-on-site), make sure your video is captioned.”
6. Freshen Up Your Content
Behind comprehensiveness, our respondents reported that content freshness was the second most effective factor when updating content to improve its search position.
“When you wrote a blog post originally, you wrote it based on the best available data and trends in the market at that time,” says Nilesh Kadivar of Techuz InfoWeb. “Adding new data and trends is a great way to freshen up an old blog post.”
MarketingSyrup’s Kristina Azarenko agrees: “If you wrote about a gluten-free diet two years ago, it’s a good idea to update that old post with the new research and statistics that are available today. Updating a post with new data goes a long way.”
“In some industries, information can be updated very quickly,” says Kelly Gerrity of Fraudlogix. By having new, relevant, and correct information (by current standards), then you become authoritative on that information, building trust in your brand and boosting you up in the rankings.”
The Slumber Yard’s gives us an example, “For example, if you have an old blog post that relates to sleep, do some keyword research to see what topics and questions are trending in that particular category. There’s a good chance you’ll find new talking points, a new study, or a new controversial supplement that people are using for sleep purposes.”
“You can then add new sections to your blog that address these topics. By doing so, you’re not only alerting Google that your post is once again relevant, but you’re also adding valuable keywords to the blog post,” Ross says.
Nate Masterson of Maple Holistics also recommends using Google Trends for finding ways to freshen up your content:
“Understanding how Google Trends works is one of the keys to updating old blogs and articles since it shows interest over time. In turn, this helps content marketers create pieces which will stay relevant for the foreseeable future.”
7. Check Your Outbound Links
“Check your links,” says LyntonWeb’s Kelly Groover. “It’s easy to forget to refresh your links. If the blog that you’re re-optimizing is more than three years old, there’s a good chance your links are outdated and broken—which can harm both your SEO value and the perceived value of your content.”
“Revisiting old posts and updating links and statistics is one of the most effective ways to optimize and improve search rankings,” says Accelity Marketing’s Cass Polzin. “It takes very little time and has shown us great results.”
So what links should you update? Anything that leads to a 404 error, obviously, but also anything that could be considered outdated. “We update all the data in the post so that the sources we link to do not go back more than one year,” TextMagic’s Anastasia Sviridenko says.
8. Add Additional Internal Links
“If your company has a blogging strategy in place, you’ll likely be adding many blogs throughout the year that cover similar topics,” says Alexa Rees of seoplus+. “When updating old blog posts, add links to posts that were written after that post was published.”
“By linking your old blog posts to new ones that cover a topic mentioned in your old post, you’ll encourage users to stay on your site longer and click through several pages of similar content,” Rees says.

Manchester Warehouse’s Jim Kostopoulos also recommends adding links from old blog posts to your product category pages and/or landing pages:
“Sometimes it’s more effective to have a product or category page rank for specific terms. Update your product/category page content first, then go back to your old blogs and insert links with keyword-friendly anchor text. But as always make sure your content is relevant to the search term!”
9. Reoptimize for New Keyword Opportunities
One of the advantages of updating old content is that you have a lot more information on how people are already finding that content. This gives you insight into new keyword opportunities.
“A really simple approach to updating content to earn higher rankings is figuring out how your posts are getting found by determining the exact keywords that they’re currently ranking for,” says LeaseFetcher’s Will Craig. “Then, optimize the post for those keywords so that it performs even better.”
“Use Google Search Console’s performance report to see what keywords a blog post is ranking for,” says Casey Bryan of Grand Cru Digital. “Simply set a date range and use the filters to show data for a specific page on your website.”
Or do as True Recovery’s Milad Hassibi recommends and “look for keywords with high impressions but low clicks, adding the keywords with the highest impressions to your blog post.”
Finally, “update the title, description, and headers to include those keywords, and monitor what is working on a monthly basis,” says Natalia Makarenko of CIENCE. “This will enable each post to perform more effectively in each specific case.”
10. Refresh Your Titles, Meta Descriptions, and HTML
“Rewrite your titles, meta descriptions, and headers,” says Big Sea’s RJ Jacques. “Often times, we add them quickly and move on with the real meat of the body copy. But these sections convey important information to search engines and visitors.”
“Having problems with click-through rates from organic search? Rewrite your SEO title and meta description. Having issues with keyword visibility? Add synonyms into your H1s, H2s, and so on.”
“We’ve been able to revive old copy by adding to the body copy, but the biggest improvements we see in search come from making sure the keyword structure is baked into the entire post,” Jacques says.
11. Improve Your Blog Title
“The one tactic we rely on to optimize an existing blog post is to update the title of the post (and the title tag) to include the current date,” says Sagefrog Marketing Group’s Matthew Engelson.
It’s a tactic that lots of marketers use:

But beyond just showing that your content has been updated recently, a great title can also improve click-through rates and rankings.
“We optimize our titles and meta descriptions to (hopefully) increase click-through rates,” says Brandon Andersen of Ceralytics. “As the click-thru rate increases, Google RankBrain will slowly move it up in search results. We’ve seen articles go from not ranking in the top 50 to moving into the top 20 with just this one tactic.”
To improve your click-through rates, Referral Rock’s Jay Kang recommends reviewing competitors’ titles: “New articles are always being written. You want to review what competitors are using so that you can stand out a bit more. Think about how you’ll stand out against the other 10+ titles in the results.”
And Best Company’s McCall Robison recommends “including a stronger call-to-action in your titles and content. For example, instead of having an article titled ‘How to Create a Content Strategy,’ title it ‘Content Strategy Template: Download a Step-by-Step Guide.’”
“Changing your title will amp up your content and will likely make for a better conversion rate and an improvement in search position based on your increased amount of clicks,” Robison says.
12. Reformat Your Content (If Needed)
“Besides making sure that the topics covered in old blog posts are still relevant, I pay attention to the article’s structure,” says Digilari Media’s MinhTrang Nguyen. “Sometimes, the post’s UI looks neat and tidy, but it doesn’t have a structure that helps search engines understand it.”
“Therefore, I usually restructure old articles, building headlines and subheads, and using the right HTML headings for those headlines and subheads. I found this practice is very effective if you would like to earn featured snippets,” Nguyen says.
And Tabitha Young of 30 Degrees North recommends using ordered and unordered lists: “We’ve noticed a marked improvement in all of our older blogs that we optimized using numbered lists and/or bullet points.”
13. Update the Published Date
“When updating posts, it’s important to keep the same URL while only refreshing the published date,” says Jen Currier of The Spectrum Group Online. “This can be done by replacing ‘published on’ with ‘last updated.’ You can also list the updated date beneath the original publication date.”
“You can also include ‘updated’ in the title to let people know the post has been updated recently,” says DigiGriot’s Diana Contreras.
“You can edit the dates manually, but if you have many posts to deal with, this could take a lot of time,” says Ryan Underwood of YourParkingSpace. “If you use WordPress, there is a handy plugin called WP Last Modified Info that does all of this automatically.”

14. Update Your URL (If You Have To)
Some of our contributors also update the URL when doing blog updates. However, I recommend changing the URl only if you really have too. Changing the URL, even with a 301 redirect will most likely cause a temporary loss in ranking.
“My old URL structures included dates and didn’t highlight the keywords I was targeting in my blog posts,” says Riley Adams of Young and the Invested.
“Now when I refresh old posts, I change the URL to the best keyword match, set up a 301 redirect, and make sure that keyword appears in the title, meta description, and at least a couple headers and paragraphs. Doing this helps me rank for keywords better on older posts.”
15. Speed Your Page Up
“I’ve found optimizing for page speed is one of the quickest ways to increase the search position of older content and blog posts,” says Jennifer Chen of Team Building NYC.
“A specific example is using free image compression tools to reduce the file sizes of images in your post. You could reduce the page size by 1 MB or more, which is both a better user experience and search engine friendly.”
“Then, you can use tools like Google PageSpeed Insights or GTmetrix to verify the speed gain.”

“Recently, I updated our 10 highest-performing blog posts with compressed images. The result? Every post has increased in placement, with the largest gain being over 10 placement positions—a big win that I’m excited to replicate with our other posts!”
16. Build New Links to Old Content
Like several other respondents, Growth Hackers’ Jonathan Aufray recommends updating pages that are currently positioned on pages two or three of the search results. Find the keywords those posts are ranking for, and then “add those keywords to your post: in the H2, H3, and H4 tags and in the alt text on images.”
But in addition to refreshing your on-page SEO, Aufray also recommends “building a few new links to that blog post. Write a new blog and find another blog in your niche that’s willing to publish it (i.e. guest blogging). By doing so, your old blog post’s SEO ranking will increase and you’ll get more traffic to it.”
Related: 30 Free Link Building Tips for Building Links On Little-to-No Budget
17. Add Author Bylines and Bios
In mid-2018, Google released its Medic algorithm update, which many SEO professionals theorized put more focus on a website’s E-A-T: a term from Google’s Search Quality Evaluator Guidelines that stands for expertise, authoritativeness, and trustworthiness.

To improve your E-A-T, Nextiva’s Yaniv Masjedi recommends adding author bylines and bios to all old posts that don’t include those details. “The ‘A’ in E-A-T stands for authority. Today, simply adding in staff members’ credentials will go a long way in bumping your content up higher in SERPs.”
18. Reconsider Old Posts with New Goals in Mind
“A lot of our evergreen blogs that get the best traction are posts that we re-share with updated content and keywords,” says demandDrive’s AJ Alonzo. “Our blog library spans a ton of different topics, and because of that, we’re able to re-purpose quite a bit of it for use in current campaigns.”
“For example, if we have a campaign that’s focused on metrics, we dig through our library and pull up older posts related to that topic. We’ll add and update keywords to keep up with our current SEO strategy, and then go about editing sections that we think could use a facelift.”
“This way we’re not changing the concept or message of the blog, but modernizing it to fit with our current campaign direction. Nobody wants to spend time re-inventing the wheel. It’s much easier to refine the wheel to fit your current needs.”
Are you using spreadsheets to set and track your goals? To be honest, you will never hit them that way. Visualize your goals against current performance and make your performance more predictable with Databox’s goal tracking software.
19. Create Seasonal Content
If you’re struggling to know when to update old content, PACIFIC Digital Group’s Carolyn Albee recommends creating seasonal content that’s designed to be updated once a year:
“Think school graduations, summer barbecues and drinks, back-to-school content, or winter travel destinations. PACIFIC’s clients have seen great success with timely posts like ‘The Ultimate Snowblower Storage Guide,’ as well as seasonal travel posts like ‘The Most Festive Holiday Towns.’”
“Then, update the post each year with new information. Keep the content on the same URL to build authority, and each year you refresh, you’ll see more and more engagement. PACIFIC refreshes blogs like ‘Best Places to Fish’ and ‘America’s Most Artistic Towns’ annually and sees skyrocketing performance each year.”
“Timeliness can relate to your business offerings, as well. Opening a new location, offering a new service, or running a sale on a certain item? Look through your old posts to find related content, and refresh it! You’ll drive people to your page just when you need it most.”
20. Repromote Old Content
Once you’ve updated your old content, repromote it. “Many businesses feel that they have to have new content to share with their audience, but just because a piece is old doesn’t mean it isn’t quality or relevant,” says Catalyst Marketing Agency’s Ollie Roddy.
Jennifer Noto of Carolinas IT agrees: “We share older posts on social media periodically. For example, on World Password Day, we always share a post about ‘How to Create a Better Password’ as guidance for creating strong passwords.”
21. Delete Old Content
“One of the best tactics for optimizing old blog posts may be to get rid of them entirely,” says Ben Johnston of Sagefrog Marketing Group.
“Pruning your content can be an incredibly effective way to increase the efficacy of your pages. If the blog section of your site is bogged down with older blogs that aren’t ranking for anything, especially after repeated optimization attempts, the best option may be to give it the ax.”
“By eliminating old content that is no longer relevant or is having trouble generating traffic after you give it a few tries, you free up space for Google to value other content on your site and can prevent keyword cannibalization.”
How to Find and Update Old Blog Posts for SEO Using Databox
Now that you know how to optimize blog posts for SEO, you might be thinking, which blog post should I update first?
In an ideal world you’d probably like to keep every blog post on your site fresh, but in the real world, that’s not always practical.
The good news is that you don’t have to update every post you’ve ever written every year.
You’ll see the greatest ROI by focusing on the posts that already have some search equity—those that were at one time ranking highly and driving lots of traffic but are no longer doing so.
But here’s the problem: finding those big-opportunity posts in Google Analytics (or similar other tools) is an incredibly time-consuming process. Finding them in Databox, on the other hand, takes only minutes.
If you’re wondering how to find blog posts that need to be updated, follow these instructions to do it quickly, easily, and efficiently in Databox.
When Should You Update Blog Posts for SEO
Before we continue, let’s just take a quick look at some of the top scenarios when you should consider updating an old blog post:
- If your blog post isn’t ranking as highly as before
- If your blog post isn’t generating as much organic traffic as it used to
- If the information in your article is outdated
- If someone outranked you in the meantime
Updating old blog posts for any of the reasons mentioned above can help you regain lost rankings and reclaim the traffic you’re currently losing out on.
In fact, nearly half of the experts who responded to our latest survey say that 61-80% of their organic traffic comes from “old” blog posts:

And some of our respondents reported that more than 90% of their leads also come from “old” content:

Finally, updating old blog posts is also good for you as a content creator. By refreshing an old blog post, you are effectively launching a new post without actually having to write a new one.
So updating old blog posts drives three big benefits: higher rankings, a better user experience, and improved results with less effort.
Related: Here’s How We Increased Website Traffic by 75% in 6 Months By Updating Old Blog Posts
Now let’s learn how you can use our SEO dashboard software to find which blog posts need an SEO update in 4 easy steps. (This should take you less than 10 minutes to do!)
- Step 1: Downloading Databox’s Pre-Build Reporting Template
- Step 2: Create a Traffic Comparison Datablock
- Step 3: Create a Rankings Comparison Datablock
- Step 4: Use Your New Dashboard to Find Posts That Need SEO Updates
Step 1: Downloading Databox’s Pre-Build Reporting Template
So, to get started immediately, grab this free Decaying Site Pages & Posts dashboard.

In order to access this pre-built template, you will either have to create a free account or sign in to your existing Databox account and follow the in-app workflow to connect your Google Analytics and Google Search Console accounts.
When your dashboard is ready, follow these instructions to learn how to use your new dashboard to find posts that need updates.
Step 2: Create a Traffic Comparison Datablock
The first datablock we’re going to create is a table that will show us which pages of our site are getting less traffic from organic search than they used to.
Select the “Visualization types” icon in the left navigation bar, then drag and drop the “Table” option onto your dashboard.

Click on your new table datablock to open the right settings panel. In the settings panel, select your Google Analytics property for “Data source.”

For “Metric,” click “Custom.”

Click “+ New Custom Metric.”

Now we’re going to tell Databox what data we want to display in our table. Make the selections below in the specified fields:

Once you’ve made all of these changes, click “Run query” so Databox can validate that the data you’re requesting exists and can be pulled. When it’s satisfied, you’ll see a “Save” button. Click it to save your metric and populate your datablock with the requested data.

After you save, you’ll be returned to the dashboard view. In the settings panel on the right side of the screen, click in the “Date ranges” field and select “Last 90 Days” and “Last 12 Months.”

Finally, scroll down until you see “Limit rows.” In the field next to it, enter the number of pages you think you have on your website (up to 999). If you’re not sure, either make your best guess or just start with 100 and increase the count later if needed.

It can take a few minutes for Databox to pull the data, so in the meantime, we’ll set up the other datablock we need for this project.
Step 3: Create a Rankings Comparison Datablock
The second datablock we’re going to create will show trends in the average Google ranking positions for the different pages on our site.
Select the “Visualization types” icon in the left navigation bar, then drag and drop the “Table” option onto your dashboard.

Click on your new table datablock to open the right settings panel. In the settings panel, select your Google Search Console site for “Data source.”

For “Metric,” we’re going to use a pre-built metric this time. Click in the “Metric” box and scroll through the list until you see “Position by Pages,” then click it to select it.

For “Date ranges” you will want to select the same date rages that you picked for your other datablock: “Last 30 Days,” “Last 90 Days,” and “Last 12 Months.” Select those three options, deselect “Month to date,” then click anywhere else on the screen to apply the changes.

Scroll down until you see “Limit rows.” In the field next to it, enter the number of pages you think you have on your website (up to 999). If you’re not sure, either make your best guess or just start with 100 and increase the count later if needed.

Finally, next to “Sort order,” change the option to “Ascending.”

Step 4: Use Your New Dashboard to Find Posts That Need SEO Updates
Now that your SEO dashboard is ready, you have all of the data you need to find out which of your old blog posts need to be updated.
Start by picking the timeframe you want to compare in the first datablock we created:
- If you select “Last 30 Days” in the timeframe dropdown, your percentage change indicator will show you how your traffic in the last 30 days compared to your traffic in the 30 days prior to that.
- If you select “Last 90 Days,” it shows how your traffic over the last 90 days compared to traffic in the 90 days prior to that.
- If you select “Last 12 Months,” it compares traffic from the last 12 months to traffic from the 12 months prior to that.
Usually, you’ll select either “Last 90 Days” or “Last 12 Months,” depending on how old the blog posts on your site are.
If you’ve only been blogging for a year, select “Last 90 Days.” If you’ve been blogging for many years and have rarely updated your blog posts, select “Last 12 Months.” Change the timeframe on both datablocks.

Now, scroll through the list in your first datablock and look for posts that get a decent amount of traffic but are showing steep, double- or triple-digit declines. These are likely the posts that are losing search rankings.

You can double-check by finding the same pages in your second datablock. If it’s showing a decrease in average search position, you’ve found a post that likely needs to be updated.

Tip: you can use Google Chrome’s find feature (Control + F on Windows or Command + F on Mac) to search for and highlight the post you’re looking for to make it easier to find that post in a long list of URLs.

Go through this list, and make a note of any posts with big traffic drops and average position drops. You’ll also want to check the posts to make sure there aren’t any seasonal or other logical reasons for the decline. Otherwise, these are going to be the most important—and most impactful—posts for you to update.
It takes a few minutes to get your dashboard set up in Databox the first time, but once you’ve set it up, you can access this data anytime. As long as you’re an active Databox user, it will continue to populate your dashboard with up-to-date data.
So if you want to do this same exercise again in three months, just open your dashboard and grab what you need. Going forward, you can compile a list of posts that need to be updated every time you need one using your Databox dashboard.
If you are not a Databox user, it’s super easy to get started, and creating an account is free.
Start Boosting Your SEO Rankings
That’s it folks, we went over a lot of different things today – from explaining the fundamentals of blog SEO and sharing expert blog SEO tips (both for new content and content updates), to talking about our own SEO update process and finally showing you how to use Databox reports to find which blog posts need an update.
You have everything you need to create an SEO-optimized blog right here, so go ahead and start boosting those rankings!