


Table of contents
HubSpot Reporting makes it easy to gather data and build reports, thanks to HubSpot’s comprehensive CRM platform and built-in reporting system.
Since reporting plays such an important role in decision-making, identifying problems, performance evaluations, activities planning, and more, you need to ensure your reports cover all the information you need.
Even the best tools can be made to work even better, and we’ll cover the platform’s important features and explain the methods you can use to get the most out of HubSpot reporting.
- What Is HubSpot Reporting Software?
- The Basics of HubSpot Reporting
- Top Features of HubSpot Reporting Dashboards
- How to Use HubSpot Reporting Tools to Create a Report
- HubSpot Reporting: Most Popular Marketing Metrics to Track
- The Benefits and Limitations of HubSpot Native Reporting
- Improving Marketing Reports with HubSpot Reporting and Add-ons
- HubSpot Reporting Templates
- How to Automate HubSpot Reporting with Databox

What Is HubSpot Reporting Software?
HubSpot Reporting Software allows you to build custom dashboards with powerful analytics drawn from a multitude of data sources. With flexible dashboards, you can combine multiple reports into a single presentation and let everyone focus on what matters to them. It’s excellent for inbound marketing and can track anything from blog metrics and SEO to brand mentions on social media.
The Basics of HubSpot Reporting
HubSpot combines CRM and marketing software into an all-in-one sales and marketing platform. You can use it to follow the customer journey from the beginning until conversion, allowing you to understand how to reach them better.
The built-in reporting tools can be divided into reports (this includes the reporting add-on), analytics tools, and dashboards.
Let’s take a closer look at each.
- HubSpot Reporting: Default Reports Overview
- Advanced Analytics in HubSpot Reporting
- HubSpot Dashboards
HubSpot Reporting: Default Reports Overview
HubSpot provides default reports for marketing, service, and sales, but other types are available, and you can even build your own. While proper analytics tools allow for more detailed data exploration, HubSpot reports provide summaries that can help businesses understand how they’re performing.
HubSpot Reporting Add-On
This is a supplementary tool that costs $200 per month (with a 10-day free trial) and combines all marketing and sales reports into one interface. It makes it easy for the respective teams to stay current when it comes to relevant metrics and ensures all reports are up to date. The tool supports over 200 pre-set dashboards, has access to templates, and allows for the creation of custom reports.
Advanced Analytics in HubSpot Reporting
Where reports present data in a neat and easily-understandable package, analytics tools allow you to dig a bit deeper into the data. Looking at raw data will help you understand customer behavior and market trends better, which will then let you improve the effectiveness of your marketing strategies.
Let’s take a closer look at each HubSpot analytics tool.
Traffic Analytics
HubSpot can track website traffic, allowing for more detailed data analysis by the traffic analytics tool.
With it, you can monitor the effectiveness of your topic clusters, where your visitors are coming from, and the effectiveness of UTM parameters or traffic tags on website traffic. With this information, you can see the metrics-related data like conversion rates, page views, new customers, etc.
Related: Google Analytics and HubSpot: How to Use Both to Track Your Website Analytics Effectively
Website Analytics
This tool tracks data on website performance for a variety of metrics, including bounce rate, average time spent on a page, page views. You can use it to analyze landing pages, blog posts, or any other type of page. In addition, you can filter all that data by date range, allowing you to see the impact of any changes you’ve made, search engine algorithm updates, or rising trends.
PRO TIP: Looking for an effective way to analyze your landing pages and find out what exactly creates new contacts for your business? Watch the video below to learn how you can use Databox and HubSpot to track and visualize your most important Landing Page metrics, and how to interpret the gathered data.
Ad Analytics
With HubSpot, you can analyze how your online ads are performing. By connecting it with your social media accounts, you can build reports that showcase how impressions, customers, clicks, and other metrics are impacting ad performance.
Ad dashboards display metrics like engagements, CTR, and the number of contacts by lifecycle stage.
PRO TIP: Here’s everything you need to know about HubSpot Lifecycle stages, including how to set them up and visualize their performance in HubSpot and Databox.
Campaign Analytics
The campaign analytics tools measure the effectiveness of campaigns created in HubSpot. By tagging specific content and marketing assets, you can assess the performance of your marketing efforts in five areas:
- Sessions
- Influenced deals
- Influenced contacts
- New contacts
- Influenced revenue
No matter what channel you’re tracking (social media posts, blogs, or CTAs), you can combine and synthesize disparate data points and get a comprehensive overview of your marketing campaign. That way, you can keep an eye on the leads and revenue generated by the campaign.
HubSpot Dashboards
HubSpot dashboards present you with an overview of up to ten different reports. This way, you have easy-to-understand summaries of your performance in different areas.
- The default marketing dashboard can handle up to ten reports focusing on the most relevant and common marketing metrics like email performance, conversion rates, and page views.
- The default sales dashboard can present up to five reports. The metrics it uses are productivity, sales performance, deals forecast, team activity, and deals closed vs goal.
- The default service dashboard shows you tickets, customer feedback performance, and knowledge base information.
These dashboards can be customized to include up to ten reports. After you create a report, you can simply add it to one of your existing dashboards. Customized dashboards allow you to include all types of reports, helping you get a complete picture of the customer journey and your overall performance.
PRO TIP: Keep Track of Your Sales Team’s Performance Like a Pro
No doubt, your sales team is busy every day setting up appointments, making calls, creating and nurturing deals, and closing them to generate new revenue. A Sales Manager’s job is to monitor sales performance and work with team members to improve it. To do that, they need up-to-the-minute information at their fingertips, including details like:
- Emails logged. Use this metric to track and compare side-by-side the number of emails sent, received, and responded to by each sales rep during a certain time period.
- Calls. Track the number of calls made and received by each of your sales reps during a certain time period.
- Meetings by Rep. Which sales rep had the highest number of prospect and customer calls or meetings last month? Are your sales reps meeting their engagement goals?
- Notes by Rep. Are your sales representatives taking notes during calls? If so, how frequently?
Now you can benefit from the experience of our HubSpot CRM experts, who have put together a plug-and-play Databox template showing some of the most important metrics for monitoring your sales team’s activity. It’s simple to implement and start using as a standalone dashboard or in sales reports, and best of all, it’s free!

You can easily set it up in just a few clicks – no coding required.
To set up the dashboard, follow these 3 simple steps:
Step 1: Get the template
Step 2: Connect your HubSpot account with Databox.
Step 3: Watch your dashboard populate in seconds.
Top Features of HubSpot Reporting Dashboards
This is the main workspace when it comes to HubSpot reporting. It helps you monitor and stay up to date with all marketing, sales, and service activities. In addition, you can use it to visualize the data and get a comprehensive overview of all relevant metrics and KPIs.
HubSpot CRM contains all the information about customer status, buyer personas, deal stages, and so on. It’s all visualized on customizable dashboards.
Here are the seven most important features of HubSpot reporting dashboards:
- Sales Reports
- Marketing Reports
- Performance Assessment
- Productivity Assessment
- Deal Forecasting
- Deals Closed vs. Goal
- Recent Activity Feature
Sales Reports
This report can help you visualize the numbers and statistics tied to conversions and sales over time. Here are the most important metrics included in Sales Reports:
- Cart abandonment rate
- Sales performance
- Sales over time (by day, week, or month)
- Recovered abandoned carts
- Customer conversion pages and blogs
- Contact Conversion pages and blogs
- Landing pages with the highest conversion rates
Marketing Reports
This report allows you to get an overview of all active marketing campaigns in one spot. You can use it to measure the effectiveness of your marketing activities via charts and graphs. They’re fully customizable, and you can change their appearance and distribution with just a few clicks.
Here are some common metrics included in HubSpot Marketing Reports:
- First conversions
- Top landing pages
- Top blog posts
- Page performance
- Traffic on various types of web pages (blog posts, landing pages, etc.)
- Contacts (by day, title, and source)
- Social media marketing
- Traffic analysis from the campaign
Performance Assessment
With this report, you can evaluate overall sales, service, and marketing performance over time for a specific period. It allows you to see the number of canceled and closed deals, assigned and worked contacts worked, etc.
Productivity Assessment
It’s essential to know if your marketing strategies are working and if the allocated budgets are paying off. You can use this report to examine the effectiveness of your marketing efforts and check the number of calls, emails, notes, tasks, and meetings your team has logged in the selected period. Then, you can compare those numbers with your marketing, sales, and support performance.
Deal Forecasting
HubSpot allows you to do more than simply visualize data. Thanks to its AI-powered data analytics, it can help you predict trends and future opportunities based on existing data. You can even build forecasting reports that allow you to predict the revenue at each stage in the future.
With this feature, you can stay up-to-date with relevant information and ahead of the competition, as you’ll be able to plan better. The Deal Per Order plugin makes breaking down orders into stages simple and you can track all deals individually.
PRO TIP: Looking for ways to visualize your sales forecast data from HubSpot CRM? Watch the video below to learn how to set up and track your HubSpot CRM data in Databox and more accurately forecast monthly or quarterly sales.
Deals Closed vs. Goal
The reporting dashboard will give you the number of deals your team closed and compare that with the goal number. You can see how your team is doing at a glance, and customize the dashboard to tell you about closed deals, closed contacts over any period you want.
Recent Activity Feature
With HubSpot, you’ll stay up-to-date with every activity that’s happening on the dashboard. You can track recent team activities, including recent e-mails, meetings, notes, tasks, and calls logged.
Related: 23 Tips for Tracking Sales Activity with HubSpot CRM
How to Use HubSpot Reporting Tools to Create a Report
While default reports work just fine, custom reports are essential if you want to really fine-tune your reporting. Before you start building custom reports, ensure that your data sources are reliable, relevant, and up to date.
Creating a custom report with a custom report builder is fairly easy and involves five basic steps:
- Select data sources for the report
- Configure the visualization
- Add fields to the report
- Customize filters
- Save or export the report
Selecting Data Sources
This is the basis for your report; what you’re reporting on. You need to pick the primary data source as the focus of the report, while other data sources will be secondary and will tie into it. The report will only show information from secondary sources that are associated with the primary source.
If you have an Operations Hub Enterprise subscription, you can base your report on a dataset. Otherwise, you’ll have to select the data sources manually.
If you want to select data sources manually:
- Select the primary source from the Primary data source menu.
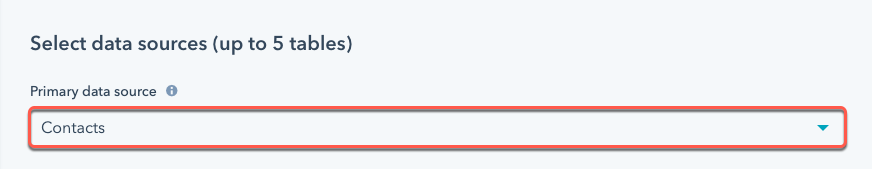
- Select the secondary sources by picking Marketing, Sales, CRM, Service, and Custom object (available only in Enterprise packages) sections.
- NOTE: Secondary source data needs a path that will connect it to the primary source and some source combinations aren’t possible due to lack of a path, while others are selected automatically in order to create that path. You can add up to five data sources to a report, including automatically selected ones.
If you want to select a dataset for your report, the procedure is fairly simple.:
- Click on the Datasets tab.
- Select the dataset that you want.
To name your report, click the pencil icon and give your report a name.
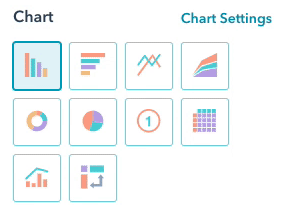
Visualizing Your Report
You should consider this step even before you start building the report. Consider the best way to visualize the data and what metrics you want to focus on. The Custom Report builder offers the following ways to visualize your data:
- Bar graph
- Line graph
- Columns
- Area graph
- Doughnut graph
- Pie chart
- Summary
- Table
- Combination
- Pivot table
Just click on the Configure tab and pick the visualization you want.
Related: 9 Most Helpful Custom Reports in HubSpot
Adding Fields
To add fields, you need to select activity measurements, specific properties, and events. The available fields will be based on the data sources you selected for the report, and the number of fields will depend on the report type:
- Bar, area, line, and combination charts: Maximum of three fields, four with an additional Y-axis.
- Donut, KPI, table, pie, and pivot table: Maximum of 20 fields.
To add fields:
- Select the data source with the field you want to add.
- Click and drag the field from the sidebar into the configuration slots.
NOTE: Depending on the report you’re creating, fields can be dimensions or measures. Some configuration slots can contain only one or the other. For example, if you create bar chart, the Y-axis can only contain measures.
- If you want to edit a field, click the down arrow icon and edit the field details in the dialog box. You can change the field’s name, aggregation, or data sorting method.
- To add another Y-axis to a chart, click + Add another Y-axis and drag a filter into the new slot.
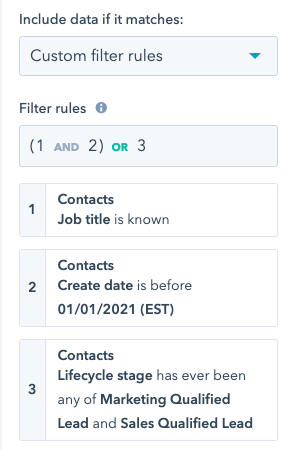
Customizing Report Filters
Customizing report filters allows you to display more specific data in the report.
To customize the report filters:
- Click the filter tab.
- Set other filter rules by clicking the Filter rules dropdown menu and selecting any, all, or custom filter options.
- All filters option means that data should adhere to all conditions
- Any filters option means that data should adhere to one or more conditions
- Custom filters option requires you to create a custom rule grouping
- Add conditions to your filter fields:
- Below inactive filters, click a field.
- Select a condition for the field.
- Select the value for the condition.
- Click Apply.

- To group filters with AND and OR logic:
- Click the filter you want to group.
- Select the filter you want to group with the first filter from the Group with another filter dropdown menu.
- Click Apply.
NOTE: You can later update the operator within the group by clicking on it or you can enter text into the Filter rules field and simply type out the logical operations.
Saving or Exporting Your Report
And you’re almost there.
Once you’ve set up everything to your liking, you can save the report to your report lists or dashboard or export the data from HubSpot.
Just click Save and pick where you want to save the report. This can be an existing or a new dashboard or a reports list.
If you want to export a report to use the data offline, click Export, enter the name of the export, and select the File format.
Now you’re done. The report has been saved and/or exported.
NOTE: Reporting and Data Limits
HubSpot does have some limits that might not be apparent when you’re building a report in a custom report builder:
Non-table reports are limited to 1,000 unique rows of data. You can reduce the number of rows by adding filters that will make your data more focused or using dimensions that have a lower number of unique values.
New data takes 10–15 minutes to appear in reports.
Reports will automatically refresh every two hours with newly available data. If you want to pull new data before the next refresh cycle you can manually refresh a report by clicking Refresh.
Event reports have a maximum range of 12 months or 10 million events. If there are more than 10 million events for the selected type, the timeframe will be shortened. The minimum time frame for event reporting is one month.
Some fields (for example HubSpot team and Owner) will export with internal IDs rather than HubSpot labels.
Related: 13 HubSpot CRM Custom Fields You Should Setup
HubSpot Reporting: Most Popular Marketing Metrics to Track
Metrics are the backbone of every report and you need to ensure they’re useful and that you’ll be able to draw actionable insights from analyzing them.
Here are the most tracked HubSpot marketing metrics:
- Sessions – This is a series of analytics activities taken by a visitor to your website. These activities include page views, CTA clicks, events, etc. A session expires after 30 minutes of inactivity.
- New Contacts (w/o Offline Sources) – This metric calculates the number of new contacts (or email addresses) generated during a specific time frame.
- Sessions by Source – This metric shows sessions over time, divided according to traffic source (organic search, email marketing, paid search, paid social, etc.). It’s useful if you want to find out which channels draw the most traffic to your website.
- New MQLs – Marketing qualified leads (MQLs) refer to leads that are qualified according to user-defined criteria. Because they’re qualified, they’re usually nurtured with more marketing material to lead them further down the sales funnel.
- New Contacts by Source – These are specific sources (email, organic search, direct, social media, etc.) that generate new contacts during a specified time period.
- New Customers – This is the number of customers whose first conversion occurred in a specified period.
- New SQLs – Sales Qualified Leads are sorted by user criteria and usually refer to leads that are ready to be engaged by the sales team.
- New Leads – These are contacts or companies who have converted on your website or through some other interaction beyond signing up for a subscription.
- Contacts by Smart List – You can use HubSpot to organize leads according to tracked contact or company property. A ‘smart list’ is based on the properties you’ve chosen to focus on, and ‘Contacts by Smart List’ is the total number of contacts that fulfill that specific smart list criteria.
- Emails Clicked – A straightforward metric that shows how many times an email sent through HubSpot was clicked during a given period.
- Blog Posts Views – This metric shows the number of views on blog posts over time. The number is cumulative and can be set for a specific time period.
- Marketing Performance – With this report, you can get access to leads, traffic, and customers over a period of time. It allows you to include offline resources and you can compare current and past numbers, as well as include goals.
- Blog Posts Performance – This report will show you a snapshot of the most important performance data from blog posts. You’ll be able to check the number of views, CTA views, entrances via the blog post, conversion rate, and more.
- Top Website Pages by Views – You’ll find out what are the most visited website pages and can look at the data historically.
- Top Website Pages by Customer Conversion – This report tells you what’s the last website that someone visited that referred them to a page where they converted into a contact or a subscriber.
- Sessions over time – This metric tells you how many sessions your web pages get, broken down by day.
- Deal Forecast – With this metric, you can see the predicted revenue for deals in each stage of your deal pipeline.
- Sales Performance – By looking at Sales Performance, you can see your overall sales progress. The metric shows you contacts being worked in the CRM and the number of created and closed deals.
- Average Order Value by Source – If you want to find out what’s bringing in the most revenue, you should include this metric in your reports.
- Landing Page Performance – This is an excellent way to view landing page metrics by examining the most important landing page data like views, total submissions, new contacts, and view-to-submission rate.
- Active Campaigns – This metric shows your top campaigns, broken down by the number of inlfuenced contacts during the specified time period.
- Email Performance – This dynamic report will show how your emails perform over time. You’ll know which messages resonate, which need to be revisited, and how it all comes together.
The Benefits and Limitations of Native HubSpot Reporting
We’ll go into more detail about what HubSpot does well and what it needs improvement:
Benefits of Reporting in HubSpot
- It can function as a standalone platform. You can use HubSpot as a comprehensive sales, support, and marketing platform and create reports without any other tools and integrations.
- It has a user-friendly interface that allows you to create and customize dashboards and reports for marketers that don’t need granular data.
- With HubSpot Reporting Add-on, you can access Marketing and Sales data in one spot via central dashboards.
- It allows you to track, measure, and monitor the entire customer’s journey on one platform.
Limitations of Reporting in HubSpot
- HubSpot does not support importing data directly from other sources.
- It’s sometimes difficult to analyze the numbers in HubSpot reports in detail. The only solution is to export the data into a spreadsheet, but this process can’t be automated natively and requires the use of another tool like Databox.
- The user interface is somewhat restrictive and allows only for limited report visualization changes.
- You can’t combine data from multiple HubSpot portals, making it difficult to create comprehensive reports covering all portals.
Improving Marketing Reports with HubSpot Reporting and Add-ons
While HubSpot is an excellent tool, its limitations leave some functionality gaps that can be improved upon with third-party tools. You can use them to speed up your processes, streamline the workflow, and make use of more comprehensive data analytics.
Use HubSpot with other marketing tools
Since HubSpot doesn’t support importing data from other sources and exporting it into spreadsheets can be a chore, using third-party marketing tools can significantly improve its functionality. If you’re using other analytics tools and services, you‘ll need to turn to other solutions if you want to have a complete overview of your marketing efforts and their effects.
Tools like Databox allow you to build reports that draw metrics from a variety of data sources. In fact, Databox originated as a tool that was meant to be used with HubSpot to help users overcome some limitations of similar platforms.
Analyze data from HubSpot in a spreadsheet
As we mentioned above, HubSpot’s user interface is restrictive, and its reporting capabilities make it difficult to perform an in-depth analysis of the provided data. Many marketers turn to spreadsheets (either Microsoft Excel or Google Sheets) to deal with this problem.
However, while these tools are simple to use and very customizable, using them can be exceedingly time-consuming. This is where tools like Databox come in. They can automate the process by importing all marketing, service, and sales data from a spreadsheet, allowing you to modify and analyze the data in a dashboard in any way you want.
Create Looped HubSpot Reports
A single dashboard is rarely enough if you want to present a comprehensive report. Third-party reporting tools allow you to loop multiple dashboards together and create a complete report that covers all the relevant information.
Looped dashboards allow you to link multiple accounts from multiple clients into a single dashboard report. Instead of having to switch between multiple accounts and then cobbling the data together every reporting period, you can spend more time actually analyzing information and improving performance. You only have to create the dashboards once, loop them together, and just send the link to everyone who needs it.
HubSpot Reporting Templates
Pre-built reporting templates and dashboards make marketers’ lives much easier, and the process of building reports much faster.
Here are some HubSpot reporting templates you can use right away or modify as necessary:
- HubSpot Marketing Dashboard
- HubSpot Email Campaign Dashboard
- HubSpot (Blogging Performance) Dashboard
- HubSpot (Landing Pages Performance) Dashboard
- HubSpot Social Media Tracking Dashboard
- HubSpot CRM Dashboard
- HubSpot (Sales Activity) Dashboard
- Hubspot CRM (BDR Sales Rep Habits) Dashboard
- Sales Overview Dashboard
- Hubspot Sales Rep Performance Dashboard
HubSpot Marketing Dashboard
This HubSpot Marketing dashboard template will show you how your marketing funnel is performing. With the information provided, you’ll be able to increase traffic, convert leads, and improve ROI.

It will help you monitor metrics like:
- Sources of Site Traffic
- Email Clicks and Opens
- Conversion Rates throughout Funnel
- Daily Traffic
- Traffic Amounts, by Source
HubSpot Email Campaign Dashboard
To run a successful email campaign, you need to monitor KPIs, track campaign performance, and get actionable insights from the available data. This HubSpot email campaign dashboard template will give you access to important metrics like:
- Emails Clicked
- Emails Opened
- Emails Sent
- Emails by Source

All metrics are customizable, and integrating the template with HubSpot allows you to pull additional data.
HubSpot (Blogging Performance) Dashboard
In order to ensure our blog is performing well, you need to track the right metrics with a HubSpot blogging performance dashboard. You can connect it with your HubSpot Marketing account and learn:
- How to measure blog performance
- How many page views did your blog get during the last month?
- What are your most viewed blog posts?
- What are your top-performing blog posts based on their CTRs?

This free, intuitive, and well-designed dashboard template can get you an excellent overview of your blog’s performance, and Databox’s integration options will ensure you have access to all the data sources you need.
HubSpot (Landing Pages Performance) Dashboard
This Hubspot Landing Page Performance dashboard template will help you analyze activity across your landing pages. It can check the previous 30 days, previous month, and the past year. The template includes the following metrics:
- Blog Views
- Emails Clicked
- Landing Page Contacts
- Landing Page Views to Submission Rate
- Landing Page Submissions
- Landing Page Views

HubSpot Social Media Tracking Dashboard
In order to get the most out of your social media campaign, you need to be able to track and measure its effectiveness and get actionable insights out of it. This HubSpot Social Media Tracking Dashboard Template will help you figure out which channels give the most return in terms of leads, traffic, engagement, and brand awareness.
HubSpot CRM Dashboard
If you’re serious about CRM, you need the HubSpot CRM Dashboard template that will tell you what your sales funnel looks like and show you the following metrics:
- Paid Signups Per Day
- Conversion Rate Through Funnel
- Top of Funnel Additions
- Top Closers this Month

It will provide information about deals and sales pipelines that will help you grow your business.
HubSpot (Sales Activity) Dashboard
You can use this HubSpot (Sales Activity) Dashboard Template to monitor each stage of your sales funnel. It tracks HubSpot CRM metrics like:
- Calls
- Calls Goal
- Calls by Owner
- Emails Logged
- Emails Logged by Owner
- Meetings
- Meetings by Owner
- Notes
- Notes by Owner

With this information, you’ll be able to identify and fix leaks, learn how to track email and call productivity of your sales reps, and how to improve the effectiveness of your sales team.
HubSpot CRM (BDR Sales Rep Habits) Dashboard
This HubSpot CRM Dashboard focuses on BDR sales rep habits and functions as a tool that will guide sales reps towards developing good habits like using HubSpot CRM. It monitors key metrics that will allow you to help your sales team stay productive, make accurate sales predictions, and generate in-depth sales reports.
These metrics include:
- Calls by Owner
- Emails Logged by Owner
- Meetings
- Tasks Completed by Owner

Sales Overview Dashboard
This Sales Overview Dashboard template will give you a visual snapshot of the sales team’s monthly performance. It will help you determine what’s successful and what areas you can improve.
Its key metrics are:
- Sales Performance KPIs
- Productivity KPIs
- Sales Leaderboard
- Progress vs Goal
They will allow you to better understand the current sales pipeline and compare team results to revenue goals.

Hubspot Sales Rep Performance Dashboard
Tracking sales rep performance is essential if you want your department to improve over time. Using a HubSpot Sales Rep Performance Dashboard allows you to track their performance and compare it with their personal goals.
It monitors a large number of metrics that will provide a holistic view of all activities and tasks carried out by each sales representative. That way, you’ll know if they’re hitting their targets and ensure the closed deals are worth the investment.

Automate HubSpot Reporting with Databox
HubSpot is an incredibly versatile tool that automates important tasks and allows you to increase traffic, generate leads, and turn them into customers.
However, it can be made even better with Databox.
While HubSpot is useful, it’s likely you’ll run into problems if you want to use other tools to track a variety of metrics (and you almost certainly do). It doesn’t provide sufficient data granularity and tracking data from multiple accounts can simply be time-consuming. Luckily, our custom dashboard software can help with that.
With Databox’s reporting software, you’ll be able to automate pretty much every stage of the HubSpot reporting process and transform your most important marketing KPIs into meaningful and actionable insights. Integrating Databox and HubSpot will make it possible to combine multiple data sources into one comprehensive report. Your team will be able to track all relevant metrics, learn by studying performance statistics, and bring your whole operation to a new level.
You can give Databox a try for free and see for yourself how much easier monitoring and reporting on your business will become.
FAQ
Databox is a business analytics and dashboard platform that helps you track, visualize, and report performance metrics from tools like HubSpot, Google Analytics, and many others all in one place. IT integrates directly with HubSpot and pulls in your marketing, sales, and service data. It helps you build custom dashboards, automate reporting, and dig deeper into your HubSpot data for better decision-making.
Databox connects to HubSpot and pulls in your CRM, marketing, and sales data to create visual dashboards. You can combine metrics from HubSpot and other tools (like Google Analytics or Facebook Ads) into one report.
Key metrics include sessions, new contacts, MQLs, email clicks, landing page conversions, and blog performance. These help measure campaign success and funnel performance.


