Uses one-click integrations:
-
 HubSpot CRM
If you don't use HubSpot CRM, you can pull data from any of our 130+ one-click, native integrations or from spreadsheets, databases and other APIs.
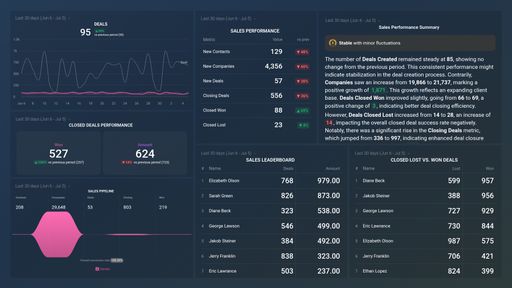
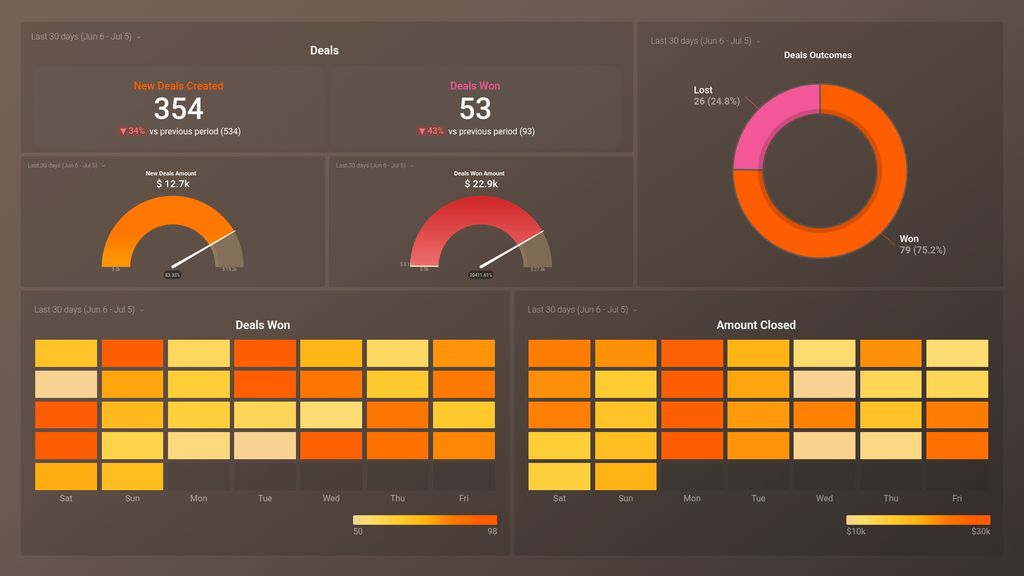
Try this dashboard for freeWhat you’ll learn from this HubSpot CRM Sales Manager Deals KPIs Dashboard Template:
By connecting your HubSpot account, you’ll be able to measure and report on the following:
- What’s our average deal size? Track your average deal size month-over-month and forecast whether your current volume will allow you to hit your sales goals. Compare previous periods and track your team’s ability to close bigger deals.
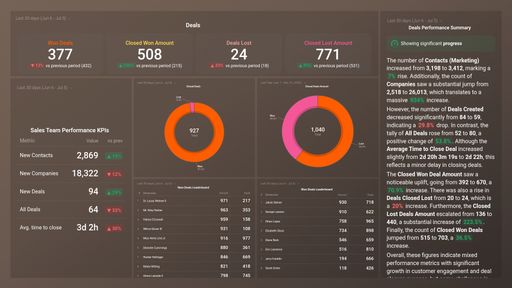
- How many open, closed, and lost deals did we see this month? Track the number of deals created by your sales team and their outcomes, including the number of deals closed, lost, and won so you can measure progress toward goals and prioritize support.
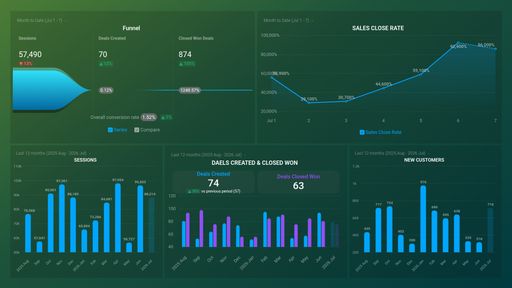
- How much revenue can we expect to close from new deals created? Measure the potential revenue your sales team can close from newly created deals in a given time period. This is useful for forecasting and sustaining a healthy sales pipeline.
- What’s our current progress toward our sales goals? Measure the number of closed won deals this month, or over previous time periods, and monitor whether you’re on track to hit your quarterly or even yearly sales goals.
Pull additional data using our deep integration with HubSpot CRM.
Pull additional data using our deep integration with HubSpot CRM.
What else can you track and visualize with our deep integration with HubSpot CRM? When it comes to managing your sales pipeline, almost anything:
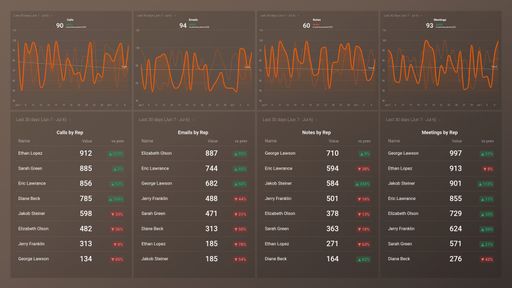
- Emails logged
- Calls and meetings
- Deals created
- Deals closed won and lost
- Activity by sales rep
- The conversion rate(s) throughout your marketing and sales funnel(s)
- Customer interactions and behavior
- Sales revenue, and more
There are many different metrics and metric combinations you can track using HubSpot CRM. And in Databox, you can quickly visualize 100s of HubSpot metrics in a variety of different ways alongside all the important metrics from other data sources you’re using.
Read More about Databox’s HubSpot CRM integration to learn more.
Explore more HubSpot CRM dashboards.