Table of contents
For many agencies, long-term clients are a true treasure.
This is even more true for digital agencies. As the digital landscape shifts and organizations have more data and digital marketing options to choose from, keeping long-term clients on board is key.
The following case study features one such B2B client of ours. At ClearPivot we have been working with this organization for nearly ten years.
In this case study, we will document how we first shifted our client into using HubSpot to track leads and sales and as a result were able to implement Databox this year for in-depth reporting and analysis purposes.
The Client
The client is a B2B consulting agency, which means, like many boutique consulting companies, they close big-ticket projects but they have no consistent sales data across the entire history of the organization.
In late 2016 after a few years of prodding, we convinced our client to begin tracking projects and sales through the HubSpot Sales platform. Previously, the client had little to no sales tracking (in fact, their sales follow-up process was just responding to unopened emails in their inbox).
Now, in 2018, we are able to see the full picture of the value of our continued digital marketing services for the client. After analyzing the numbers, our client is seeing many more sales through digital conversions. With some background established, here’s how we worked with the client on adopting the HubSpot Sales platform and how Databox allows us to visualize and analyze their data in real time.
The Project
The story of this project exists in two parts. Part one features the adoption of HubSpot Sales and part two features the implementation of Databox.
As previously stated, we began transitioning our client’s sales data into HubSpot Sales in the second half of 2016. Due to the lack of structure within the client’s sales process, we estimate that it took us roughly 6-7 months before we were able to fully track all digital conversions in HubSpot Sales.
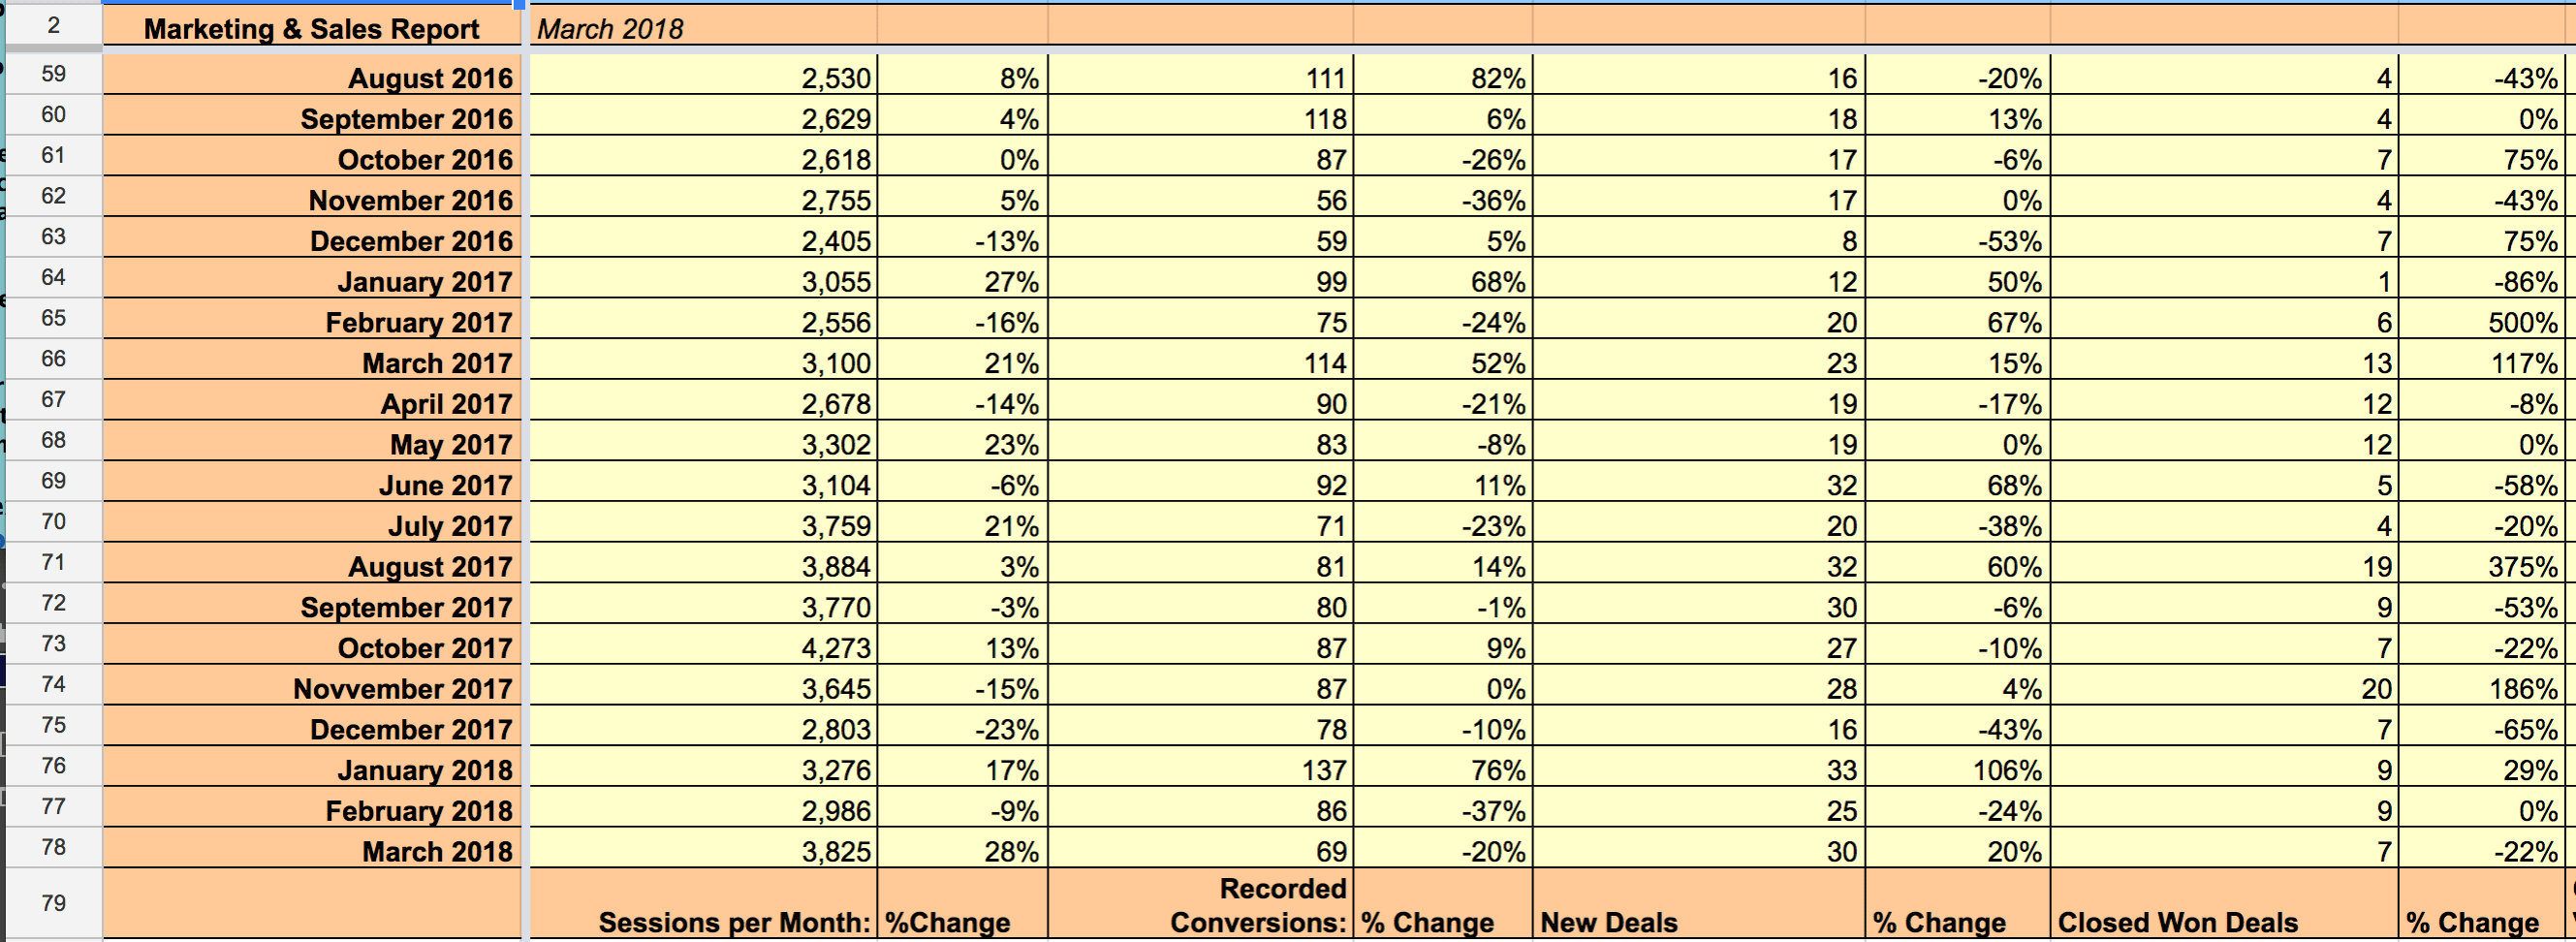
As the data was being added to HubSpot, we needed a way to adequately report the data to the client. For several months we were pulling HubSpot reports and using the HubSpot Sales Dashboard to visualize the data. However, this approach was very piecemeal and did not present a full picture of the data being gathered. This led us to consider Databox.
With a full set of sales data, it was becoming quite cumbersome to not only gather the sales data into the report but also to communicate our hard work to the client.

Example of the old sales + marketing report
In fact, just as our agency had begun setting up and planning the implementation of Databox reports, the client reached out to us and asked us to adjust the way we shared marketing and sales data. We were able to inform the client that we were in the process of rolling out simplified reporting via Databox.
The Results
Before we implemented Databox, our agency was spending between 1.5 to 2.5 hours each month putting together a sales and marketing report with additional written analysis.
With the implementation of Databox, the report now self-generates, complete with data visualizations. This reduces the work on our end and the time billed to our client. We implemented Databox at a time when our client was growing tired of the lengthiness of our previous reporting methods. For our agency and the client, Databox was a welcome solution to what had become an unnecessarily long and tedious process.
Databox has an unparalleled ability to generate reports which are not only aesthetically pleasing but also useful for review. We have been able to shift the time saved by the Databox report generation into further analysis and content planning.
We have set up our client’s report to include:
- Visits,
- Contacts
- Sales
- Top pages
- Paid search
- Email campaigns
- Social media
- Facebook Ads
- Reach
We love the ability to pull data from our email client, Google Analytics, Facebook Ads, and HubSpot and have it all in one place.
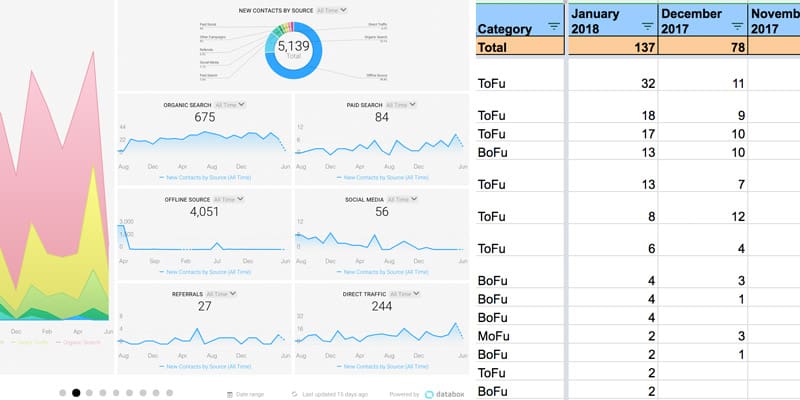
The visualization of the data has helped us realize the low ROI of Facebook Ads due to the low interaction rates. We had known for awhile that Facebook was not creating a serious bump in traffic, but the ability to track traffic vs. leads generated in a visual form showed us how little the Facebook Ads were producing. So, we chose to shift away from Facebook and place more emphasis on PPC.
Below is a side-by-side comparison of how we track sales and marketing data in Databox (left) compared to the manual spreadsheets (right) that we used previously:

The Databox Difference
Currently, the client fully supports both our marketing and sales processes. In many ways, the client outsources the entirety of both operations to our organization.
While we have a trusting relationship, the client found it hard to dedicate their time to reviewing our monthly marketing and sales reports and digesting our written monthly recaps. Databox provides the client with side-by-side visualizations of marketing and sales data which previously existed only in text and on separate tabs of a report.
Not only are we saving time on putting together monthly reports for the client, but the client can review and digest the monthly report more easily because the information is readily displayed both numerically and visually.
We could not be more pleased with our adoption of a marketing dashboard software like Databox. Its ability to integrate with so many different sales and marketing platforms allows us to put all of our reporting in one place without spending a massive amount of time gathering the data.


![How We Track Marketing and Sales KPIs With Databox + HubSpot [Case Study] How We Track Marketing and Sales KPIs With Databox + HubSpot [Case Study]](https://cdnwebsite.databox.com/wp-content/uploads/2018/07/16115323/SethFendleyBg.jpg)


