Table of contents
Do you ever feel like leads or sales are down, but you’re not sure why?
And, worse…you’re not really sure where to make the adjustments to get things trending back in the right direction?
While many of us track things like leads, subscribers, customers, etc., in isolation, having a comprehensive funnel that tracks all of these stages and how they influence one another is critical in really understanding how prospects engage and purchase from your company.
Some of you may already be using lifecycles in HubSpot, but you’re somehow just not getting the right results. The reason behind that is usually in the settings themselves––this post will help you, too.

Either way, whether you’re currently using lifecycle stages in HubSpot or not, we’ll help you get set up and simplify the creation of your reports
But first, let’s get into why tracking lifecycle stages in HubSpot is important in the first place.
Prefer video to text? Here’s a brief 5-minute walk-through for setting up your HubSpot Lifecycle tracking in Databox.
What Are HubSpot Lifecycle Stages (and Why Should You Use Them?)
Lifecycle is a term that describes the degree of a person’s engagement with your brand from their first touch all the way to an eventual purchase.
Every Lifecycle Stage in HubSpot has its own specific meaning that is integrated throughout the HubSpot product experience so that your marketing, sales, and customer support teams can provide more personalized service based on someone’s stage. You can also add your own custom criteria for each Lifecycle Stage––more on that later.
It’s important to note that before you dive into creating reports and dashboards that analyze your Lifecycle Stages,, you first should understand the meaning of every stage of the customer lifecycle.
Here are the various stages and what they mean according to HubSpot:
- Subscriber: contacts who know of your business and have opted in to hear more from your team. These are likely visitors that have signed up for your blog or newsletter.
- Lead: contacts who have shown sales readiness beyond being a subscriber. An example of a lead is a contact who signs up for a content offer from your business.
- Marketing Qualified Lead (MQL): contacts who have engaged with the team’s marketing efforts, but are still not ready to receive a sales call. An example of a MQL is a contact who respond to a specific form in a marketing campaign.
- Sales Qualified Lead (SQL): contacts who have indicated through their actions that they are ready for a direct sales follow up. An example of a SQL is a contact who submits a question about your product through a contact form.
- Opportunity: contacts who are real sales opportunities.
- Customer: contacts with closed deals.
- Evangelist: customers who advocate for your business and whose networks may be leveraged for further leads.
- Other: HubSpot defines this stage as a wildcard, which is used when a contact does not fit any of the above stages.
In HubSpot, these stages are added to properties by default to your contact and company items and will help you track the journey of your customer through all of your marketing and sales campaigns to a potential purchase, and later on, even the promotion of your product.
Contrast this with simply tracking “leads” and “sales” and you can see how this level of granularity gives you much more insight into where people are in your customer journey, how long they’ve been there, and perhaps most importantly, the campaigns that influence movement through the lifecycle stages.
Why Is It Important To Track & Visualize Your Lifecycle Stages?
When you track only the number of contacts in each lifecycle, you’ll get an overview of the volume of people currently in each lifecycle stage. But is that really enough?
In short, no.
It’s also important to know when the transfers between stages happen and the events (emails, content, phone calls, etc.) that influence them. Only then can you make smarter bets about the tactics, projects, and campaigns that can result in the improvements you need.
Also, by tracking the conversion rate between lifecycle stages, you also get a broader picture of where people are getting “stuck” in your sales funnel as well as what’s working and what’s not with your campaigns.
For example, maybe there’s a massive bottleneck between the MQL and SQL stages of your HubSpot Lifecycle, and, after further investigation you find that your email nurturing drops off significantly around that time. Well, now you can make the bet that by improving your email nurturing strategy you can effectively move more people from MQL to SQL.
To get a better handle on that, you’ll need to know which email campaigns, blog posts, premium content, etc., is most effective at influencing each lifecycle stage.
You can download this free HubSpot Marketing Journey dashboard that will get you most of the way there in terms of seeing which campaigns perform best.
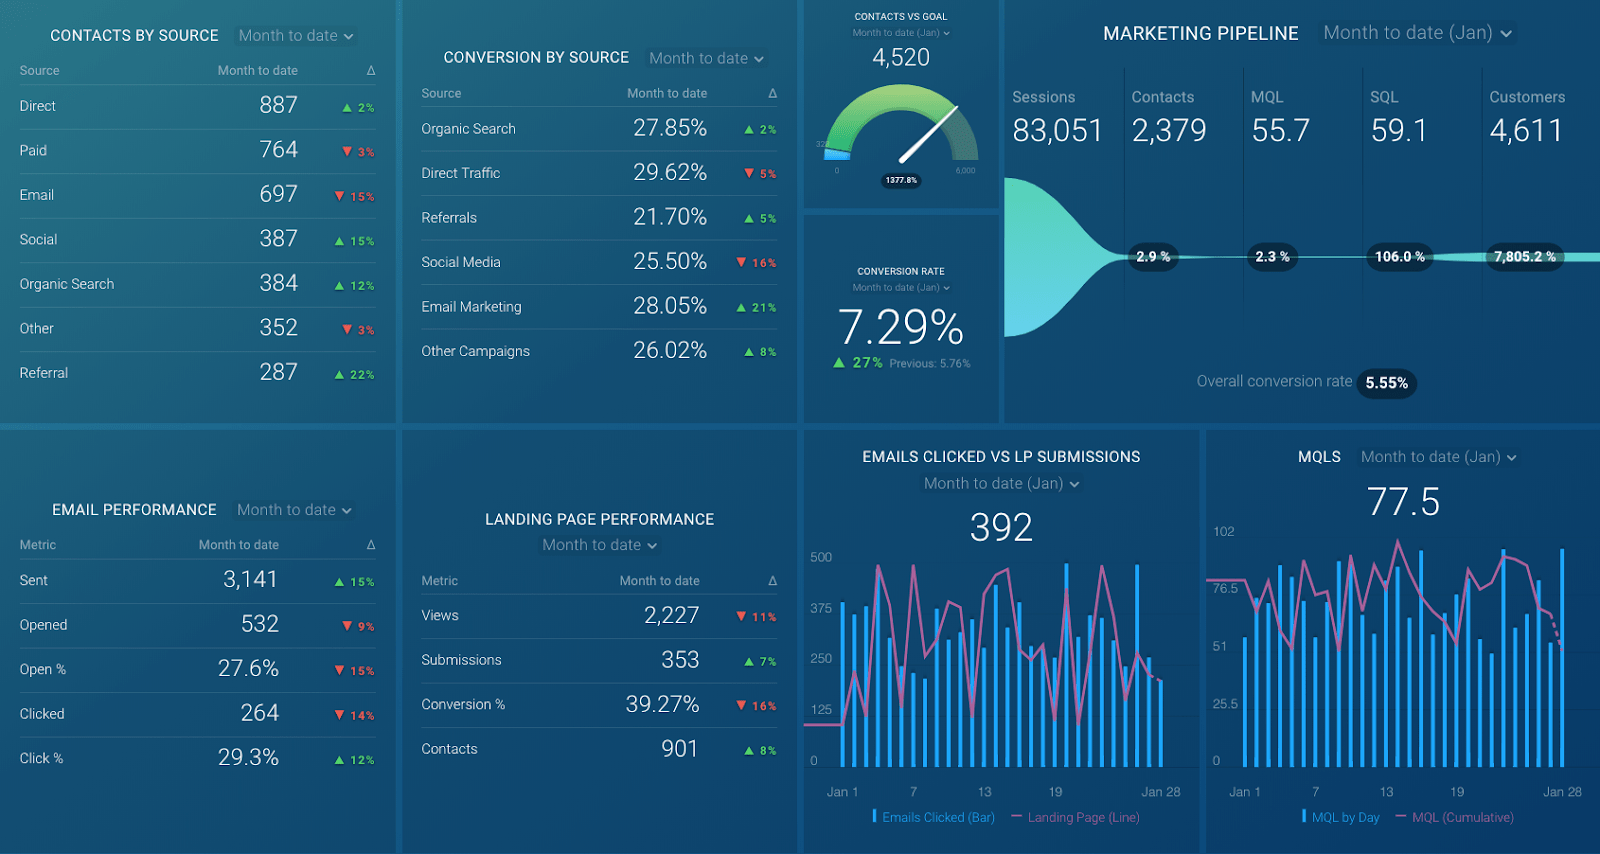
By viewing and comparing the number of emails sent, the sources of your contacts, number of conversions, etc., in one place, you’re able to act accordingly as soon as you see any significant change in your data.
How Do I Track HubSpot Lifecycle Stages in HubSpot?
The confusing part for most of our users comes when they have to differ between the ‘New’ and ‘Became a’ option in HubSpot.
With ‘New’, the name itself already explains what it means. You’re looking at a completely new person that joined your lifecycle. So the Contact itself was created during the specified Date Range and was added to the specific lifecycle stage during that Date Range.
It will also always show as a New Contact when that Date Range is selected.
These metrics are already Basic HubSpot Marketing Metrics in Databox and are all titled “New [Lifecycle Stage]” they are all accessible in the Metric Library.
A contact starts measuring as a ‘Became a’ as soon as he or she moves from one stage to another.
‘Became a’ tracks the movement of contacts through lifecycle stages, while ‘New’ tracks the current (or final, if it’s a past Date Range) state of contact.
Because ‘Became a’ counts all the stages that the contact touched in the selected Date Range, it’s values are expected to have larger Metrics values as the ‘New’ contacts can only be counted once per Date Range.
For example, let’s say that Charlie was already an MQL for quite a few months but has just recently Became an SQL today. Charlie will be shown in that stage for every Date Range that includes today’s date.
The ‘Became a’ metrics are already available in Databox under Custom metrics so they are ready for you to use.
And, because they are built with Query Builder you can even adapt them to your own liking. They are usually titled as “Became a [Lifecycle Stage]”, but you can change that to any other name if you’d like.
When (and How) Do You Use ‘New’ and ‘Became a’ Contacts?
One important thing to note before creating your Databoards is considering which Metrics should be used––are you planning to show the ‘New’ or the ‘Became a’ ones and also which data is of importance for you to be measured.
By using the pipeline visualization with the “New” metrics, you’ll get visibility into the current state of the pipeline and it’ll even highlight the changes in it.
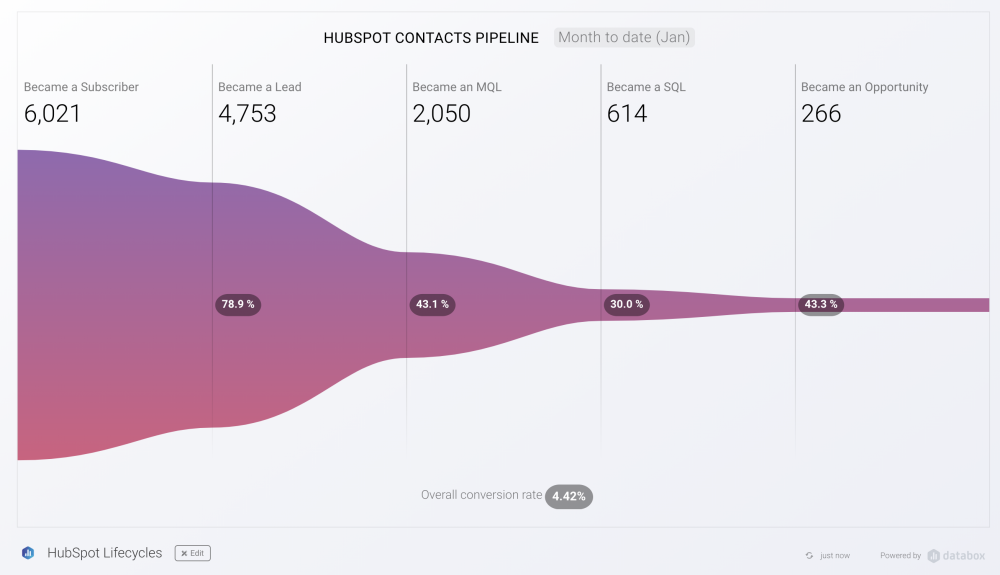
If you’re interested in seeing the conversion between two stages, you can use the Pipeline or the funnel visualization with ‘Became a’ metrics.
For an easier start, we already have some templates set up that you can use:
Do you want to report on contacts that meet other criteria? Use Smart Lists
If you’ve created your own Custom Contact Properties, you can track them in Databox with the help of Smart Lists.
Smart lists are used to segment your contacts by specific properties.
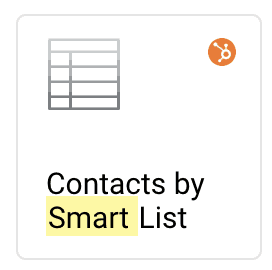
You can pull in the data from Smart Lists using the Basic Metric “Contact by Smart List”, which will show you the total number of Contacts in any specific Smart List during the selected Date Range.
But, if you’d like to see the number of New Contacts who entered your List during the selected Date Range, you can do so with the use of Query Builder for HubSpot Marketing – Smart Lists.
There has to be a special Smart List created for every Custom property that you’d like to report on.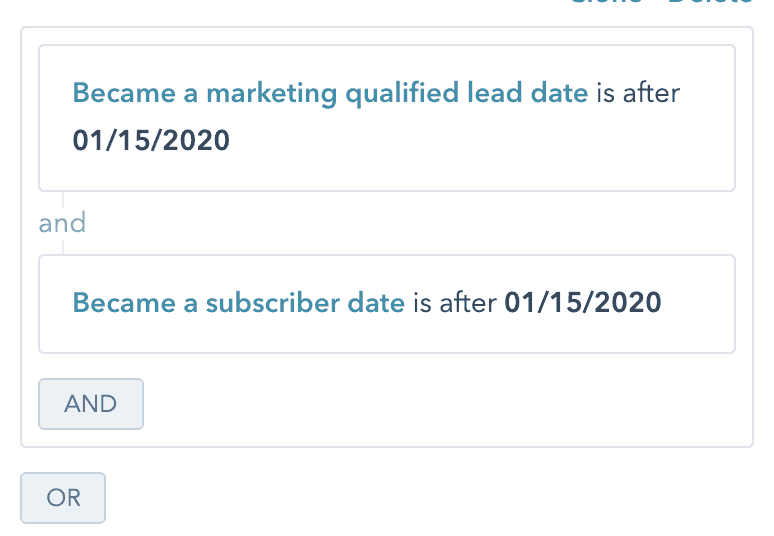
Once that’s set, you can pull that data into Databox with the use of Query Builder. Just a couple of clicks and you’re ready to see the data on a Databoard.
Keep in mind that Smart Lists are defined and tracked by a unique ID rather than by the Smart List name.
One of most common visualizations in this case is usually a Funnel or a Pipeline, as you can then add every custom property that you have set up in HubSpot with Smart Lists, to the visualization itself.
Get Started Tracking Your Lifecycle Stages in Databox
So, there you have it. If you have any questions or if you need help setting up and tracking/visualizing your lifecycle stages in Databox, you can visit our Knowledge Base or send us a message at help@databox.com and let us know how you’d like to track your lifecycles.
For current Databox users, login to your Databox account to start creating your lifecycle funnels and pipelines.
New to Databox? Start by creating your free account. From there you’ll be able to connect your data, not only from HubSpot, but from other platforms, too.
Then you can add the metrics to your metrics screen, create Databoards, automate your reporting, collaborate with your teammates and much, more.