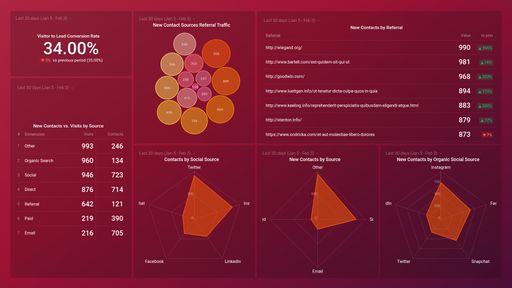
HubSpot (Landing Pages Performance)

Template created by MPULL MPULL
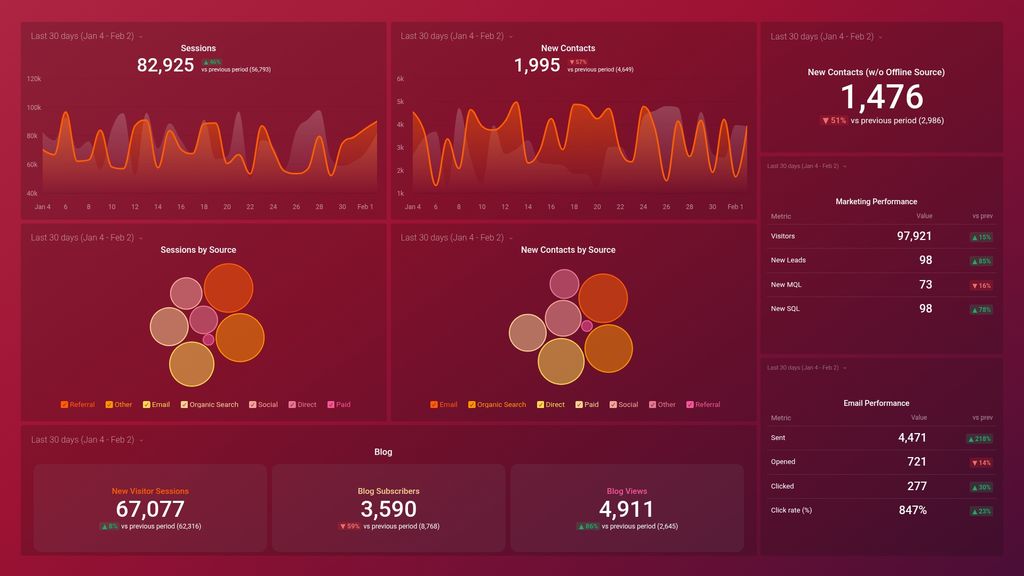
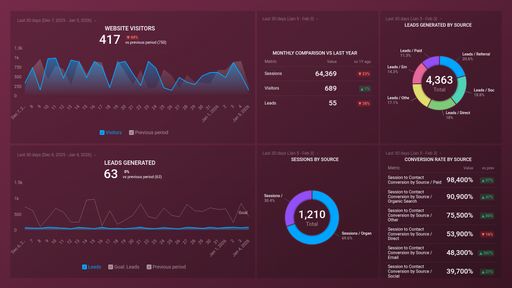
Hubspot Landing Page Performance dashboard template shows activity across your landing pages, and their activity over the last 30 days, previous month and past year.

Uses one-click integrations:

  • HubSpot Marketing HubSpot Marketing

If you don’t use HubSpot Marketing, you can pull data from any of our 100+ one-click, native integrations or from spreadsheets, databases and other APIs.

Get this dashboard for free

What you’ll learn from this HubSpot (Landing Page Performance) Dashboard template

Measure the performance of your landing pages over the last 30 days, the previous month, and the past year. Connect your HubSpot Marketing account and learn:

  • How do I measure the success of my landing page? Instantly track and compare your landing pages’ performance over the last 30 days, the previous month, or within the specified time period. Keep an eye on your most important landing page metrics such as views, submissions, conversion rate, and contacts.
  • How many people viewed my landing page in the last 30 days? See how many people viewed your landing page for the first time after clicking on your ad, email link, or blog posts in the last 30 days (including multiple visits from the same people). Tracking your landing page views is useful as it lets you know if you’re receiving sufficient website traffic from your referring channels or not.
  • How do I track my landing page submissions from emails? See how many prospects clicked on a link in your sent email and landed on your designated landing page. Additionally, find out how many of these leads completed your landing page form or took on an offer. If you have a low click-to-submission rate despite lots of people clicking on your link, it is an indication that there is a problem with your landing page. Maybe the offer doesn’t match the CTA? Are the questions too long or personal?
  • What is my landing page conversion rate? View the percentage of people that viewed your landing page and ended up converting into a lead. Track this data daily to spot and uncover trends or patterns. Do you have more people landing on your page and not completing your form? Did you get a significantly high percentage of people viewing your landing page and filling your form on a particular day?.
  • How many people completed a call-to-action after viewing my blog? See how visitors turn into leads based on blog viewing history. That is, find out how many form submissions you receive daily in comparison to the number of people that view your blog posts. If lots of people are viewing your blog but not clicking on your CTA button to be led to your landing page form, it indicates that your CTA needs to be optimized for better results.
  • How much on average does conversion on my ad cost? See how much you get charged for each desired action taken by a user after coming across your ad. Compare your cost per conversion value against your target amount to determine the return on your ad investment. Are you paying more or less?

Pull additional data using our deep integration with HubSpot Marketing

What else can you track and visualize with our deep integration with HubSpot Marketing? When it comes to traffic and conversions, almost anything:

  • Website traffic and conversions
  • Traffic and lead demographics
  • Landing page performance
  • The conversion rate(s) throughout your marketing and sales funnel(s)
  • Track and compare the efficiency of your marketing campaigns
  • Monitor campaign improvements and growth over time

There are many, many different metrics and metric combinations you can track using HubSpot Marketing. With Databox, you can quickly visualize 100s of HubSpot metrics in various ways, alongside all the important metrics from other data sources you’re using.

Read more about Databox’s HubSpot Marketing integration.

HubSpot Marketing HubSpot Marketing metrics included in this template
Customize dashboard
Explore all of Databox’s functionalities:

Customize this dashboard with Databox

Sometimes, you’ll want to dive deeper into performance. When you need to customize this template (or any other dashboard) to include different metrics, add metrics from different sources, etc., you can do so by using Databox’s Dashboard Designer.

The Designer allows you to easily drag-and-drop metrics and visualizations from any data source right into your dashboard.

Get Started