Table of contents
Google Analytics is used by over 56% of websites all over the world.
If you’re using the same free software to monitor your website, you might be wondering whether you’re making the most out of it.
That’s why we wanted to find out how marketers use Google Analytics. But not just the boring, standard “monitor your page views” advice–we wanted the advanced tips.

The custom stuff. The hacks. The tricks. In other words, the fun stuff.
We polled a few dozen marketers to hear about the advanced hacks they use to collect meaningful data.
Here’s what they said.
The unusual metrics you should be tracking
Page views, bounce rate, traffic sources… You know the drill.
Read any marketing blog and they’ll tell you how important is is to track those metrics. But our experts recommend adding the following, under-used metrics to your list:
Exit Rate
You might know how many people are sticking around once they land on your website. But according to RJ Jacques of Big Sea, you’ll need to analyze your exit rate–“the percentage of visitors who make a particular page the last point in their visit to your site.”
Jacques explains that “you can find exit rate by page in Behavior > Site Content > Exit Pages and look to the far right for the exit rate of any particular page.”
“Sorting the content on your site by Exit Rate gives content marketers an idea how sticky their content is, and identifies points in a funnel where people are leaking out.”
“Usually, pages with high exit rates have problems with message mismatch, are irrelevant to a visitor, or have technical issues. By reducing the exit rate on a particular page, you can improve the user experience for visitors, and see more of your prospects reach the bottom of your funnel,” Jacques concludes.
Session Quality
Jeff Moriarty of J Morality Marketing uses the Session Quality metric to view “the quality of sessions for the website (1-100), which I can then break down into segments for each.”
Moriarty explains: “I normally take a look at low-quality sessions (less than 10) and very high-quality sessions (greater than 90) to see where improvements or observations can be made.”
“It’s a great report that most don’t utilize,” Moriarty summarizes.
Now you’re up to speed on the metrics you should be tracking, here are our experts’ favorite Google Analytics hacks.
1. Filter your office IP address
Google Analytics collects data from your audience’s IP address to determine things like:
- Who’s visiting your website
- Where they arrive from
- What actions they’re taking
Jim Stablein of Mediafluent recommends to “to filter your own office IP address. If you don’t, it can kill your conversion rate, or at the least, you’re not getting a true metric.”
Tom Feltham’s team at Software Path agree, and “always include internal IP filters including any remote workers who may be accessing your managed sites. Despite these IP filters being essential for data cleanliness, we have seen so many sites where conversion or engagement data is skewed by internal users due to a lack of IP filters.”
…As does Aneesh Babu–only the team at Backlinkminds filter “out internal traffic […] to measure the accurate data in Google Analytics which excludes our internal or company visits to the webpage.”
2. Analyze behavior flow
Nili Zaharony’s team at Penguin Strategies “analyze the Behavior Flow to understand the real journey users take on the site.”
Within Google Analytics Reporting, behavior flow reports visualize the journey your audience take when they land on your site. You might see that of the people landing on your home page, 80% continue to a product page, and then 50% continue to a blog post.
“This informs website UX decisions as well as drives our decisions in various stages of the buyer journey – be it content, tactics or even ad spend,” writes Zaharony.
PRO TIP: How to track these 10 popular Google Analytics 4 metrics
Sure, there are dozens (and dozens?) more Google Analytics 4 metrics you could track. But, starting with these 10 commonly tracked metrics will give you a pretty high-level view of how your marketing is working…
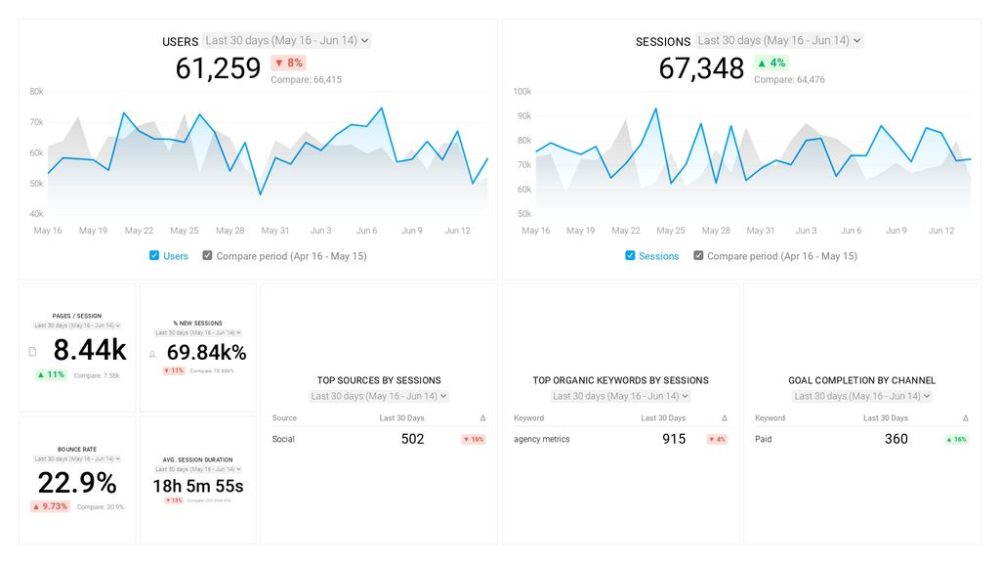
- Sessions: The number of sessions can tell you how many times people are returning to your website. Obviously, the higher the better.
- Sessions by organic keyword: Which organic keywords bring in the most traffic to your website? This may help you determine whether your SEO investments are paying off.
- Bounce rate: Do visitors leave shortly after landing on your website? Or do they stick around?
- Average session duration: How much time are people spending on your website? Users with a high average session duration are most likely relevant to your company.
- Goal completions: How many users responded to your call to action?
If you want to track these in Google Analytics, you might find the visualizations limiting. It’s also a bit time-consuming to combine all the metrics you need in one view.
To better understand how your website performs in terms of traffic growth and conversions, we’ve made this plug-and-play dashboard that contains all the essential metrics for understanding how successful you are at optimizing different aspects of your website.
You can easily set it up in just a few clicks – no coding required.
To set up the dashboard, follow these 3 simple steps:
Step 1: Get the template
Step 2: Connect your Google Analytics account with Databox.
Step 3: Watch your dashboard populate in seconds.
3. Use UTM codes
Joe Sloan of Challenger School says: “My favorite tip is to implement UTM codes through external link sources you control, this could be YouTube or Facebook.”
UTM codes are strings of code added to your URL, and track where your site visitors are coming from. Head over to Google’s Campaign URL Builder to see them in action:
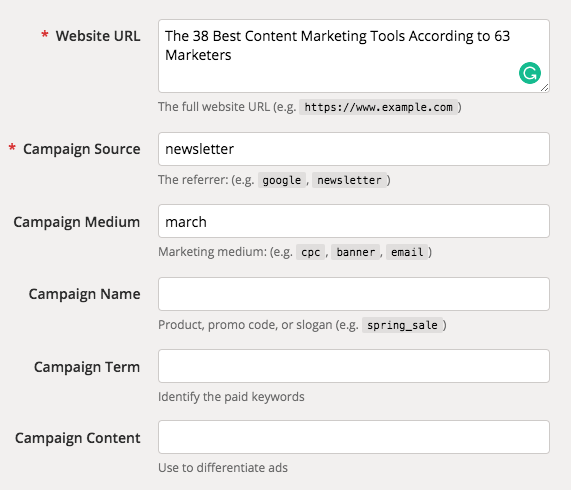
“You want to come up with clear UTM structure parameters, but once you do you can start to qualify and track traffic to see what videos are resonating with your audience or what posts drive traffic to your site.”
Sloan keeps track of these by keeping “an archive of all our past UTM codes and a formula for correctly generating UTM codes in a spreadsheet.”
Once you’re using UTM codes to track where site visitors have arrived from, adMixt‘s founder, Zach Greenberger advises to “tag each paid ad with a unique utm_content value, and then pull that granular data using the Google Analytics API.”
AdMixt’s team then “merge the data with native data from Facebook, Pinterest, and Snapchat to compare the last-click numbers from GA to the post-click numbers from each platform.”
4. Create custom dashboards
Jackie Tihanyi of Fisher Unitech thinks “one Google Analytics tip that can help you look deeper into performance is creating custom dashboards.”
Custom dashboards do what they say on the tin: Allow you to customize the metrics you see in your reports.
Tihanyi continues: “All you have to do is click into the customization tab-dashboards-create. From there, you can import a dashboard or create your own. This can be helpful if your looking to organize data and helps paint a clear picture of how your website is performing.”
“Analytics can get pretty overwhelming, but having a dashboard keeps it simple,” Tihanyi explains.
Srish Agrawal of A1 Future Technologies recommends this strategy, too: “What most accounts don’t do is realize they can customize their dashboard around to their liking. This will allow for a much quicker glance at your site stats, without needing to look at the usual content and data that is often preloaded or not as important.”
5. Make use of segments
Sam Underwood’s team at Futurety “make extensive use of segments to track different types of users, and to understand what our best users are doing that we ideally want all our users to do.”
Underwood continues: “For example, we might create a segment of only users who converted, and/or stayed on our site for 3+ pages, and then compare that group to all of our users. From there, we can look at what landing pages these engaged users started on, what channels they came from, what geography they were located in, what devices they tend to use, and so on.”
“With all that in mind, we can identify what parts of our site may be a hangup for the non-engaged users, or we can optimize campaigns and strategies to go find more users who closely resemble those who have previously converted,” Underwood explains.
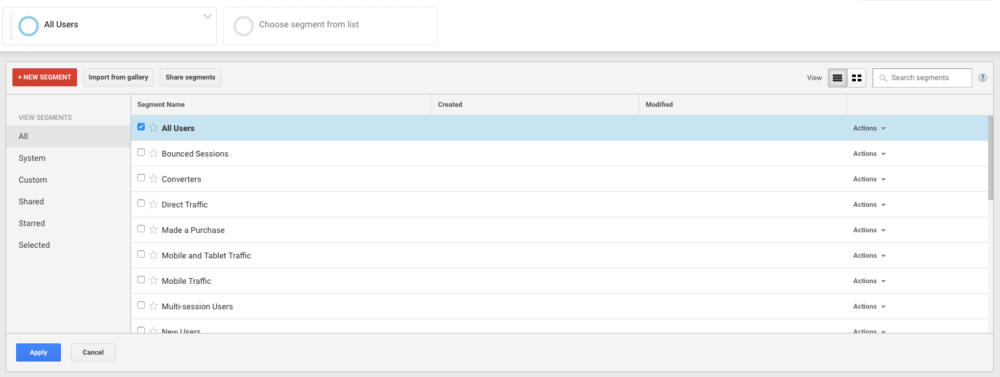
While Google Analytics offers a range of default segments, Rajat Chauhan Techtic Solutions Inc explains that “the real power comes in the form of custom audiences.”
Holly Ozanne of Venta Marketing agrees: “The best Google Analytics tip that I have learned when it comes to paid marketing is to use the audience definitions to their fullest potential and create your own custom audiences instead of using the preset audiences.”
Ozanne continues: “You can create audiences based on how they have interacted with your website. For example, you can group individuals based on if they spent a specific amount of time on your website, visited a specific page, or what page they left on.”
“These custom audiences have allowed us to make ads tailored to our visitors and what their needs are which provides a much higher conversion rate,” Ozanne concludes.
When analyzing segments, Darren Craig of Fully Charged Media advises to “look for the patterns. You could base your remarketing audiences on this, and the time lags between bookings”–data which you could use to optimize your campaign.
6. Track your goals
What do you want to achieve with your marketing strategy?
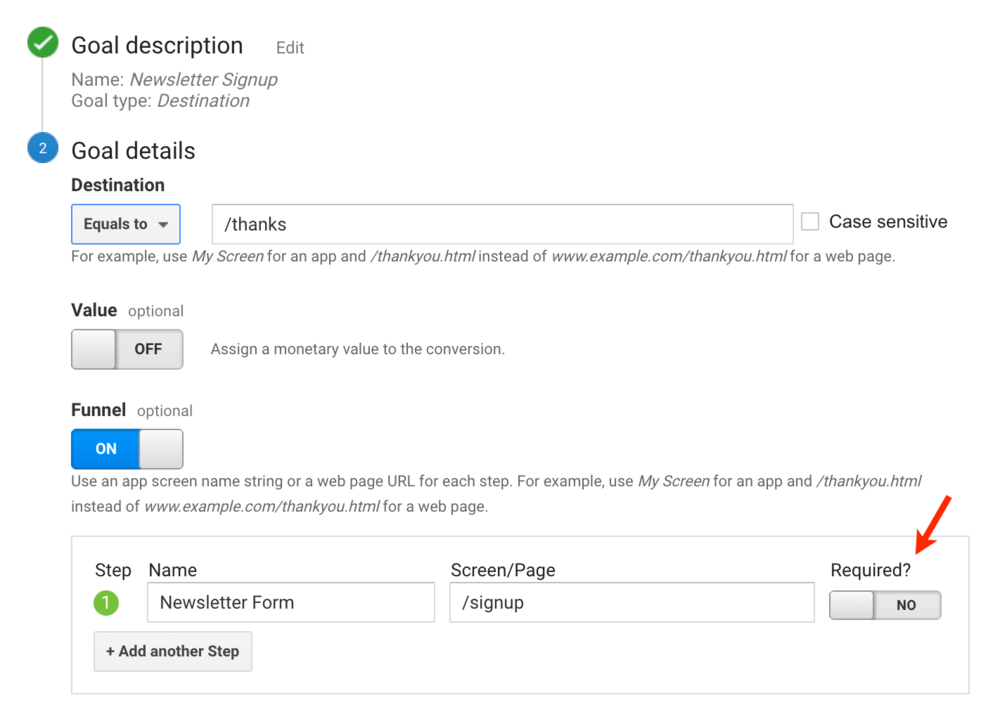
Regardless of whether that’s a conversion or a pageview, Jonathan Aufray of Growth Hackers advises using goal tracking: “Just name your goal, add your goal’s URL, implement your funnel, etc.”
However, Aufray thinks “most of the time, there are different ways visitors can signup (landing pages, lead magnets, popup forms, etc.)”–and that you’ll need several goals to accurately track leads.
Here’s the process Aufray recommends:
- “Get to the Google Analytics’ goal dashboard
- Name your goal
- Select goal type as “URL destination”
Then, “to see a breakdown of the goal and to check that it is recording the correct pages, use the Goal Verification Report or Goal URLs.”
MashMetrics‘ team also uses the goal feature to report on performance. However, Thomas Bosilevac thinks that “while many may already have their purchase or newsletter submit goal setup, we recommend also measuring top and middle funnel activities too.”
Bosilevac continues: “There are several ways to set up goals, but one of the most flexible is using your events. Tracking activity such as scroll depth, time on page, video performance or contact clicks gives you a much better idea of your users activity.”
Bosilevac shares an example of how they set up these goals to measure user interactions on their clients’ websites:
- “Contact Link Clicks – Clicks on email address or phone number
- Form Submits – A form was submitted (could be a comment form, email form, or any form=submit function on the page)
- Affiliate Clicks – Users clicks on an affiliate link (set to Amazon as default)
- Social Media Clicks – Users clicks on Social Media links (Yummly, StumbleUpon, Flipboard, Pinterest, Instagram, Facebook, Youtube, Twitter, and LinkedIn by default)
- Downloaded Files – User clicks on a PDF, XLS, and many other file types”
Wondering which goals you should start tracking? Lola.com‘s Matt Desilet thinks “you’ve got to set up conversion goals that make sense for your business.”
Cardinal Digital Marketing‘s Alex Membrillo agrees, and thinks you should start by “determining your website objectives. Then, determine measurable conversions to setup as “goals”. This can be especially important if your conversion process is multiple steps. For example, if you have an ecommerce site, completing the purchase may serve as one conversion goal. Then, creating a user account or subscription may serve as an additional conversion goal.”
That usually comes in the form of return on investment (ROI.) After all, it’s important that your marketing strategy is generating more income than you’re spending on it.
Ryan Dixon of SLEEEP explains how you can use Google Analytics goals to measure the ROI of your content marketing:
- “Setting up a destination goal(s) for your primary and secondary objectives, eg. the order confirmation/success page.
- Head over to Behaviour > Site content > Landing pages
- Filter by ‘/blog/’ (‘blog.’ depending on how your site is structured)
- Filter by your new goal, and voila. You have yourself the very minimum ROI of your content marketing efforts.”
Dixon continues: “The very minimum as the likelihood of someone converting in one session is probably a little thin. To measure this more in-depth you would need to dive into the attribution modelling over, say, a 90-day period. Then you could see the number of touch points a customer would need to convert and the length of time it takes a customer to convert.”
7. Use annotations
Andrew McLoughlin’s team at Colibri Digital Marketing think the most effective Google Analytics hack “is sitting in plain sight”–in the form of annotations.
McLoughlin explains: “For every change, update, development, content drop, or anything else, you can tag that event with an annotation. That way, when you see a change in your data, you don’t have to rack your brain or search your records to figure out which of your actions might have caused it.”
Summarizing, McLoughlin thinks “annotations give practical context to your data and are incredibly easy to implement.”
8. Set up internal promotion tracking
Do you run advertisements on your site?
Whether it’s a banner to your services page or a link to a landing page, Steve Kozma of Be Found Online recommends to set up internal promotion tracking: “While it falls under the Enhanced Ecommerce reporting section, it’s not an Ecommerce only report.”
Kozma continues: “For some of our clients, we use it instead of event tracking as we can see impressions, CTR, and which goals were completed based on those interactions. Don’t let the name fool you, you can use it just like you would any normal event.”
9. Use the weighted average sort feature
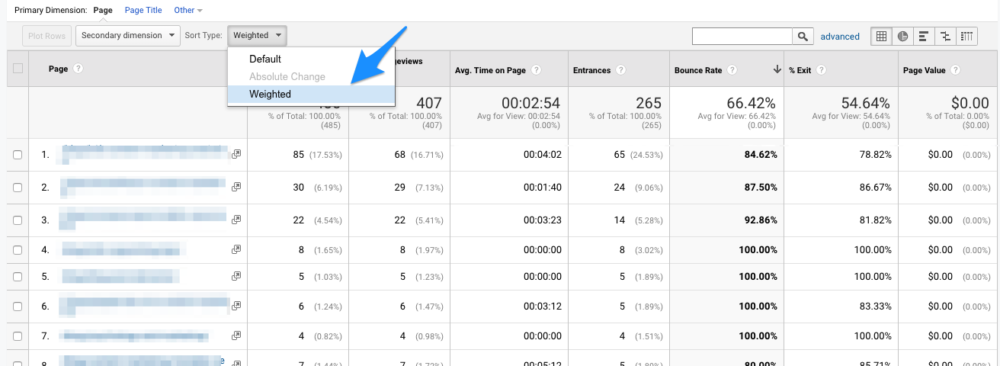
“Weighted sort is the tip/hack I use the most,” says SyncShow‘s Jasz Joseph. “Google Analytics has a weighted average sort which will weight the average by the number of sessions.”
Joseph puts this into practice: “Have you ever tried to sort your data to see which pages have the highest bounce rate? You may notice that the pages with a 100% bounce rate only have 1-2 pageviews. While this data is accurate, it is not very meaningful. You want to spend your time optimizing the pages that have significant page views and still have a very high bounce rate.”
According to Joseph, the weighted sort feature can do this for you:
10. View audience insights to optimize by device
Samantha of Roger West recommends checking “the type of device your consumer is using when accessing your website” because “you want to make sure your site is fully optimized for each type of device your consumer is using.”
Head over to your Google Analytics dashboard, then click Audience > Mobile > Devices to find this report.
“For example, if you find that the majority of the people are accessing your site from a mobile device then you should make sure they can see all the features on that page from their phone, or perhaps develop an app.”
Samantha continues: “By making sure your website is optimized for each type of device your consumer is using you will earn more leads and your bounce rate will decrease.”
11. Set up email alerts
“I think the best way to get a more detailed idea of your performance is to do a little and do it often,” writes Cardswitcher‘s Stephen Hart.
“Setting up Google Analytics email alerts will help you to do just that. Email alerts from Google Analytics can help you to gain a broad, general overview of your performance.”
Hart continues: “Having a general Analytics alert sent directly to your inbox regularly will help you keep track of the performance of your campaign, allowing you to save time and devote your attention to [the] subject in extra detail.”
12. Take advantage of Google Analytics Intelligence
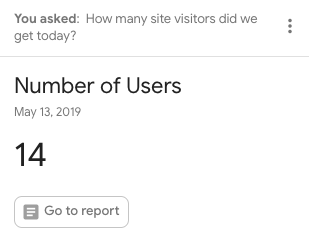
The search bar in your Google Analytics dashboard is called Intelligence. Simply type a question in there–like “how many visitors did we get today?”–and Google’s machine learning system will retrieve the data.
Morgan Lathaen of thumbprint thinks it’s a great way to “surface insights on major changes and opportunities to be aware of” because “if Google Analytics detects something out of the ordinary, it will register in the Google Analytics Intelligence Reports.”
“For example, if traffic suddenly drops, this will register, and you can even have alerts emailed to you,” Lathaen continues. “It’s super helpful to measure performance and which posts your audience is most engaged with.”
Max Reinhardt of Beacons Point also recommends keeping an eye on these notifications. However, “you should create your own stipulations for notifications when traffic is unusually high or low. This will quickly allow you to investigate why your site may have significantly lower than normal (robot .txt file mishap, for example) traffic, or higher than expected (a high-quality backlink was published).”
Reinhardt thinks it’s even more important to use intelligence events “if you’re in charge of driving traffic” because “you should be the first to know when something terrible, or great, is happening on your site!”
13. Compare attribution models
“One tip that I would recommend within Google Analytics is the attribution model comparison tool,” writes Madelyn Engel of Anvil Media, who uses the feature “when analyzing a client’s conversion funnel and the effectiveness of different channels.”
You can find this tool by heading to Conversions > Attribution > Model Comparison Tool.
Engel explains that “the standard attribution for Analytics is last-click. However, this comparison tool will show you which channels are effective as first touch points, although they may not be receiving the conversion credit under the standard last-click model.”
“My personal favorite is the position-based model, where 40% of the conversion credit is assigned to each the first and last interaction, and the remaining 20% credit is distributed evenly to the middle interactions.”
(This is also known as multi-touch attribution; something our previous survey found almost 50% of marketers prefer.)
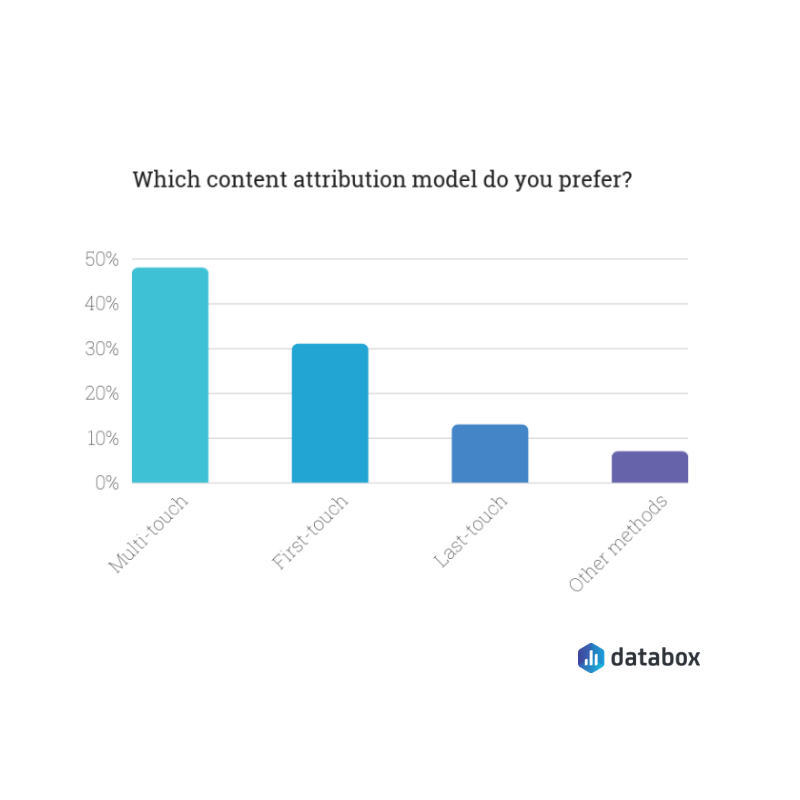
Engel says: “This model will give you a better sense of the customer journey and how different channels are supporting that customer.”
Bonus: 4 Google Analytics extensions
Google Analytics is great, but it’s not perfect. You always can’t find the data you’re looking for.
These four experts set their sights out to track certain data–and landed on these Google Analytics extensions which makes it possible to view more data in your dashboard:
Page Analytics
“Google Analytics provides a number of tools to help analyze how users flow between pages on a website and what the most engaging content is, but it’s crucial to understand how users interact with every single page,” writes Tom Dolfi of Pathfinder.
Dolfi uses in-page analytics for this–something their team name as “a little hidden gem that makes the difference.”
“The report was removed from the Analytics console in 2017 but it’s still available as a Chrome extension – once installed and connected to Google Analytics, it shows the percentage of clicks for each link on [the] page. It also shows high-level data for the viewed page, like bounce rate, time on page, exit rate and so on that can be filtered applying segments, views, and a date range.”
The best part about this extension? “Unlike other reports, In-Page Analytics allows to analyze data within its visual context which leads to more interesting insights on user behaviour that can be used to restructure sales funnels and content pages,” Dolfi explains.
Keyword Hero
If you’re using Google Analytics for SEO reporting, you might grow frustrated with the inability to see which keywords people have searched to land on your website.
Alpha Investors‘ Andrej Ilisin has a smart workaround in the form of the Keyword Hero extension: “You can simply use the add-on, connect and sync your search console account and enjoy the full keyword report in your Google Analytics.”
Matthew Woodley of Woodley Digital Marketing, on the other hand, connects “Google Search Console with Google Analytics to unlock search phrases / keywords that are driving traffic to my website.”
Woodley says: “By syncing Google Analytics with Google Search Console helps you get around the “keyword not provided” message and provides much more insight into your search queries”, such as “average position and click-through-rates (CTR).”
Keywords Everywhere
…What if you want to view the search volumes for the keywords driving traffic to your site? Jay Kang of Referral Rock uses a Google Sheet to “import both Google Analytics and Google Search Console.”
Kang’s team then “match the URLs with the Bounce Rate, Page Views, CTR, Average Position, Impression so I can horizontally look at each article performance so I can determine what is providing strength and weakness.”
The Keywords Everywhere extension comes in handy here. Kang uses the extension “to attach the keyword with the volume, difficulty to better paint the picture of which direction to go.”
Scroll Depth
“Since the most important factor of SEO is good content that keeps visitors engaged and reading, it’s vital to understand how much of your content your visitors are actually getting through,” explains Crunchy Buzz‘s Linda Miriam.
It’s not possible to view this data in the Google Analytics dashboard unless you use the Scroll Depth plugin–something Miriam explains “allows you to see exactly how much of your blog articles or website pages your visitors are scrolling through.”
“This helps you understand what content works and ways to tweak future content. It also helps you consider where exactly to place links and ads throughout your content,” Miriam summarizes.
Final thoughts
As you can see, Google Analytics does more than meets the eye.
Whether you’re just getting started or a seasoned marketer using the data to inform your strategy, I’ll bet these Google Analytics hacks give you more insight on what’s happening on your website.
All ready to start tracking your metrics? With our business metric tracking software, you can track all your metrics from just one screen.