


Table of contents
If you are managing paid ads for clients, you know how overwhelming and time-consuming it can be to track and monitor PPC campaign performance. Most of the time, you are working from more than one platform trying to identify what success looks like amongst thousands of metrics.
But, 5 hours later, you will come to realize that this is not a very efficient way to report on PPC campaigns. There are just too many moving parts, too many platforms, and too much data!
So, how can you efficiently report your results to your clients? … I’ll tell you…
By creating a PPC reporting dashboard to automatically pull data from all these platforms into a single view. Automating this process means marketing teams have more freedom in their ability to grow profit and identify new opportunities to improve performance.
This article will explore how marketing agencies can use a PPC dashboard tool to adopt, adapt, automate and scale their PPC reporting process. This will include:
- What Is a PPC Reporting Dashboard?
- Why Use a PPC Reporting Dashboard?
- Top Metrics to Include Your PPC Report Dashboard
- Benefits of Using a Business Analytics Tool for PPC Reporting
- Free PPC Dashboard Templates

What Is a PPC Reporting Dashboard?
A PPC reporting dashboard includes key metrics to help highlight the performance of your paid ad campaigns, in real-time. By combining data from all of your paid channels into a single view, you can easily identify the strategies that are driving the best results and gain actionable insights that can help you optimize your return on investment (ROI).
Why Use a PPC Reporting Dashboard?
When managing PPC campaigns, it can be difficult to track performance when you are working from several different platforms. In order for you to effectively measure the impact of your efforts, you want to make sure you stay on top of every single metric.
A PPC report dashboard facilitates campaign analysis by allowing you to compare key metrics, across multiple platforms, side-by-side. This makes it a lot easier to see which platforms are delivering the best results. Additionally, using a PPC dashboard provides a great way to develop a strong relationship with your client as they can access their dedicated dashboard at any time.
Related: PPC Reporting Strategies: 11 Things You Should Include in a PPC Report
Top Metrics to Include In Your PPC Report Dashboard
A PPC report dashboard should include metrics that are relevant to your goals. Here are a few popular PPC metrics you can consider adding to your list:
1. Clicks
Clicks are the livelihood of your PPC campaign! This metric highlights the number of people that clicked on your ad. A high number of clicks can indicate that your ad has been successful in generating interest, but in order to measure the true impact of your performance, you want to track this metric alongside conversions.
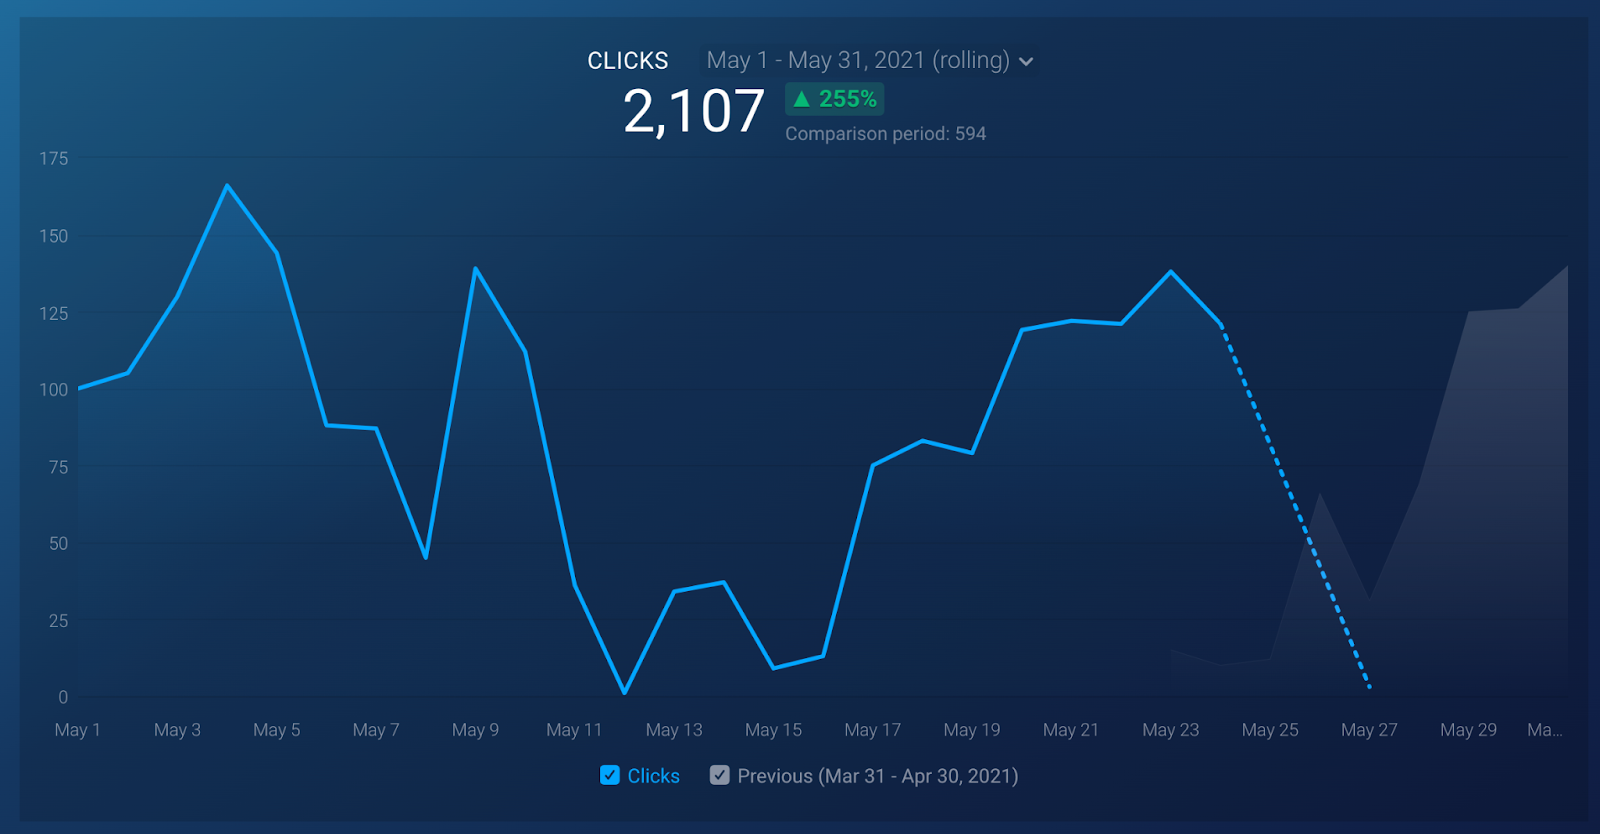
A low number of clicks signals that your audience is not resonating with your ad. In cases like these, you want to focus on adjusting ad copy or reviewing your keywords to improve campaign performance.
2. Click-Through Rate (CTR)
Click-through rate is the number of times your ad is clicked divided by the number of times your ad was shown. In other words, CTR will give you a good indication of how relevant your ad is to your audience.
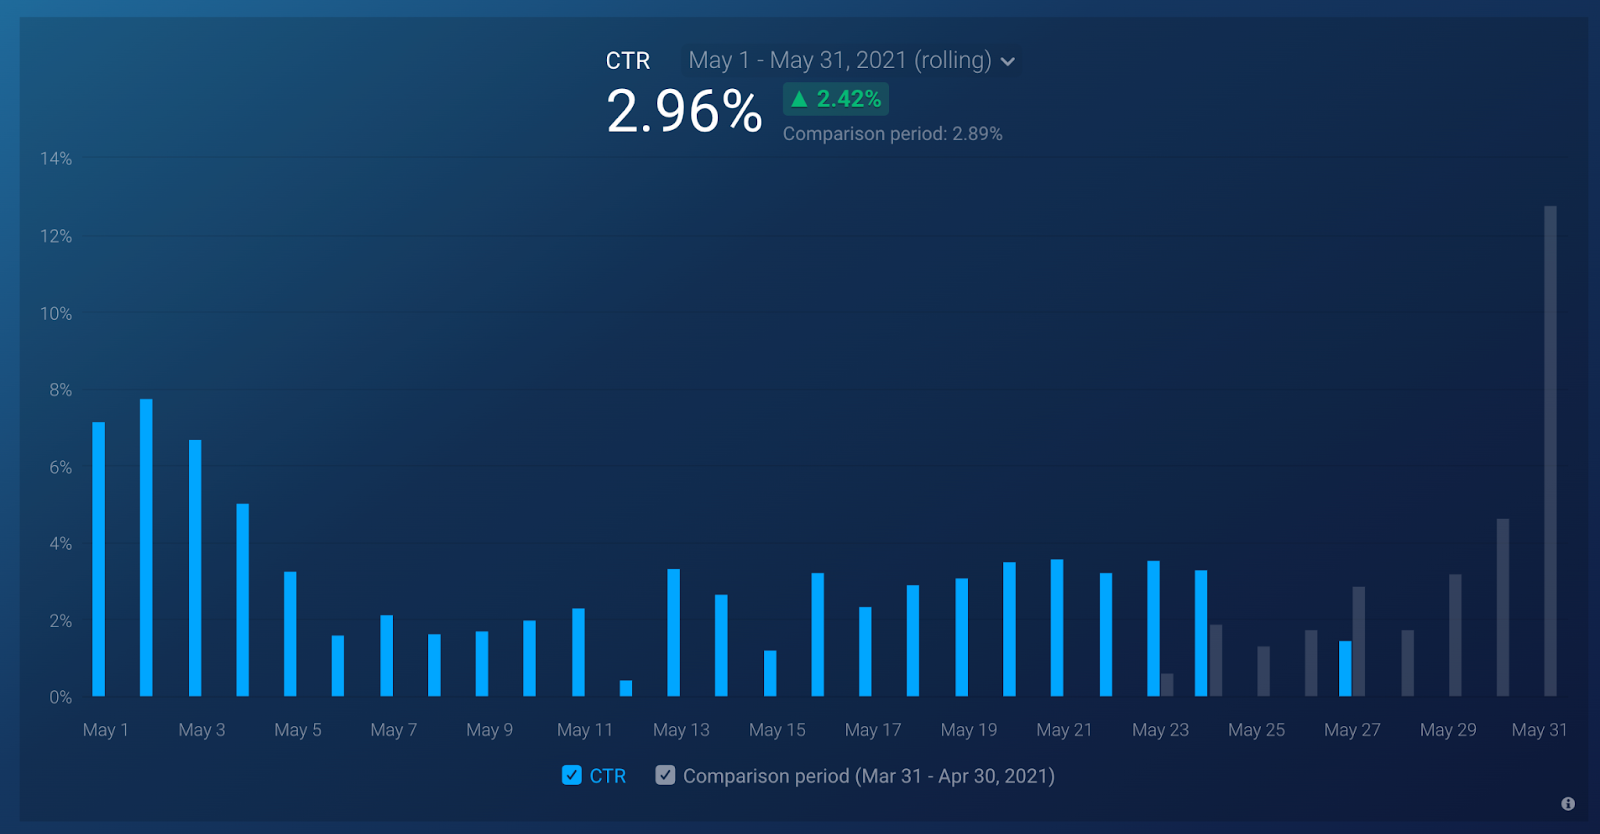
A high CTR will highlight the ads and keywords that are most successful at getting users to click after searching for a specific keyword. A low CTR indicates that you might not be bidding for the right types of keywords.
Related Article: Google Ads Click-Through Rate (CTR): What’s Considered “Good” and How Can You Increase It
3. Conversions
Conversions are the end goal of your PPC campaign. This metric will measure the number of users who completed a desired action like downloading an ebook, subscribing to a newsletter, filling out a contact form, etc.

When you are managing a PPC campaign, you want to get as many conversions as possible from your budget. The number of conversions you receive will be a good indication of the success of your strategy. With this in mind, finding ways to improve conversions should be the number one priority of your campaign.
If you notice that other metrics are performing well, but your conversions are low, try drilling down into campaign, ad, and keyword performance to identify where the disconnect in your strategy is.
4. Conversion Rate
Conversion rate will track how often a click will turn into a conversion. This metric will help you make strategic decisions about your campaign as it helps determine the effectiveness of your call-to-action (CTA).
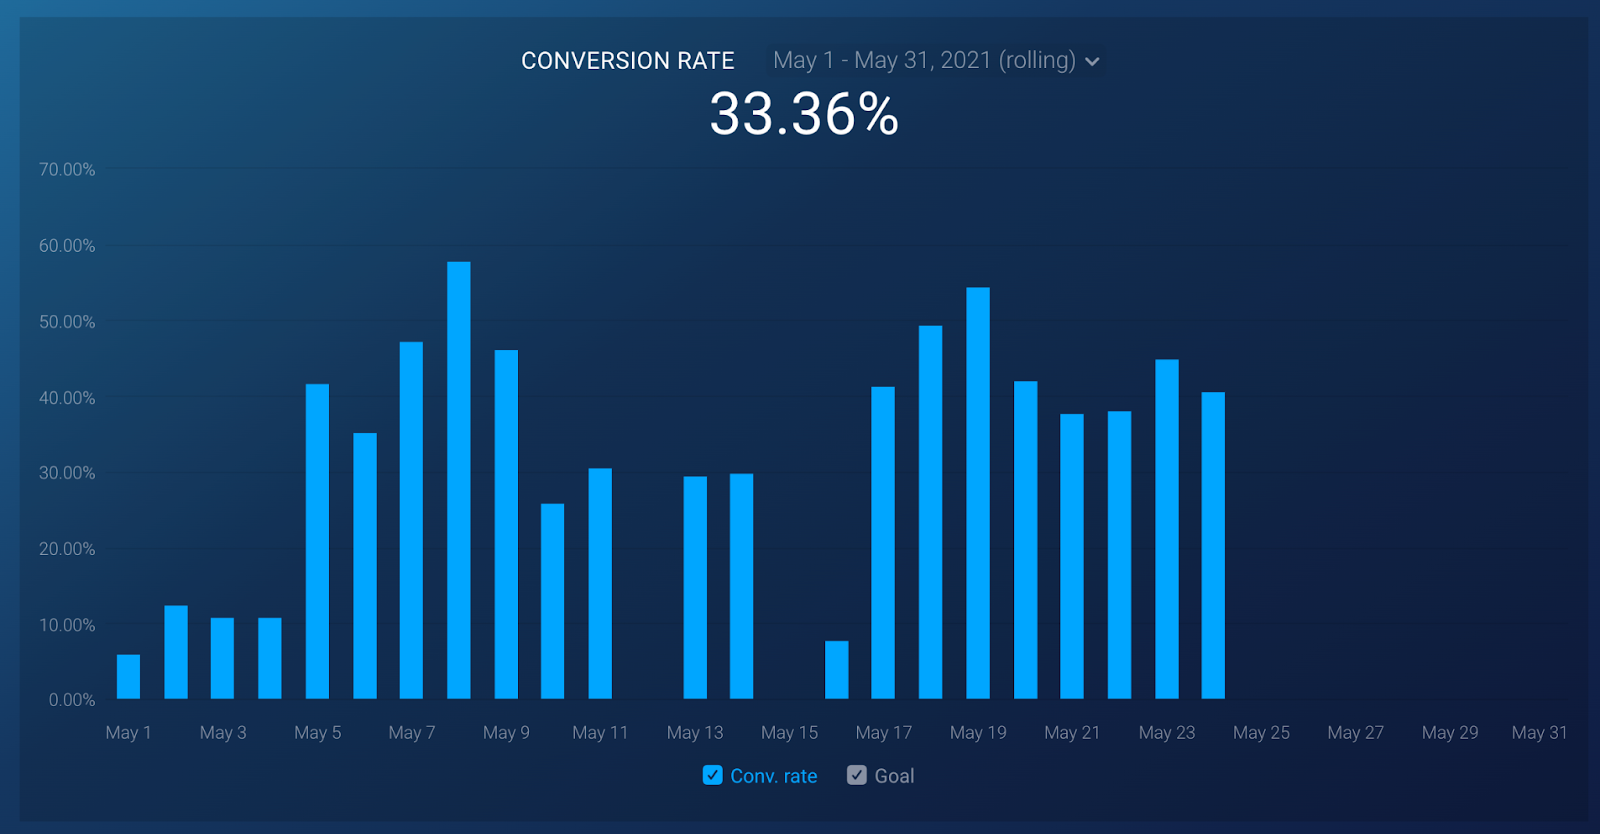
A low conversion rate can be the result of a disconnect between your ad and landing page copy or design. In cases like these, take the time to review your page copy and CTA.
5. Cost Per Conversion
Cost per conversion will tell you how much money you are spending on each conversion. By monitoring this metric, you can easily identify the campaigns that are maximizing ROI.

You should always aim to keep the cost per conversion low to ensure that customers are spending enough to make up for the cost it took you to convert them.
6. Cost
You can’t run a PPC campaign without a budget! Monitoring your cost will highlight how much of your budget you have already spent.

Monitoring cost by campaign will make it easy for you to identify the campaigns that are delivering the best results and which ones are dragging your budget.
7. Conversion Value
Conversion value will help you track how much each conversion is worth. Monitoring this metric will ensure that you are always running a sustainable campaign.
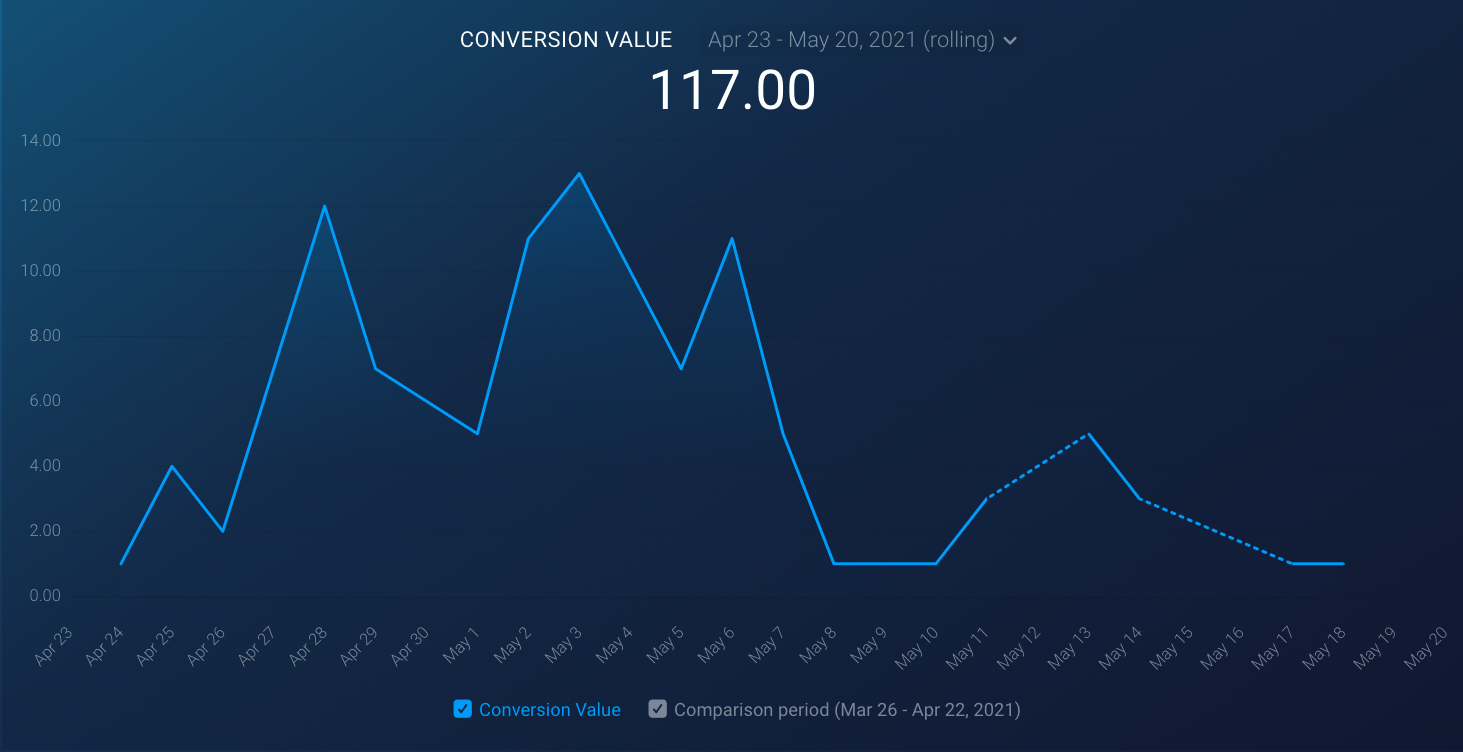
By assigning values to your conversions you can easily identify the campaigns that are generating high-value results.
PRO TIP: Here Is Your Go-To Dashboard for Monitoring the Performance of All of Your PPC Campaigns in One Place
To monitor the performance of your pay-per-click campaigns, you probably have to log into multiple tools and spend hours compiling a comprehensive report. But, with Databox, PPC reporting doesn’t have to be a time-consuming chore anymore. Now you can instantly review all of your paid campaigns in a single dashboard that monitors fundamental metrics, such as:
- Total ad spend. How much have you spent on Facebook Ads and Google Ads? Monitor both channels to measure your ROI and determine which campaigns deserve further investment.
- Facebook Ads account overview. Track engagement metrics like impressions, click-through rate, cost per click, and more, to determine which campaigns are generating the highest ROI.
- Google Ads keyword overview. See which keywords are generating the most impressions and clicks from your Google Ads campaigns.
- Cost per conversion from Google Ads. Allocate your ad spend better by measuring how much each conversion costs.
And much more.
Now you can benefit from the experience of PPC experts, who have put together a plug-and-play Databox template showing all the key insights you need to optimize your paid campaigns for conversions. It’s simple to implement and start using as a standalone dashboard or in PPC reports.

You can easily set it up in just a few clicks – no coding required.
To set up the dashboard, follow these 3 simple steps:
Step 1: Get the template
Step 2: Connect your Facebook Ads & Google Ads accounts with Databox.
Step 3: Watch your dashboard populate in seconds.
Benefits Of Using a Business Analytics Tool For PPC Reporting
Creating the ultimate PPC reporting dashboard comes down to one thing… your team’s current capabilities. Yes, you have access to the right metrics and the right platforms, but is this an efficient way to monitor and track PPC performance?
When it comes to tracking PPC campaigns, a business analytics tool is a must! Adding a tool like Databox to your marketing arsenal will help you easily adopt, adapt, automate and scale your PPC reporting process.
Let’s take a look at how you can accomplish this in more detail:
Adopt
Jumping from platform to platform is not a sustainable way to track real-time performance. By connecting all of your PPC platforms to Databox, account managers, clients, and specialists can use this dashboard as a single source of truth.
By using a PPC reporting tool, marketing agencies can easily facilitate the adoption of data tracking and analytics as part of their day-to-day routine. Being able to do this enables teams to make more data-driven decisions while also developing stronger relationships with clients.
Here are a few features in Databox that make this possible:
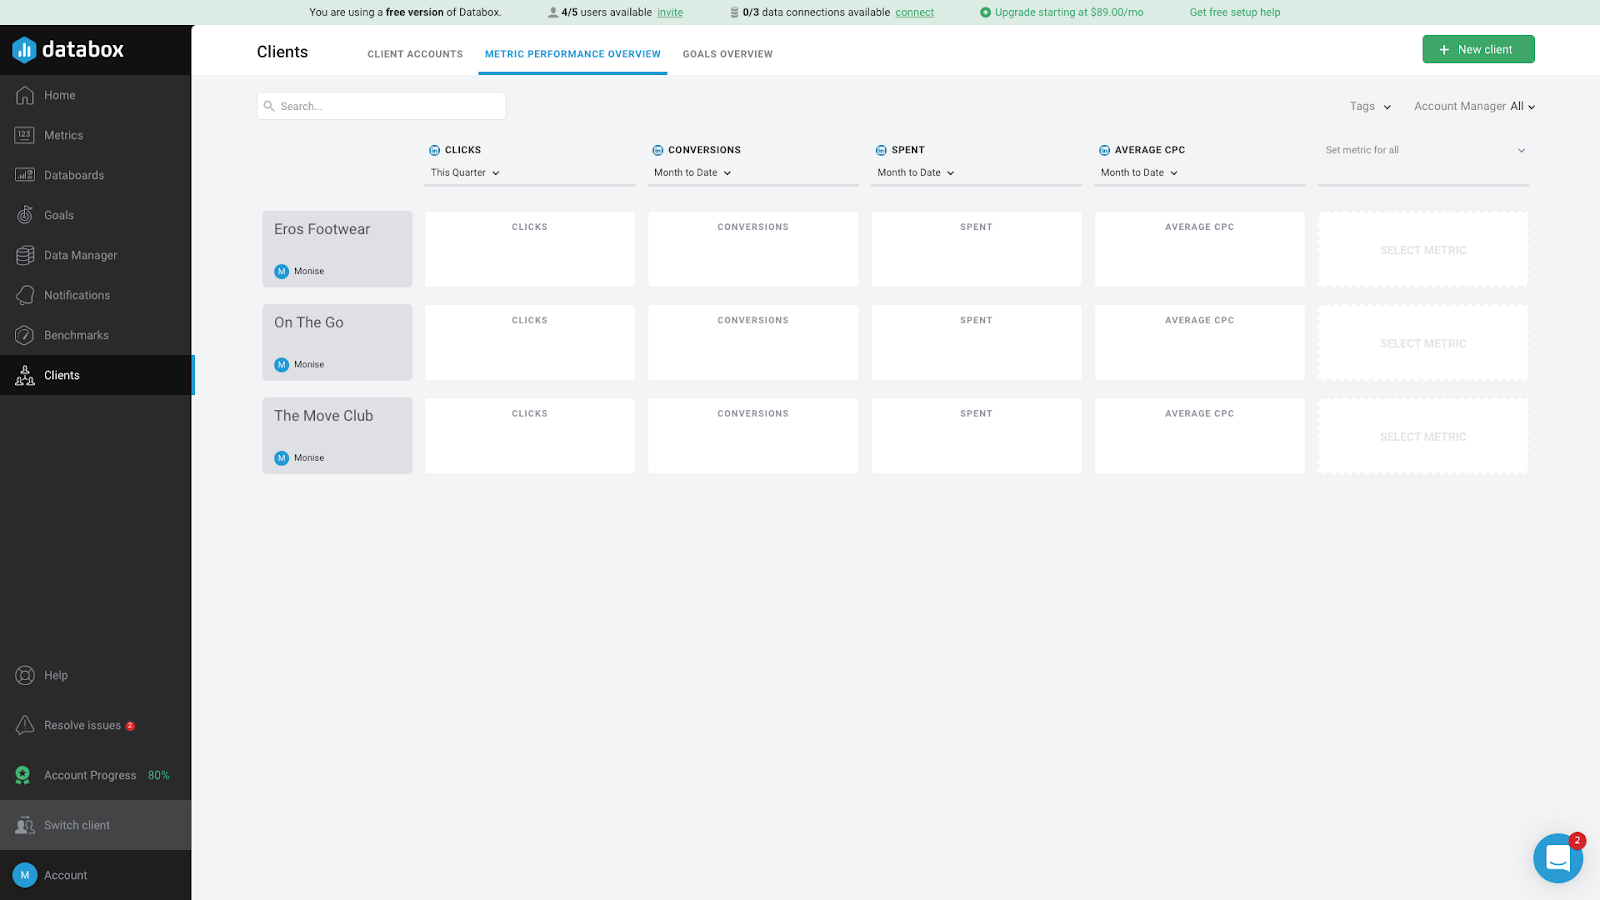
1. Client Performance Overview
By using the Client Performance Overview panel, marketing agencies can easily monitor and analyze how all PPC accounts are performing from one single view. This eliminates the work and complexity behind internal reviews of client accounts while also providing a quick snapshot of all the top metrics and goals.
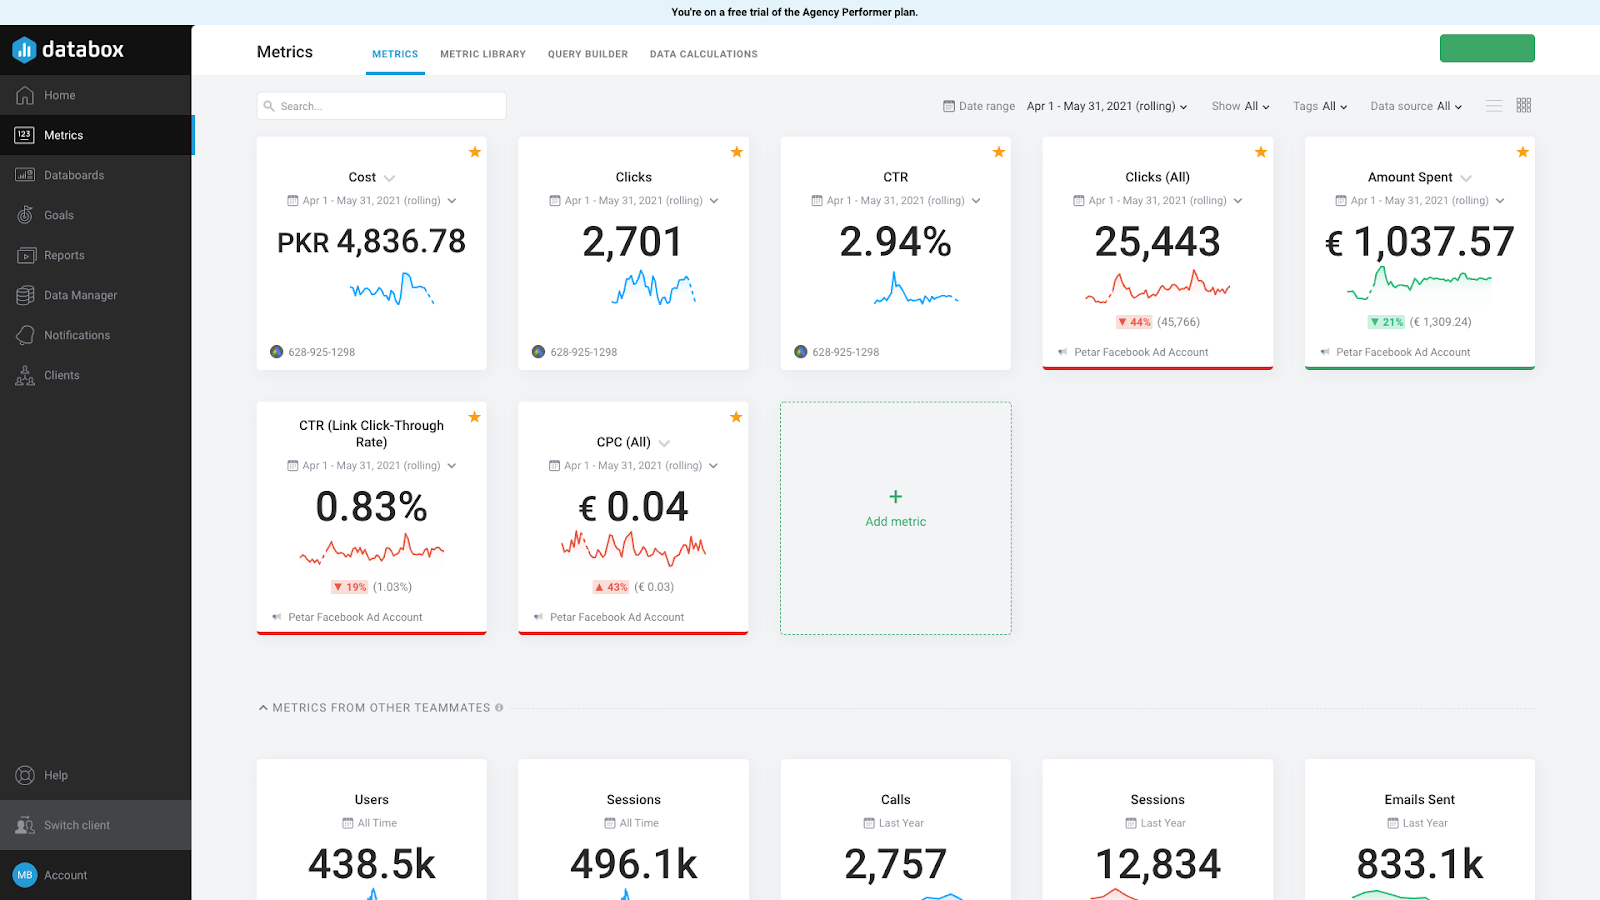
2. Metrics Screen
Account managers and specialists can use the Metrics Screen to easily align the team and collaborate on the metrics that matter the most. The metric screen can then be used as the building block for your PPC reporting dashboard.
3. Mobile App
By downloading the Mobile App, clients can access data from anywhere at any time. This helps build an effective client relationship and allows them to monitor their budget and ROI easily.

Adapt
With 130+ data source connections available, Databox makes it easy to create custom PPC reporting dashboards for each client’s needs and campaign goals.

Here are a few features that make this possible:
1. Basic Metrics
By using the metric library, you can easily drag and drop pre-configured metrics to your dashboard. With this, you can create a custom PPC report dashboard in a matter of seconds!
2. Custom Metrics
The Metric Builder allows you to further customize your dashboards by including dimensions and filters to your data. This helps you only show the most relevant data to your client.
With the Metric Builder, you can also access data from third-party integrations to report on metrics that might not be native to Databox.
3. Data Calculations
Data calculations can help you provide more context to the performance of your client’s PPC campaigns. You can create calculated metrics to monitor ROI and ROAS or combine metrics from multiple data sources to get a better understanding of your client’s overall performance.
4. Visual Settings
Visual settings will allow you to control the look and feel of the dashboard you share with your clients, helping you maintain consistency in your presentation. With Databox, you can easily adapt the look and feel of your reporting dashboard to match the audience you are presenting to.
Automate
Tracking and reporting on PPC data is time-consuming. The more time you spend creating your dashboards, the less time you actually have to monitor and improve campaign performance.
With Databox, you can automate your reporting and data analytics from start to finish. In just a few minutes you can create your dedicated PPC dashboard, set up alerts and notifications, schedule sends, and build a report!
Here are a few key features that make automated PPC reporting possible:
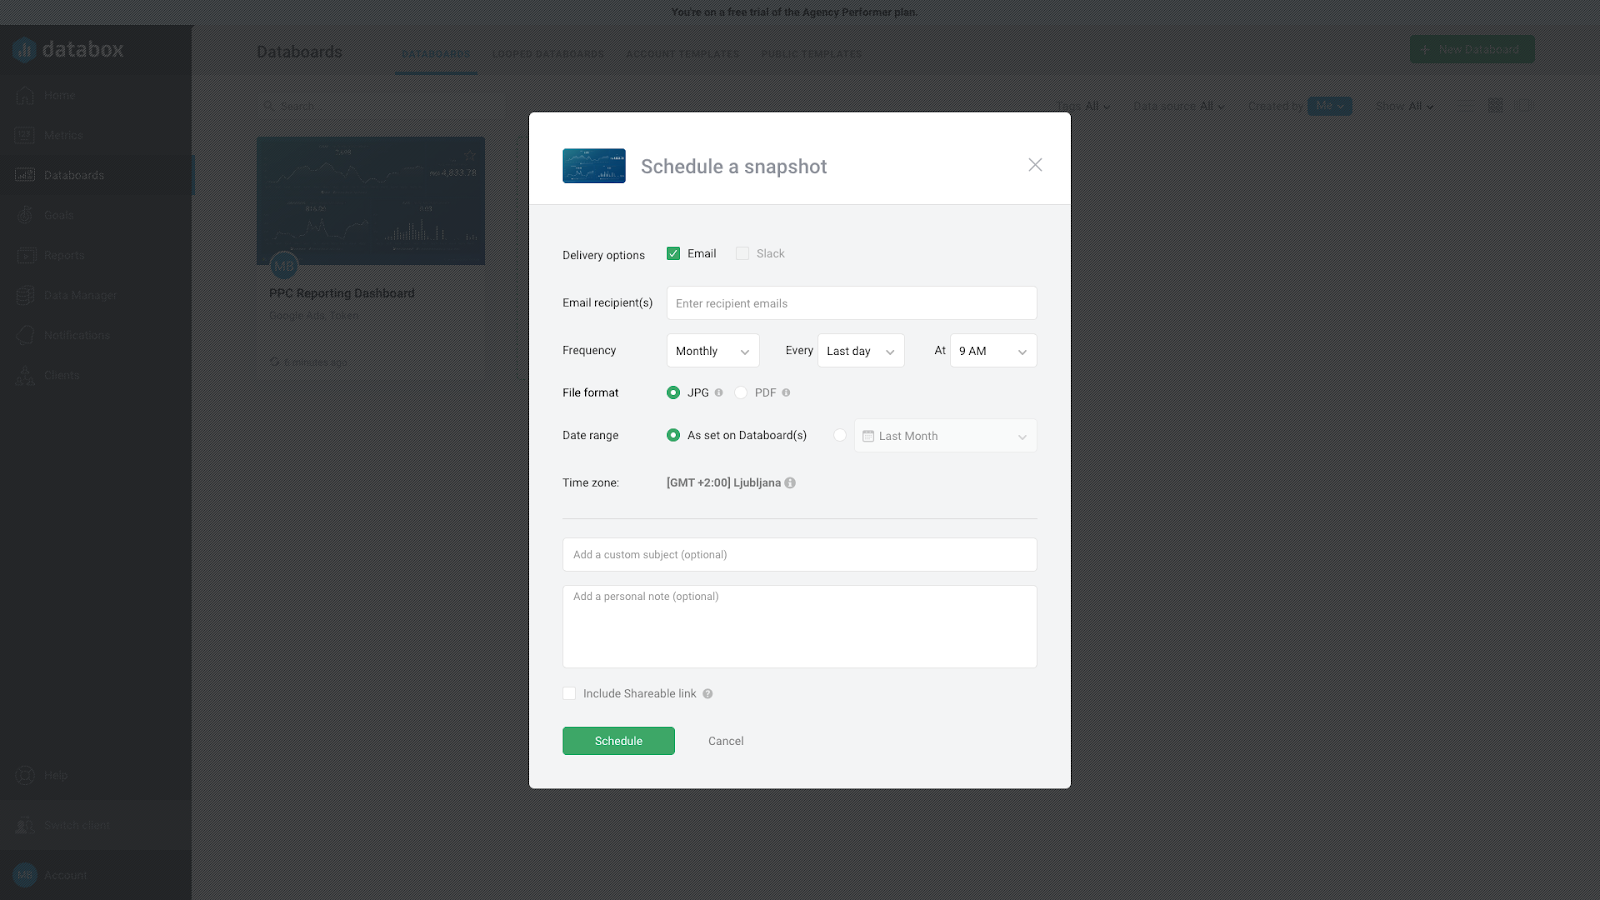
1. Scheduled Snapshots
With Scheduled Snapshots, you can set your dashboards to be sent at a recurring schedule. With this you can export PDFs or JPGs of your PPC dashboards, helping make data a more regular part of your team’s routine.
2. Alerts
With Alerts, you can automatically and proactively monitor your data and get notified of any emerging trend. An Alert will trigger a notification to your email or slack channel that might indicate you need to adjust your strategy. This feature helps you better understand how your strategies are affecting your client’s bottom line.

3. Goals
Goals help you stay up-to-date on the progress towards reaching your business objective. This helps highlight the progress of your marketing efforts. As an example, you can set a Goal in Databox to monitor your daily, weekly, monthly, and quarterly progress. An alert will be created to automatically notify you when you hit your target.

Scale
One of the biggest obstacles marketing agencies face is scalability. A long reporting process makes PPC reporting inefficient and hinders growth. This is because agencies find it difficult to onboard new accounts due to time constraints. Additionally, existing clients also suffer as account managers don’t have enough time to work on more advanced campaigns.
With a business analytics tool like Databox, marketing agencies can align team members around the same metrics, develop a reporting process that can be easily adopted, facilitate internal account reviews, and help build a better relationship with clients to improve client retention.
Free PPC Reporting Dashboard Templates
With 40+ ready-to-use PPC dashboard templates, you can track the most common PPC metrics in just a few clicks!
Here are a few dashboards to get you started:
- Google Ads PPC Performance Dashboard
- Facebook Ads & Google Ads Paid Marketing Overview Dashboard
- LinkedIn Ads Overview Dashboard
- Twitter Ads: Account Overview Dashboard
- Microsoft Advertising: Campaign Performance Dashboard
1. Google Ads PPC Performance Dashboard
The Google Ads PPC Performance Dashboard provides a holistic view of your most important paid advertising metrics.
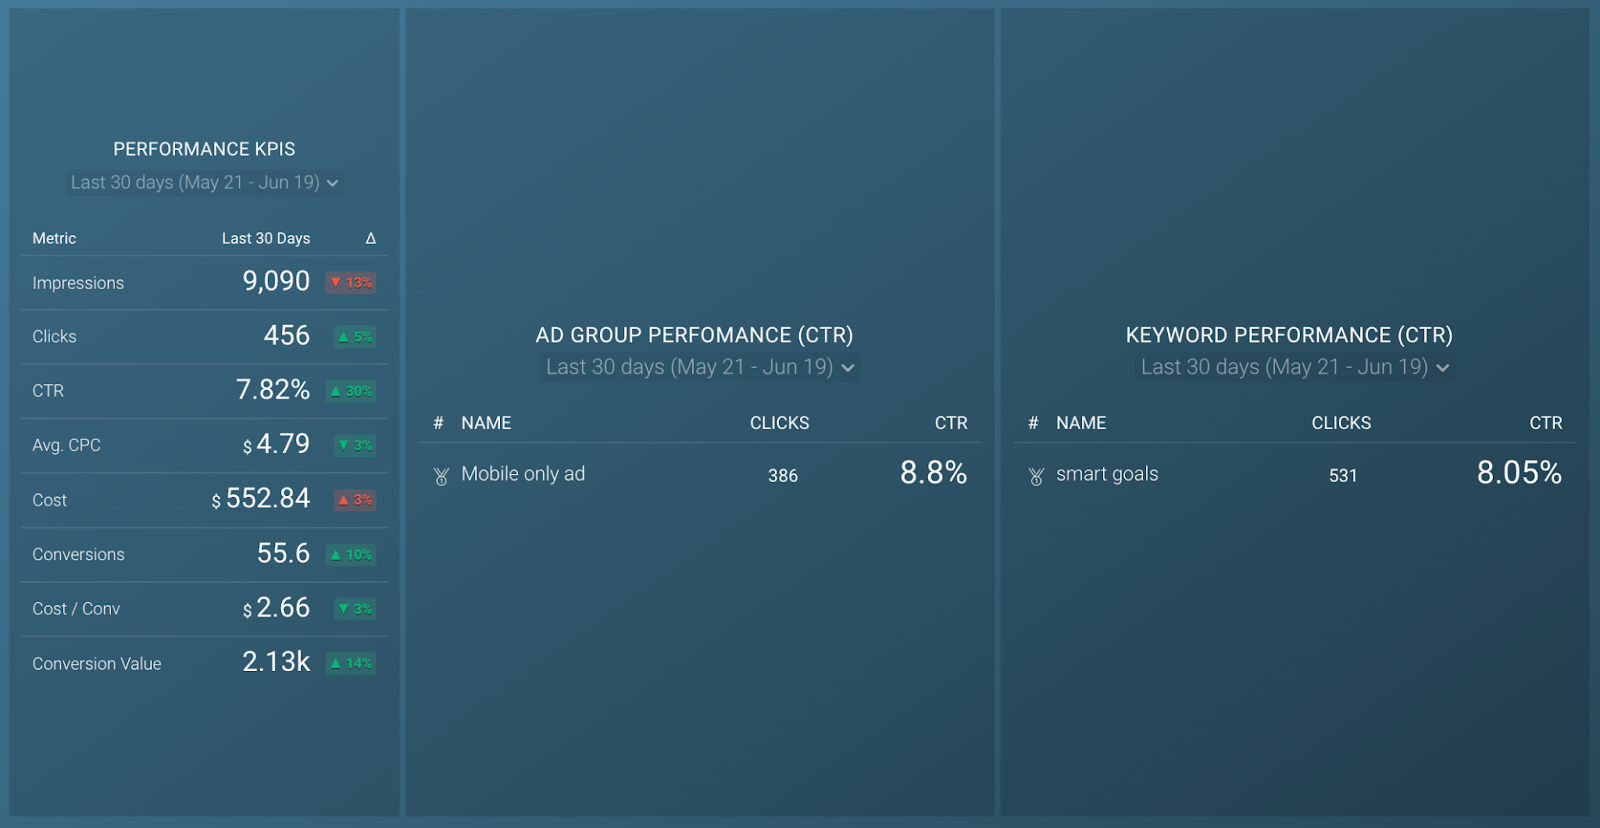
By connecting your Google Ads account to Databox, you can use this template to:
- Track the most important metrics from your Google Ads campaigns
- Effectively measure click-through rate (CTR) for all your ad groups
- Track clicks by keywords to monitor ad performance
2. Facebook Ads & Google Ads Paid Marketing Overview Dashboard
If you are looking for a dashboard to highlight how your PPC campaigns are affecting your bottom line, the Facebook Ads & Google Ads Paid Marketing Overview Dashboard is what you are looking for!

By combining data from Google Ads, Facebook Ads, and Google Analytics, you can expect to learn more about:
- How your spend is being used across both paid channels. This will help you monitor ROI and determine which channels are worth your continued investment.
- The ads are performing well. This will help you determine which campaigns should be paused.
- The keywords that are generating the most impressions and clicks. This will help you adjust your ad copy and targeting to maximize performance.
3. LinkedIn Ads Overview Dashboard
To monitor your ROI from LinkedIn Ads, the LinkedIn Ads Overview Dashboard will measure your LinkedIn campaign performance by tracking metrics like impressions, clicks, CTR, and more.

By connecting your LinkedIn Ads account to Databox, you can use this template to answer questions like:
- How many times was my Ad shown to a LinkedIn user?
- How many users are engaging with my ads?
- How much have I spent on LinkedIn campaigns?
- How do I check the engagement rate of my ads?
4. Twitter Ads: Account Overview Dashboard
The Twitter Ads: Account Overview Dashboard gives you an overview of the most important metrics in your Twitter Ads account. By tracking all of your Twitter Ads metrics in one place you can easily:
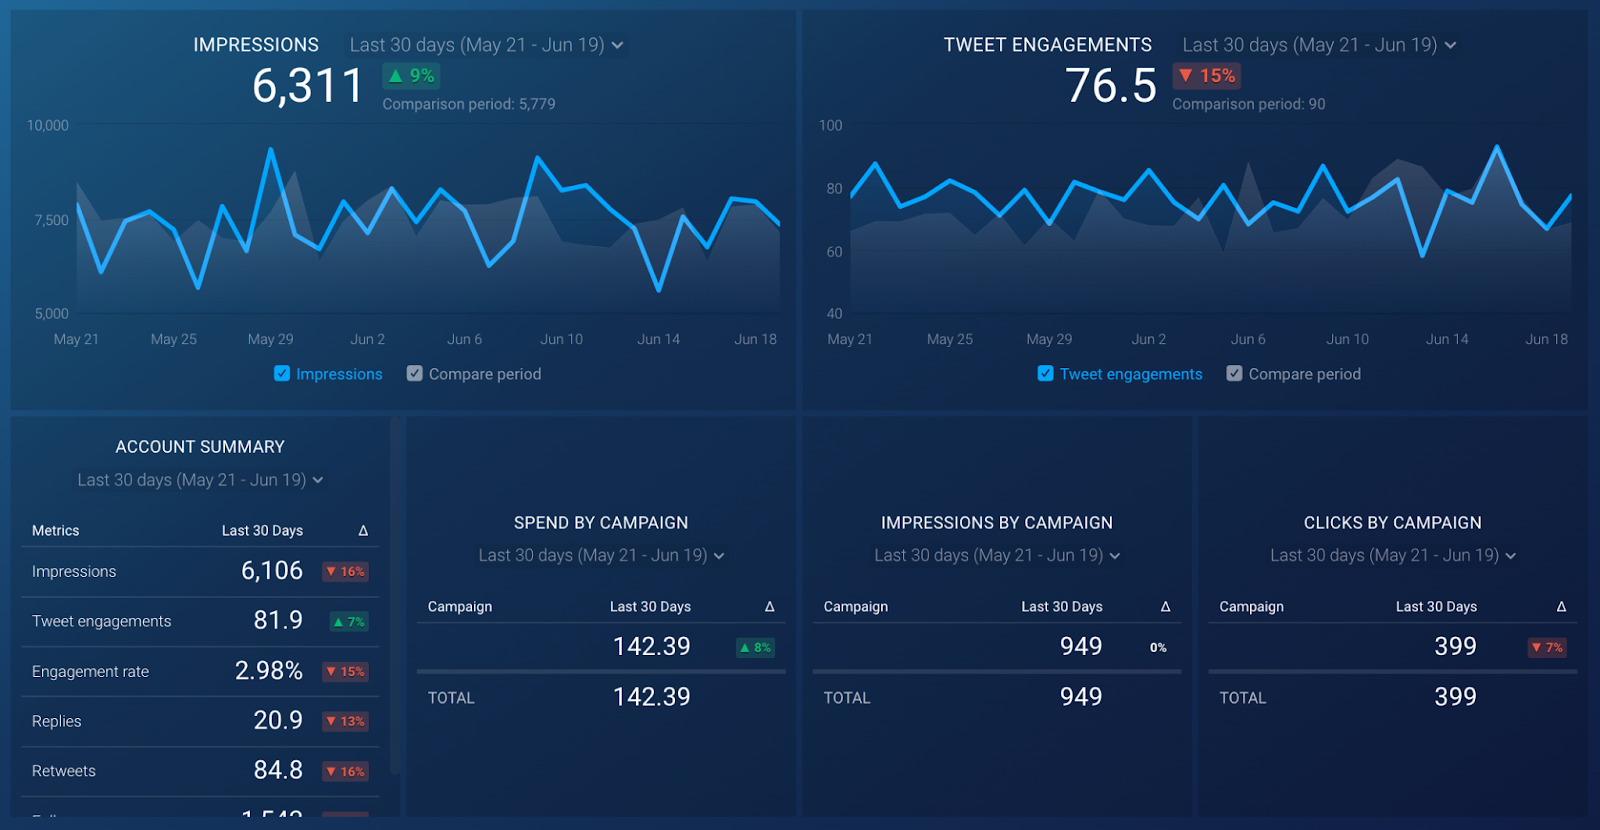
- Get a campaign-level view of your whole Twitter Ads account
- Track impressions and engagement
- Monitor your improvement month over month
5. Microsoft Advertising: Campaign Performance Dashboard
You can use the Microsoft Advertising: Campaign Performance Dashboard to answer crucial questions related to your campaign performance.
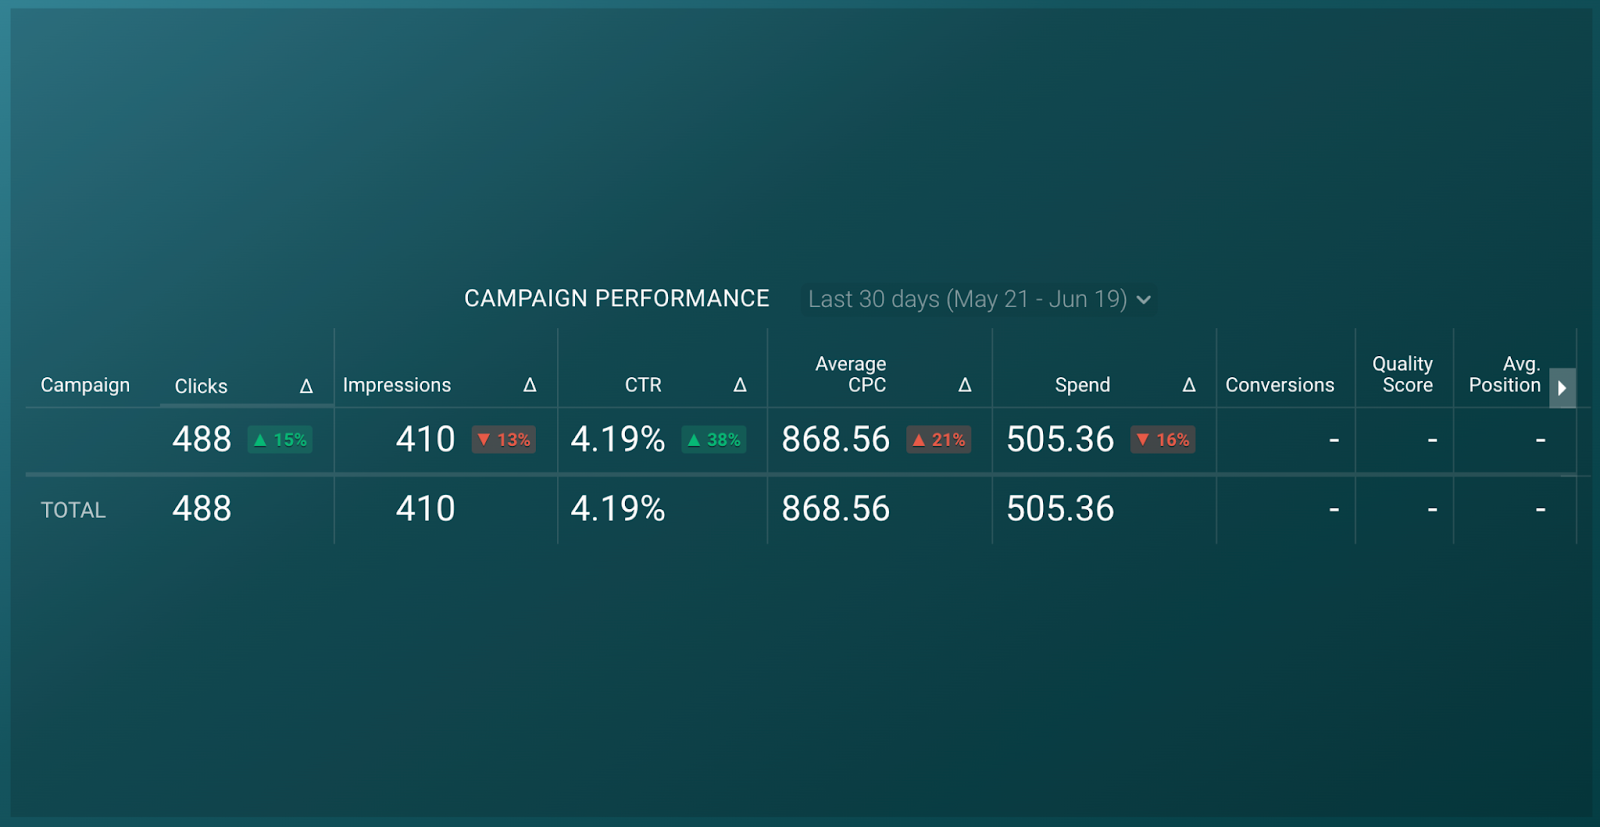
Once you have connected Microsoft Advertising to Databox, you can use this template to track:
- Impressions
- Clicks
- Average CTR
- Conversions
- Spend
Scale PPC Reporting With Databox
As an agency, you need an accessible and scalable way to manage ads across multiple platforms. Having a dedicated dashboard that provides real-time access to all this data, will help you efficiently monitor campaign performance.
And the truth is that creating a PPC report dashboard does not have to be a time-consuming task. With Databox, you can create custom PPC dashboards in a matter of minutes. Account managers and specialists can focus their efforts on making more data-driven decisions while clients have more visibility into their performance. Sounds like a win-win to me!
Sign-up for a free-forever plan to explore how you can scale your PPC reporting process with Databox.


