")
Table of contents
Dashboards show what happened. Conversational analytics lets you ask why and get an answer before the meeting ends.
TL;DR
- Conversational analytics lets you query your business data in plain language and get plain-language answers, without SQLs, analyst tickets, or wait.
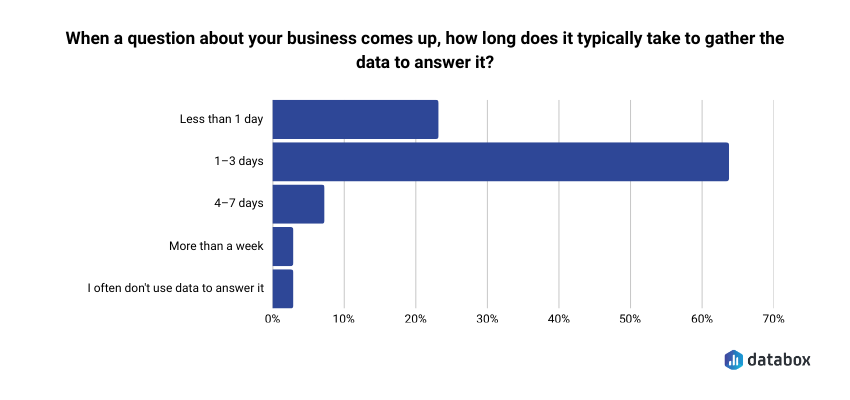
- Most teams take 1–3 days to answer an ad hoc data question. Conversational analytics collapses that to seconds, in the meeting where the decision is being made.
- The critical difference between purpose-built tools and generic AI: one retrieves results from your live data, the other predicts what your metrics probably say and gets it wrong.
- Conflicting metric definitions across teams will break any conversational analytics tool. Standardizing definitions is the prerequisite, not an afterthought.
- Dashboards and conversational analytics are not competitors. Dashboards track. Conversational analytics investigates. You need both.
Introduction
Conversational analytics is the ability to query your business data in plain language and get plain-language answers back, without SQL, dashboard configuration, or analyst queue.
Monday morning leadership meeting. The pipeline coverage dashboard is up on the screen. MQL volume is down 23% week-over-week. The CMO asks the obvious question: why?
The answer from the marketing ops lead: “We’ll have to pull that. Probably by Wednesday.”
The meeting moves on. The decision whether to pause the new campaign, reallocate budget, or do nothing gets deferred. By the time Wednesday arrives, the CFO has already drawn her own conclusions from the same dashboard, and the conversation is no longer about root cause. It’s about defending the number.
This isn’t an unusual situation. According to Databox research Time to Insight, 64% of teams say it typically takes 1–3 days to gather data to answer a business question. That’s not a technology failure, it’s the structural cost of analytics built for reporting cycles rather than live decisions.
The gap between seeing that something changed and understanding why is where most marketing analytics fail. Dashboards are built for tracking – they show what happened. But marketing leaders don’t just need to know what. They need to know why, and they need to know it while the decision is still live.
Conversational analytics closes that gap. Instead of configuring a report, filing a ticket, or waiting for an analyst to get to your question, you type the question itself: “Why did MQL volume drop last week?” And you get an answer: not on Wednesday, but before the meeting ends.
By the end of this guide, you’ll understand what conversational analytics is (and what it isn’t), how it works without a technical background, what marketing leaders can actually do with it today, and where to start.
Conversational Analytics Is a Query Model, Not a Dashboard Feature
Conversational analytics is the ability to query your business data using plain-language questions and receive plain-language answers back. No SQL, dashboard configuration, or analyst queue. You type a question the way you’d ask a colleague, and the system returns a structured, data-grounded response.
Before going further: the term “conversational analytics” appears in two completely different contexts. In CX and contact-center operations, it refers to analyzing customer call or chat transcripts for sentiment and intent. That’s not what this article covers. Here, conversational analytics means the BI and data use case, asking your business metrics questions in natural language and getting answers drawn from your live connected data.
The mental model shift matters. Traditional BI assumes you know what you want before you look. You build a dashboard, configure the filters, set the date range, and interpret the result. Conversational analytics flips the model: you discover what you need to know by asking. The report doesn’t exist until you ask the question, and it answers exactly what you asked, not what someone anticipated you might want months ago when they built the dashboard.
The category is not fringe. Grand View Research projects the conversational AI market will grow from $14.3 billion to $41.39 billion by 2030. Marketing leaders who wait for the capability to “prove itself” will find themselves competing against peers who integrated it into their weekly cadence long ago.
Dashboards Track. Conversational Analytics Investigates. You Need Both.
The comparison is not either/or. Dashboards and conversational analytics do two different jobs, and marketing teams need both.
Dashboards are built for tracking. They answer the same questions at the same cadence: weekly pipeline, monthly traffic, quarterly revenue. Everyone looks at the same numbers on the same screen. That alignment function is real and necessary.
But dashboards break down the moment someone asks a question that wasn’t anticipated when the dashboard was built. “What was ROAS by channel last quarter compared to the same quarter last year?” “Why did conversion rate drop after the April campaign launched?” “Which landing pages are underperforming for the enterprise segment?” None of these have a button. Each requires an analyst, a ticket, and time you don’t have.
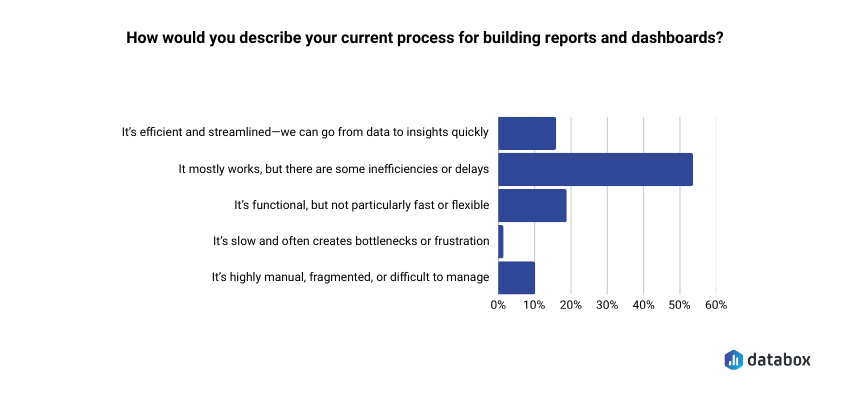
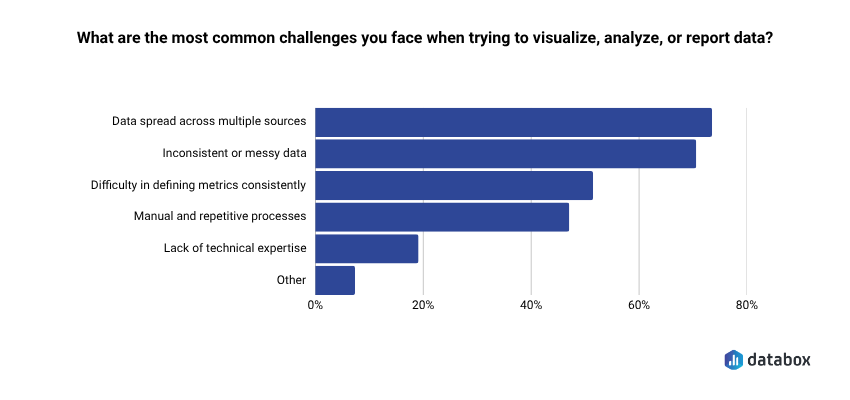
In Databox research Time to Insight, more than half of respondents (54%) said their reporting process mostly works but has inefficiencies or delays, and 73% cited data spread across multiple sources as their top challenge. The problem isn’t the dashboard itself. It’s that dashboards were never designed to answer questions that weren’t anticipated when they were built.
| Dimension | Traditional Dashboard | Conversational Analytics |
|---|---|---|
| How you query | Configure filters, adjust date ranges | Type or speak a plain-language question |
| Latency | Scheduled report or analyst ticket | Real-time answer |
| Who can use it | Analyst-dependent for ad hoc questions | Self-serve for any functional leader |
| What you get back | Chart or table; you interpret | Plain-language answer with supporting visual |
| Follow-up | Start a new report or ticket | Continue the conversation; context carries |
Dashboards are optimized for alignment: keeping the team on the same numbers. Conversational analytics is optimized for investigation: when a number moves, you need to know why, and you need to know now.
How It Actually Works And Why Most AI Tools Get the Math Wrong
Understanding the mechanism builds trust, and trust is the barrier for most marketing leaders who have tried asking ChatGPT a business data question and gotten a plausible-but-wrong number back.
Here’s the distinction that matters most, and it’s one most vendors don’t explain clearly: there are two fundamentally different architectures, and only one of them gives you reliable answers.
In most AI-powered data tools, the LLM does the math. It reads your numbers, computes averages, identifies trends, and generates a result. This is where hallucination happens. The model is producing a statistically plausible answer based on patterns, not retrieving the actual number from your data. Sometimes it’s close. Often it isn’t. And you rarely know which.
In a properly built conversational analytics system, the LLM only generates language. The computation happens in a separate layer that runs actual queries against your live data. The model never touches the math. It just translates your question into a query, runs it, and then narrates the result back in plain language. Ask your vendor directly: does the LLM ever touch the math? If yes, the accuracy ceiling is lower than it should be.
A purpose-built conversational analytics tool works in three steps:
1. You ask a question in plain language. No special syntax or filter menus. Just the question you actually have: “What was our CAC this quarter compared to last year?”
2. The system translates it. Natural language processing identifies your intent (a comparison) and the entities you’re asking about (CAC, this quarter, last year). The system converts your question into a structured query that runs against your connected, live data. Not a prediction. A query.
3. You get a plain-language answer with context. Not just a number, but a number with explanation: trend direction, comparison to prior period, segment breakdown if relevant. The context carries forward, so you can follow up: “Break that down by channel.” “Which segment drove the most change?”
Three technical terms worth knowing:
NLP (natural language processing): The layer that reads your question and figures out what you’re actually asking — intent and entities, not keyword matching.
LLMs (large language models): Handle the generation of the plain-language response. In a governed analytics platform, the LLM generates language based on query results; it never does your math.
Semantic layer: The dictionary that ensures “CAC” means the same thing whether your CFO asks it or your demand gen manager asks it. One definition, enforced across every query.
Databox Genie is built on this model: connected to your live data from 130+ integrations including HubSpot, Salesforce, and Google Ads, with your metric definitions standardized, so when you ask “Why did MQL volume drop last month?” you get the answer, not an AI guess.
Five Questions Marketing Leaders Can Actually Ask Right Now
Most content about conversational analytics stays abstract. Plenty of articles explain the concept. Almost none show a marketing leader what it actually looks like in their workflow. Here are five scenarios, written as the questions a VP of Marketing would genuinely type.
Campaign Performance
Question: “Which channels drove the most pipeline last quarter?”
Old way: Pull channel attribution report from the CRM, add ad platform data, reconcile manually in a spreadsheet, present in next week’s review.
New way: Answer in seconds, broken down by channel, with period comparison already included.
Decision unlocked: Budget reallocation conversation happens in Tuesday’s standup, not next month’s QBR.
Budget Defense
Question: “What was our ROAS by channel in Q1 vs. Q2?”
Old way: Finance pulls ad spend. Marketing pulls revenue attribution. Someone reconciles the two. Three-day turnaround minimum.
New way: A single query returns the comparison with variance flagged.
Decision unlocked: The CMO walks into the board meeting with the number, not a placeholder.
Trend Investigation
Question: “Why did our conversion rate drop after the April 3 campaign launched?”
Old way: An analyst digs into GA4, the CRM, and landing page data. Hypothesis-driven investigation. Report back in 48 hours.
New way: Ask the question. Here’s what Genie actually returns:
Genie response:
Your overall conversion rate dropped from 3.2% to 1.9% in the 7 days following the April 3 campaign launch. Here’s what the data shows:
- Traffic source: Paid social traffic increased 41% but converts at 0.8% — well below your 2.4% site average. Organic traffic held steady and continued converting at 3.1%.
- Landing page: The new campaign landing page (lp-april3-promo) has a 78% bounce rate vs. your 52% average. Visitors who land there are not reaching the form.
- Segment: Enterprise visitors were largely unaffected (conversion held at 2.9%). The drop is concentrated in the SMB segment, which makes up 68% of the campaign’s traffic.
Suggested follow-up: “How does the April 3 landing page compare to our top-converting pages by form completion rate?”
Decision unlocked: Pause or pivot the campaign the same day, not after it has run for two more weeks on a broken landing page.
Cross-Team Reporting
Question: “How does our CAC this quarter compare to last year?”
Old way: The finance definition of CAC differs from the marketing definition. A reconciliation meeting is required before the answer can even be computed.
New way: With a governed semantic layer, CAC has one definition. The answer comes back consistent, every time.
Decision unlocked: Leadership alignment on the number itself, not on which number to use.
Budget Pacing
Question: “What’s our month-to-date ad spend by platform, and how does it compare to where we expected to be?”
Old way: Pull spend data from Google Ads, Meta, and LinkedIn separately. Cross-reference against the planned budget in a spreadsheet. Build a summary. Send it to the CMO before the meeting. Hope the numbers reconcile.
New way: One question returns a clean breakdown by platform: Google, Facebook, LinkedIn, Microsoft, Reddit, against your pacing target, with variance flagged. Follow up: “Split the Google spend into Search and YouTube.” Done in under a minute.
Decision unlocked: The CEO checks budget pacing before a leadership meeting without opening a Slack thread, creating analyst anxiety, or waiting for a report. The answer is there when the question forms, not an hour later.
What Conversational Analytics Actually Changes for Marketing Leaders
Generic AI benefits like “efficiency” or “insights” mean nothing without translation. Here is what conversational analytics actually changes for a marketing leader running a team.
Speed to decision. The 72-hour analyst lag on ad hoc questions collapses to seconds. When the answer arrives in the same meeting where the question was asked, the decision gets made, not deferred to next week’s check-in.
“Having an AI analyst that can just tell you why a metric has dropped and what’s likely driving it, that’s what we’ve needed for years. Genie feels like having a smart teammate who’s always watching the data.”
Credibility in leadership reviews. No more “I’ll have to check on that and follow up.” When a CFO challenges a number, you pull the answer in real time. The dynamic shifts from defense to discussion.
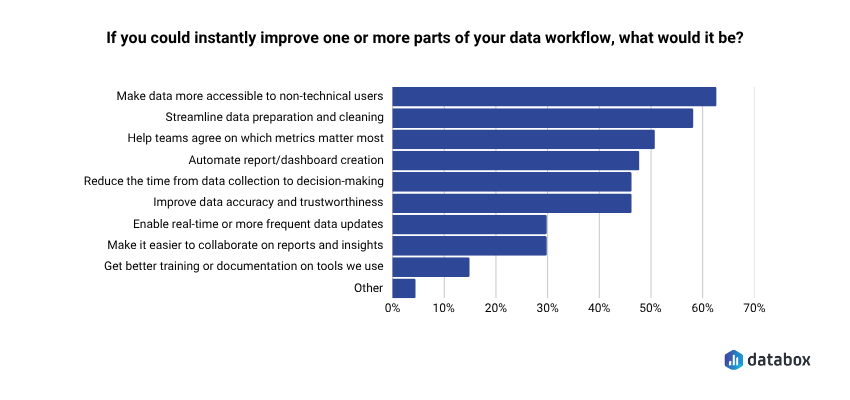
Broader team data literacy without SQL training. In Databox research Time to Insight, 62% of respondents identified making data more accessible to non-technical users as a top priority. When anyone on the marketing team can ask a question and get a governed answer, data stops being a bottleneck owned by one analyst. Remove the bottleneck, raise the ceiling.
More strategic analyst time. Routine data pulls “what was traffic last month?” or “how many MQLs did we generate in March?” get handled by conversational tools. Analysts move to modeling, forecasting, and interpretation work that requires human judgment.
Decisions made with data, not despite missing it. The alternative to fast answers is not careful deliberation. It’s decisions made on gut, on whoever spoke last, or on data that’s 30 days stale. Speed is not the enemy of rigor. Waiting is. Databox research on data transparency found that 93% of respondents said data transparency has a positive impact on team alignment and collaboration, but transparency requires access, and access requires tools that don’t funnel every question through a single analyst.
The time savings are immediate. In a recorded workflow, a marketing leader using Genie to prepare a lead pacing update for a leadership meeting, pulling month-to-date figures, breaking down by source, and generating a paste-ready summary, completed the full analysis in under 3 minutes. The same task across multiple dashboards had previously taken 30 to 60 minutes.
The adoption curve supports this direction. McKinsey reports 88% of organizations now use AI in at least one business function. Gartner projects 33% of enterprise software will include agentic AI by 2028, up from less than 1% in 2024. The question is not whether conversational analytics will become standard infrastructure, it’s whether you adopt it before or after your competitors do.
What to Watch Out For: The Limits That Matter
A VP of Marketing who has asked ChatGPT a business data question and gotten a plausible-but-wrong answer needs to see these caveats acknowledged. Addressing concerns directly builds more trust than ignoring them.
The Hallucination Risk Is Real, But Avoidable
Generic AI tools (ChatGPT, Claude, others) don’t connect to your live data. They predict what your metrics probably say based on training patterns. If you paste in last month’s report and ask questions, you may get statistically plausible answers that are factually wrong for your specific business.
A purpose-built conversational analytics tool runs actual queries against live connected data. The distinction is prediction vs. retrieval. One is a guess. One is a result. (See the architecture section above, this is the single most important thing to verify when evaluating any tool.)
The “Three Versions of CAC” Problem Will Break Any Tool
If your marketing team, finance team, and RevOps team each calculate CAC differently, a conversational analytics tool will return different answers to the same question, and no one will trust it.
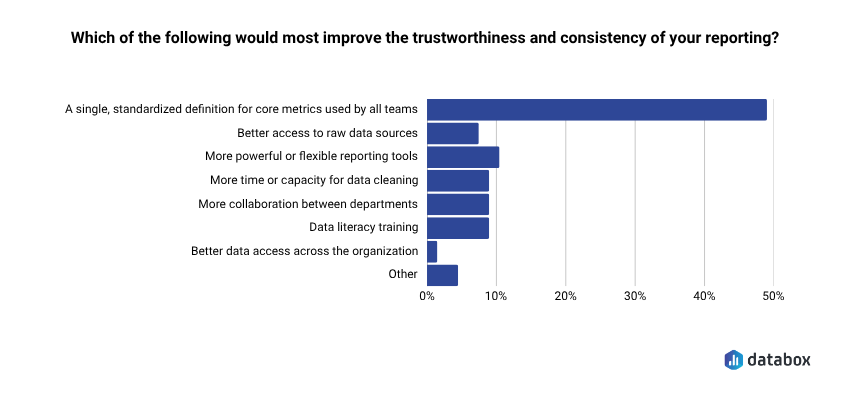
This is more common than most teams admit. In Databox research Time to Insight, nearly half of respondents (48%) said a single standardized definition for core metrics would most improve the trustworthiness of their reporting.
A data governance problem must be solved before conversational analytics delivers reliable answers. The semantic layer is the technical solution. Getting teams to agree on definitions is the organizational one. The tool doesn’t fix broken governance, it exposes it.
Data Quality Is the Prerequisite, Not a Nice-to-Have
Conversational analytics surfaces what’s in your data. It cannot fix data that’s incomplete, miscategorized, or stale. Garbage in, garbage out still applies. The quality of your answers is bounded by the quality of your connected data sources.
Dashboards Don’t Go Away
Dashboards do the tracking job. Conversational analytics does the investigation job. Both belong in a modern marketing analytics stack. Replacing your dashboards with conversational querying alone would be like tearing out your scoreboard because you hired a better analyst. You still need the scoreboard. You just also need someone who can explain why the score changed.
“We used Databox for client reporting for years and recently tested alternatives, but nothing came close. When we came back, Genie blew us away — AI-powered insights that actually make sense for marketers.”
How to Start Without a Data Team
No engineering prerequisites. No data warehouse setup required. These five steps get you to first value within a week.
1. Connect your core data sources. Start with the three platforms your marketing team lives in: your CRM (HubSpot or Salesforce), your primary ad platform (Google Ads, Meta), and your web analytics (GA4). These three sources answer the majority of marketing performance questions.
2. Standardize your 5–10 most critical metric definitions. Before you ask your first question, agree on what CAC, MQL, and ROAS mean: one definition per metric, shared across marketing and finance. Skipping this step means spending the next month debugging conflicting answers.
3. Ask your most common ad hoc question first. What’s the question your analyst gets most often? Start there. Type it in plain language exactly as you’d ask a colleague. Evaluate the answer: is it directionally correct? Does it match what you’d expect?
If you’re already using Databox, Genie is available now. Type your first question in plain language and see what comes back. No SQL. No ticket. No wait.
4. Follow up in the same conversation. After the first answer, dig one level deeper: “Break that down by channel.” “Compare to last quarter.” “Which segment drove the most change?” The context carries; you’re in a dialogue, not starting a new report.
5. Share the answer, not the dashboard, in your next leadership review. Instead of sharing a link to a dashboard and narrating it, share the plain-language answer with the supporting visual. The shift makes the value visible to your leadership team, and that’s how adoption spreads beyond the first user.
Conclusion
The shift from dashboards to conversational analytics is not about replacing the tools you have. It’s about closing the gap between having data and being able to act on it.
Marketing leaders who can ask their data questions directly, in the moment a decision needs to be made, operate at a different speed than those still waiting on Wednesday’s report. The question gets answered. The decision gets made. The meeting moves forward with alignment instead of deferrals.
Dashboards show you what happened. Conversational analytics lets you ask why and get an answer before the meeting ends.
The capability is live. The architecture is mature. The barrier is no longer technical; it’s whether you take the first step.
Frequently Asked Questions
How is conversational analytics different from asking ChatGPT about my business data?
ChatGPT and similar general-purpose AI tools predict what your metrics probably say based on training patterns, they don’t connect to your live data. A purpose-built conversational analytics tool runs actual queries against your connected data sources and returns results, not predictions. If you paste a spreadsheet into ChatGPT and ask questions, you may get plausible-sounding answers that are factually wrong for your business. A governed analytics tool retrieves the actual number.
Do I need a data warehouse or engineering team to use conversational analytics?
No. Modern conversational analytics tools connect directly to your existing SaaS applications (your CRM, ad platforms, web analytics) through native integrations. You don’t need a data warehouse, a BI engineer, or a data modeling project. If your data lives in HubSpot, Salesforce, Google Ads, or GA4, you can connect and start asking questions within a day.
What happens if my marketing team and finance team define CAC differently?
The tool will return whichever definition is configured, and if definitions conflict, no one will trust the answers. Conflicting definitions are a governance problem, not a technology problem. Before you get value from conversational analytics, you need to standardize your core metric definitions across teams. Most tools include a semantic layer or metric library that enforces one definition per metric. Getting organizational agreement on those definitions is the prerequisite.
Can conversational analytics replace my dashboards entirely?
No, and it shouldn’t. Dashboards do the tracking job: showing the same metrics at the same cadence so the whole team stays aligned on what happened. Conversational analytics does the investigation job: answering ad hoc questions when a metric moves and you need to know why. Both capabilities belong in a modern analytics stack. Removing your dashboards would eliminate the shared scoreboard your team needs for alignment.
How accurate are the answers from conversational analytics tools?
Accuracy depends entirely on architecture. Tools where the LLM does the calculations – reading numbers, computing averages, generating results – will hallucinate. Sometimes close. Often not. Tools where the LLM only generates language based on actual query results are bounded by your data quality, not by the model’s guessing. Ask your vendor directly: does the LLM ever touch the math? If yes, the accuracy ceiling is lower than it should be.
What’s the best first question to ask when testing a conversational analytics tool?
Start with the question your analyst gets most often. Whatever recurring ad hoc request comes up in your weekly reviews like “what was traffic by channel last month?” or “how does this quarter’s MQL volume compare to last quarter?”, type that first. You’ll know immediately whether the answer matches what you’d expect, and you’ll build intuition for how the tool interprets plain-language queries.