


Table of contents
Did you know? Google Analytics powers a staggering 44 million websites worldwide! If getting insights from Google Analytics seems challenging, don’t worry— with pre-made and Google Analytics dashboard templates and custom dashboards, you can easily uncover the Google data that matters most.
Among the 300+ dashboard templates we offer at Databox, Google Analytics dashboards stand out as the most popular. We also provide templates for various other integrations, allowing you to track data across multiple platforms effortlessly.
We’re sharing the best Google Analytics 4 dashboard templates in this article, along with tips on how to create your own dashboard and track relevant metrics to understand your website performance better.
While dashboards help you monitor trends at a glance, many teams also need quick answers to specific performance questions without building a new report each time. Teams now use AI data analysts, like Databox MCP, to ask plain-English questions about their traffic, conversions, or engagement and get responses based on their actual GA4 data, definitions, and historical context. Instead of scanning multiple widgets, you can ask why performance changed, what drove a spike, or how a channel is trending, and get a clear explanation grounded in your real metrics.
Jump to the section you’re most interested in:
- What is a Google Analytics 4 Dashboard?
- How to Create a Google Analytics 4 Dashboard?
- How to Access a Google Analytics 4 Dashboard?
- 9 Best Google Analytics 4 Dashboard Examples and Templates
- Google Analytics 4 Dashboards to Grab Right Now
- The Only Google Analytics 4 Dashboard Tool You Need

What is a Google Analytics 4 Dashboard?
A Google Analytics 4 dashboard is a collection of visualizations showing your website data in a well-organized and digestible format.
These visualizations can display real-time data using a real-time widget or show historical data pulled automatically from your website through standard widgets such as charts, tables, maps, and cards. They give you a quick overview of your KPIs and relevant metrics over a specific period so you can take appropriate action to improve your performance or seize a growth opportunity.
Related: What Is Google Analytics 4 and How Will It Help My Reporting?
Why Are Google Analytics Dashboards Important?
Google Analytics dashboards are crucial for businesses to gain quick, actionable insights from their website data. They provide a visual representation of key metrics, allowing for easy identification of trends, patterns, and areas needing improvement. Dashboards help in:
- Saving time by consolidating important data in one place
- Facilitating data-driven decision making
- Tracking progress towards business goals
- Identifying areas of opportunity or concern quickly
- Improving communication of data across teams
With the right dashboard configuration, businesses can focus on the metrics that matter most to their specific goals and objectives.
How to Create a Google Analytics 4 Dashboard?
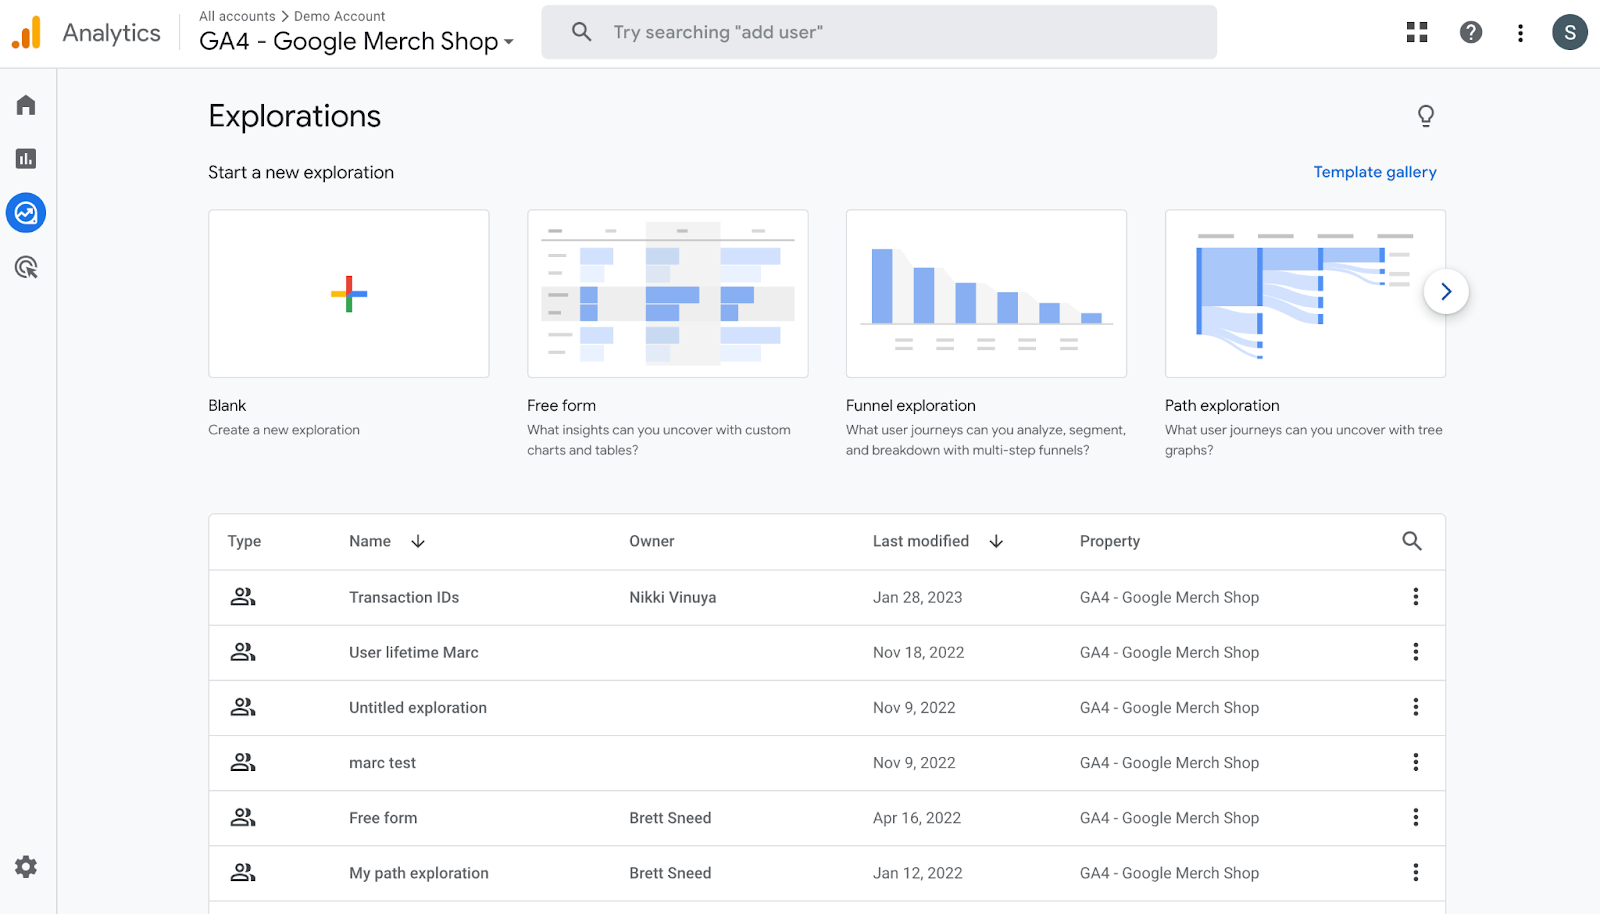
After logging into your Google Analytics account, navigate to the left menu and click on Explore. Here, you’ll find predesigned Explorations (custom google analytics dashboards) based on techniques like free form, funnel and path explorations, allowing you to start tracking data immediately.
GA4 also offers templates based on use cases (acquisition, conversion, etc.) and industries (eCommerce and gaming).
You can create a professional dashboard from scratch if you want more control over the metrics and dimensions to monitor. Click on Blank, and you’ll be taken to the software’s editor.
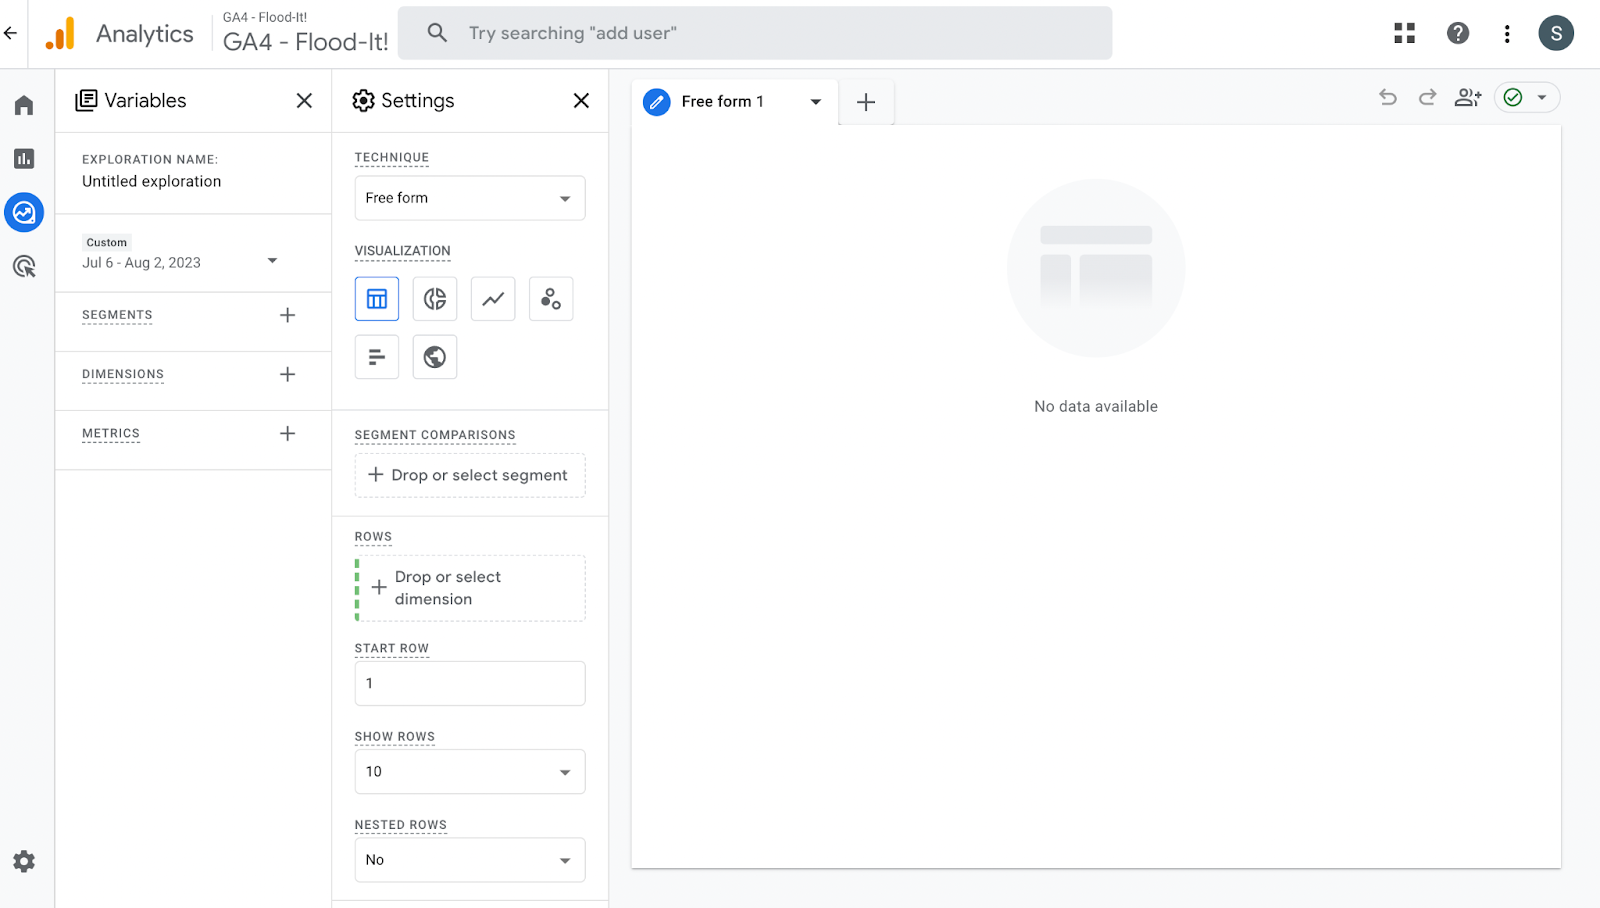
Select the audience segments you want to monitor along with the metrics and dimensions you want to track their behavior. Google Analytics 4 lets you customize your dashboards how you prefer – pick from 6 different visualization styles and change even the granular elements, like the number of rows/columns.
Best Practices for Dashboard Configuration and Visualization
To create effective Google Analytics dashboards:
- Define clear objectives for each dashboard
- Choose relevant metrics that align with your business goals
- Use appropriate visualization types for different data sets
- Ensure dashboards are easy to read and interpret
- Regularly review and update dashboards to maintain relevance
Remember, the goal is to create dashboards that provide actionable insights, not just data dumps.
PRO TIP: Save Time Creating Your Google Analytics 4 Traffic Dashboard
Yes, you can DIY in Google Analytics 4, but what if you would prefer a simpler, easier route? After all, once you learn how it’s done, you still have to choose the right metrics and design your custom dashboard to answer the important questions your stakeholders have, for example:
- How many people are visiting my website?
- Which channels bring in the most users?
- How engaged are my users?
- How well is my website keyword optimization performing?
and more…
Now you can benefit from the experience of Google Analytics experts, who have put together a great Databox template showing all the most important website traffic KPIs. This template allows for easy integration with scheduled report delivery. It’s simple to implement and start using as a standalone dashboard or in marketing reports!
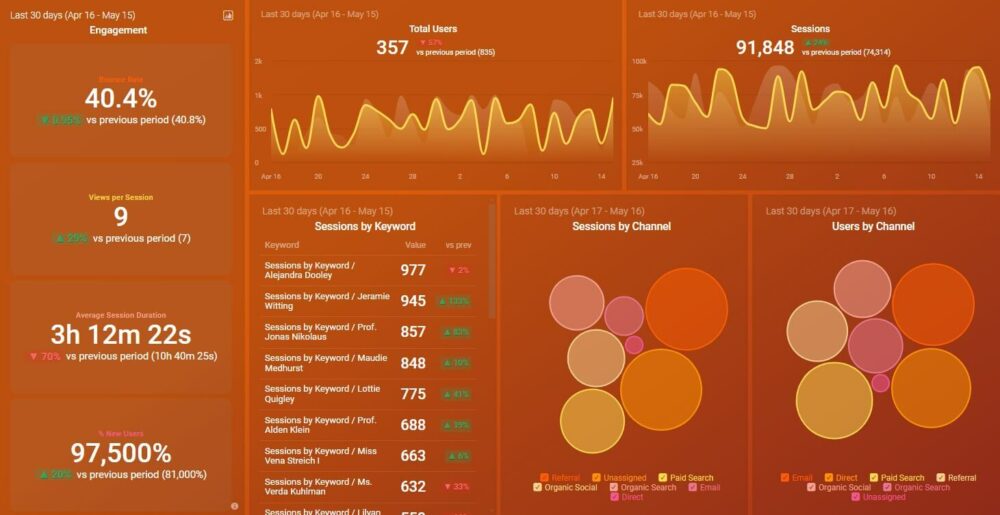
You can easily set it up in just a few clicks – no coding required.
To set up the dashboard, follow these 3 simple steps:
Step 1: Get the template
Step 2: Connect your Google Analytics 4 account with Databox.
Step 3: Watch your dashboard populate in seconds.
How to Access a Google Analytics 4 Dashboard?
To access an existing Google Analytics dashboard template, head over to the Explore tab. Below the templates, you can see all the explorations you’ve created, including their type, name, owner, last modified, and property. This dashboard live setup ensures your dashboard displays stay updated and fixed with the latest data.
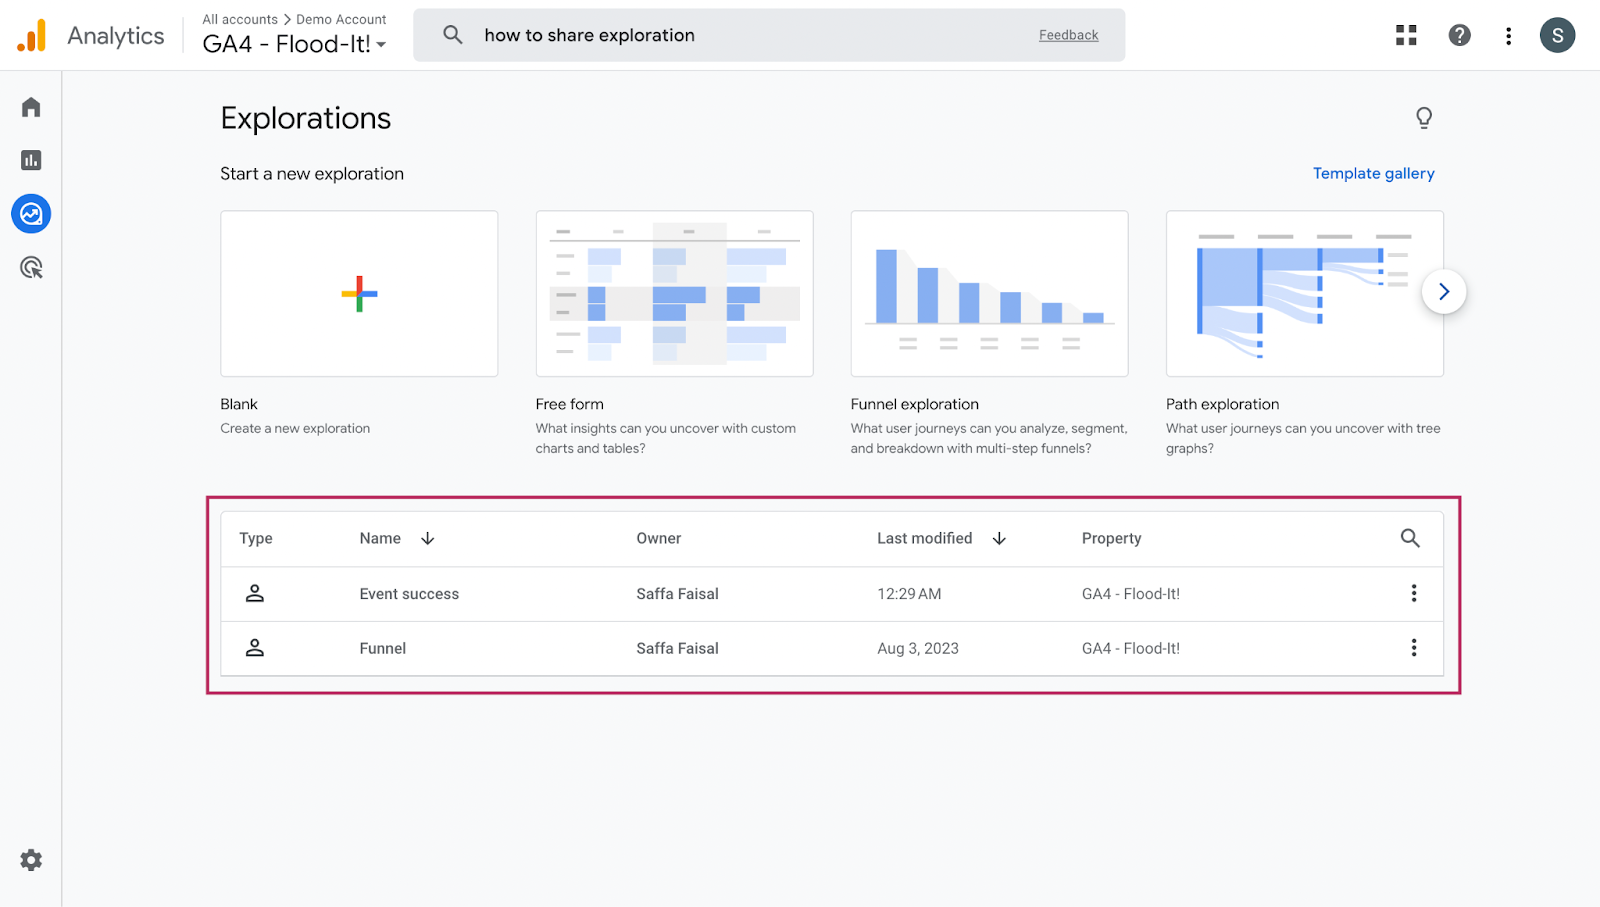
For sharing the dashboards with colleagues, click on the three vertical dots on the right and then proceed by clicking on Share from the dropdown menu.
To share an exploration, one must have at least the Analyst role in the property. It’s important to note here that any team member having the Viewer role can’t edit the dashboards. For the latter, they must duplicate or copy it.
Related: How to Share Custom Reports, Dashboards, and Template Links in Google Analytics with Others
How to Share and Import Analytics Dashboards
Sharing and importing dashboards in Google Analytics 4 can greatly enhance collaboration and efficiency. To share a dashboard:
- Open the dashboard you want to share
- Click on the “Share” button in the top right corner
- Enter the email addresses of team members you want to share with
- Set appropriate permissions (view, edit, etc.)
- Click “Send” to share the dashboard
To import a dashboard:
- Go to the Dashboards section
- Click on “Create” and select “Import from Gallery”
- Browse available dashboards or enter a URL if you have one
- Select the dashboard you want to import and click “Import”
Remember to customize imported dashboards to fit your specific needs and data structure.
9 Best Google Analytics 4 Dashboard Examples and Templates
If creating Google Analytics 4 dashboards feels overwhelming, you can take advantage of the platform’s pre-built reports with data already populated. These reports offer a great starting point, and you can easily add filters to dive deeper into specific metrics.
All these reports are accessible in the ‘Reports’ tab. In this guide, we’ll showcase nine popular examples to help you effectively track your website’s performance.
Additionally, we’ll introduce alternative options available in Databox. Databox’s GA4 digital dashboards are quick to set up and, unlike GA4’s more limited customization options, allow you to easily add or remove metrics and fully customize the dashboard’s appearance.
- Traffic Acquisition Report
- Acquisition Overview Report for Executives
- User Acquisition Report
- Landing Page Report
- Organic Search Acquisition Report
- Organic Social Acquisition Report
- E-commerce Purchases Report
- Tech Details Report for Mobile Devices
- Conversion Report
1. Traffic Acquisition Report
This Google Analytics report provides valuable insights into your website visitors, including where they come from, how engaged they are, and whether they convert. By analyzing this data analytics report, you can pinpoint your most effective traffic sources in terms of visitor quality and engagement and use dashboard displays to gain a fixed view of performance.
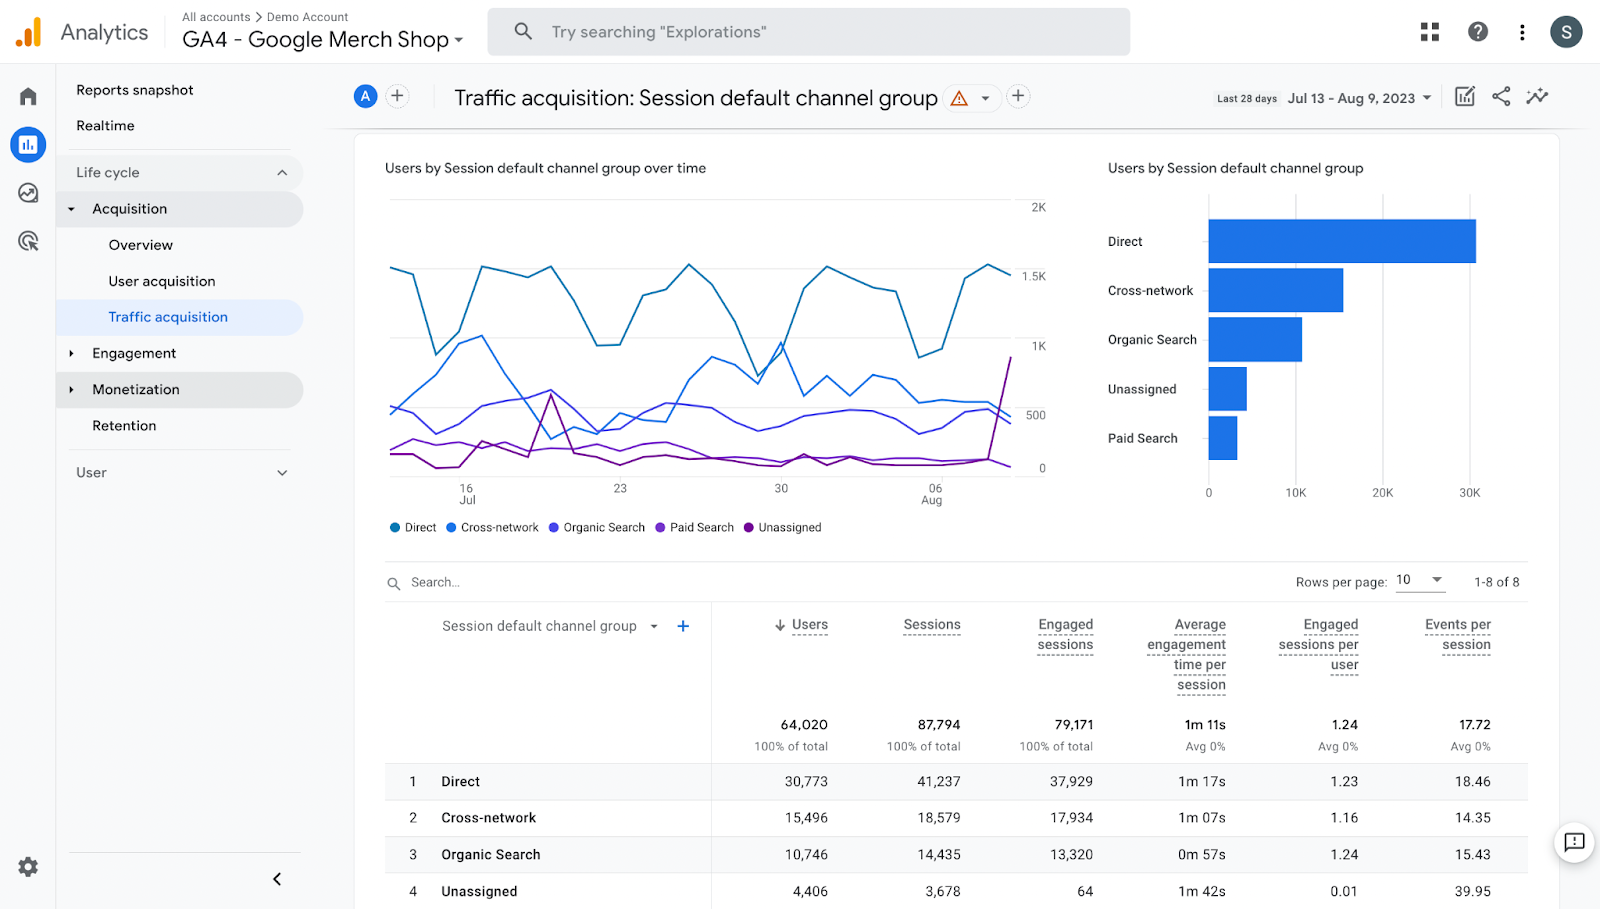
How to access this Google Analytics 4 dashboard?
Reports > Acquisition > Traffic acquisition
How to read this Google Analytics 4 dashboard?
Monitoring traffic from different sources and analyzing user behavior helps you evaluate the effectiveness of your marketing efforts. With the Traffic Acquisition Report, you can answer key questions such as:
- Which traffic source brings in the most users?
- Is the number of users increasing or decreasing over time?
- How many users engage with the website’s content?
Related: 15 Tips for Setting Realistic Website Traffic Goals
2. Acquisition Overview Report (Perfect for Busy Executives)
While accessible to everyone, busy executives gain the most from this GA4 dashboard. It provides a high-level snapshot of essential metrics like the number of new users, users by traffic source, customer lifetime value (LTV), and more—crucial for decision making.
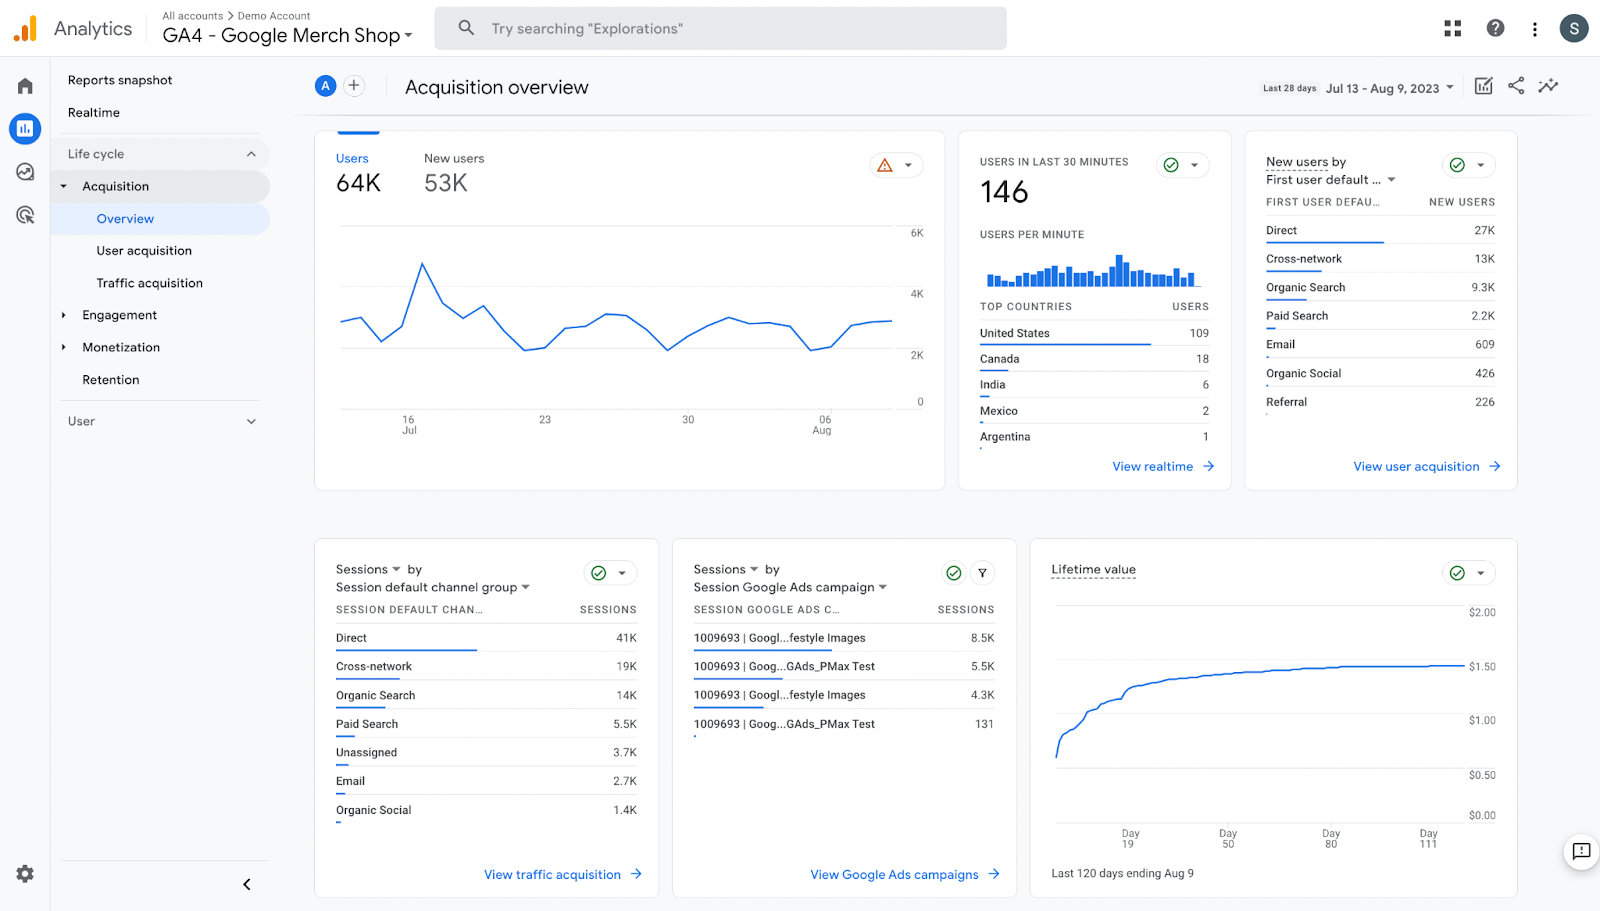
How to access this Google Analytics 4 dashboard?
Reports > Acquisition > Overview
How to read this Google Analytics 4 dashboard?
The metrics displayed in this report will help you answer these questions:
- Which traffic source brings in the maximum number of new users?
- Which country brings in the most sessions?
- Has the customer lifetime value increased after the introduction of a new feature?
Related: Executive Reporting: Management Reporting Best Practices & Report Examples
3. User Acquisition Report
To gain deeper insights into the audience your website is attracting, the User Acquisition Report in Google Analytics 4 is essential.
The Analytics user acquisition report lets you see which traffic sources bring in new users, how many of those users convert, and how long they stay engaged on your website. A key advantage of this report is the ability to add different dimensions, such as country, gender, and device type, to gain more granular insights using summary cards in your custom dashboard report.
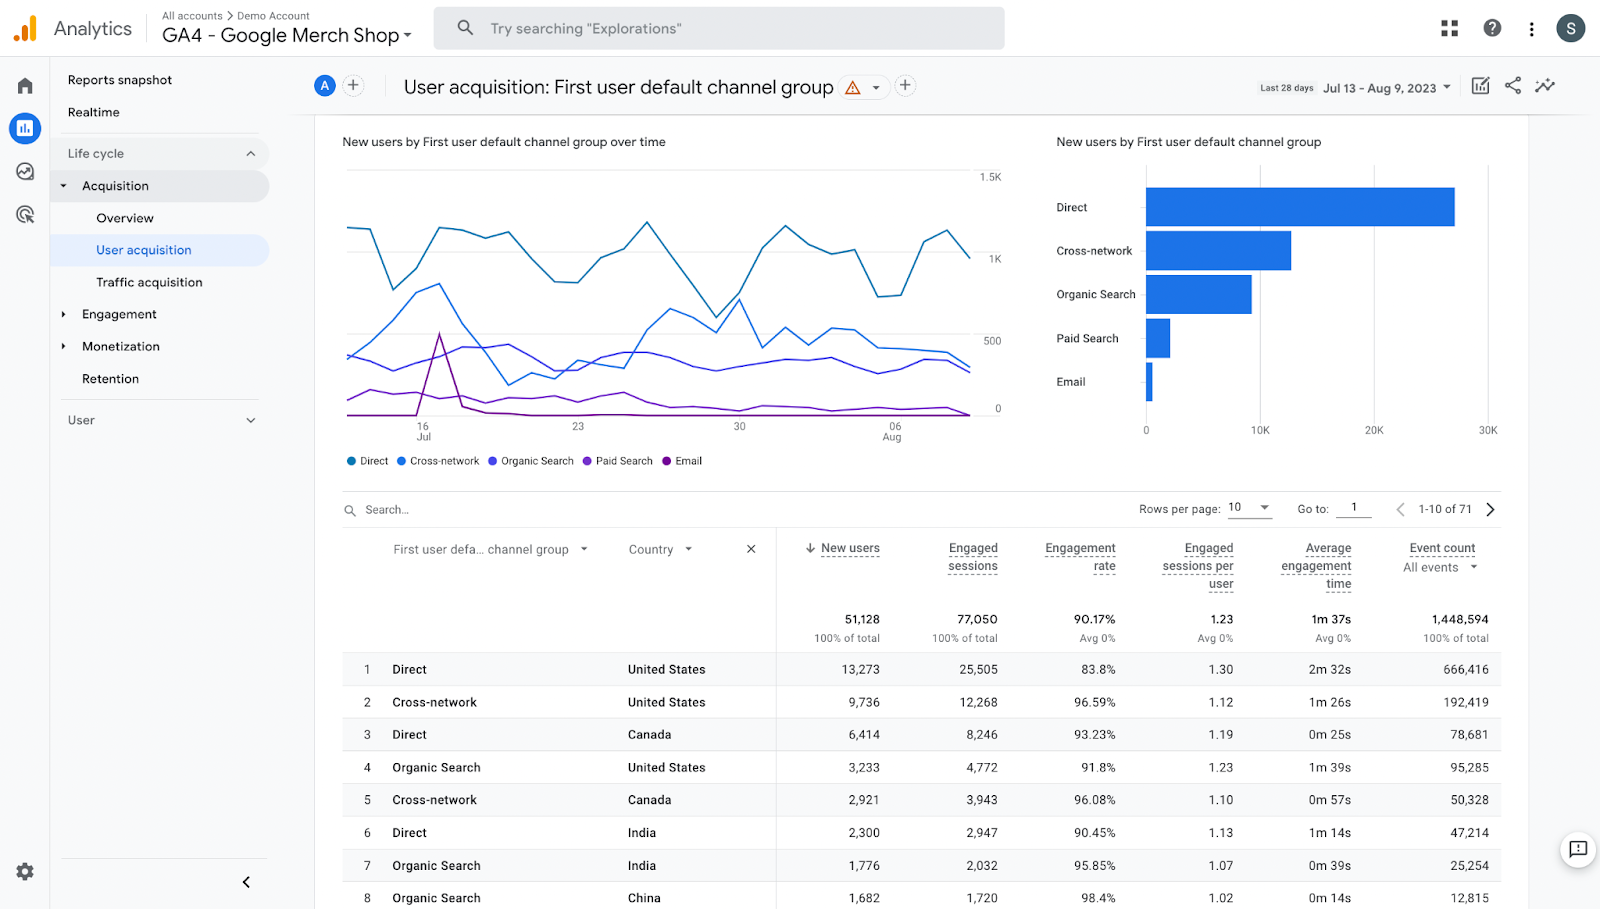
How to access this Google Analytics 4 dashboard?
Reports > Acquisition > User Acquisition
How to read this Google Analytics 4 dashboard?
By monitoring the user acquisition report, you will answer these questions:
- What demographics of users are coming to your site?
- How long do visitors stay on your site?
- What’s the average engagement rate across your website, and how does it change?
Want our no-code dashboard in Databox instead? Grab the Google Analytics 4 Acquisition Overview Dashboard below to get actionable information about people who visit your website and customize the report by adding the metrics that matter to you the most.

4. Landing Page Report (Landing Page Dashboard)
The Landing Page Report will be your landing page dashboard for your website in Google Analytics and it showcases your best-performing pages based on sessions, engagement, goal conversions, and total revenue. By monitoring this Google Analytics dashboard, you can identify which pages are most effective at driving user engagement and conversions, and which pages may need optimization.

How to access this Google Analytics 4 dashboard?
Reports > Engagement > Landing page
How to read this Google Analytics 4 dashboard?
Track metrics like the number of users, average engagement time per session, and total revenue to answer some burning questions:
- What are your site’s most popular pages?
- Which pages lead to goal completions?
- Which pages have high engagement but low conversions/revenue?
Related: Content Marketing Reporting: Best Practices and Tools for Building Great Reports
5. Organic Search Acquisition Report
SEO is a long-run game, which means you need to revisit your pages regularly to ensure they’re still driving traffic and conversions. The organic search acquisition dashboard allows you to monitor your SEO efforts and learn how well your content is ranking and if it’s bringing quality visitors to your website organically.

How to access this Google Analytics 4 dashboard?
Reports > Acquisition > Traffic acquisition > Add filter > Session default channel group > Exactly matches match type > Organic search > Apply
How to read this Google Analytics 4 dashboard?
By tracking the metrics on this dashboard, you’ll be able to answer some of these questions:
- Which landing pages bring in quality organic visitors?
- What country is responsible for the most organic searches?
- Are conversions via organic search increasing or decreasing over time?
You can get a more comprehensive and easily adjustable dashboard report in Databox. Simply download this Google Analytics 4 SEO dashboard to view all of the most relevant metrics and adjust them to your reporting needs, from custom date ranges to scheduled snapshots.

Related: How Virayo Uses Databox to Build SEO Reports (& Custom Metrics) to Visualize ROI for Clients
6. Organic Social Acquisition Report
Are your social media platforms contributing to your brand? With this organic social acquisition dashboard, you can learn which platforms generate the most traffic for your website, where your high-quality visitors come from, and whether they convert.
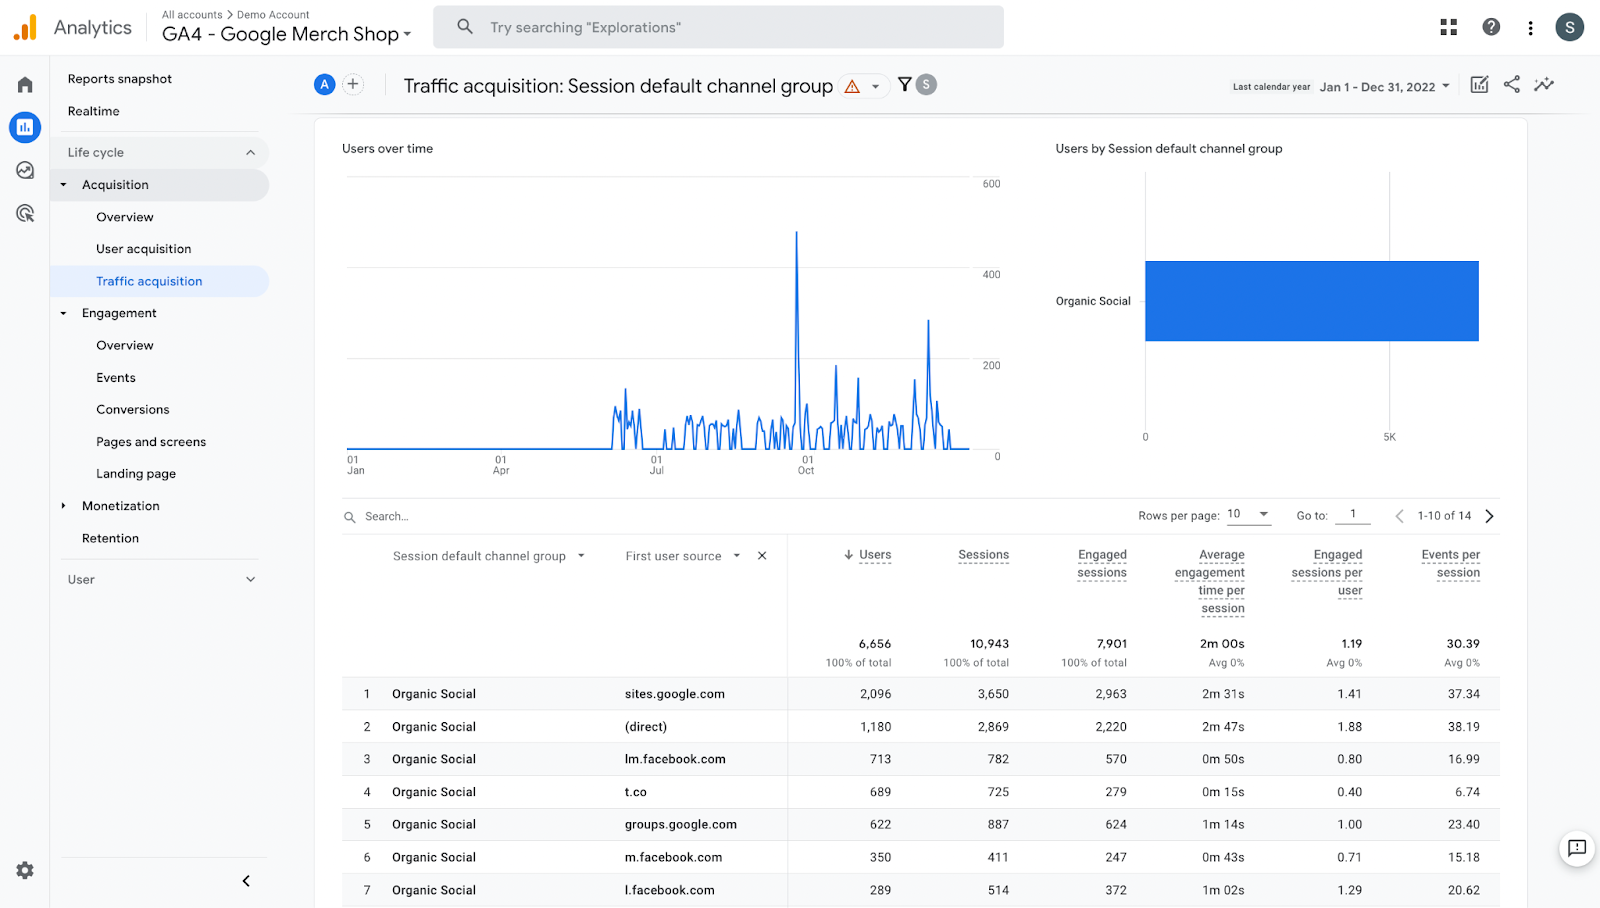
How to access this Google Analytics 4 dashboard?
Reports > Acquisition > Traffic acquisition > Add filter > Session default channel group > Exactly matches match type > Organic social > Apply
How to read this Google Analytics 4 dashboard?
Monitoring metrics like user acquisition from social, traffic from social sources, and conversions from social platforms will answer:
- Which social platforms bring in the most users and sessions?
- Which social networks lead to visitors that actually complete goals?
- Which social networks drive visitors that spend time on your site?
Just like the organic search acquisition report, this dashboard requires you to manually add dimensions to get the most insights. You’re better off grabbing the Social Media Dashboard to easily measure the actions users take after clicking through to your website from social media and redirect your efforts toward your most valuable source.

Related: 50+ Social Media Statistics That Will Take Your Marketing Campaign to the Next Level
7. E-commerce Purchases Report
To optimize your e-commerce marketing strategy, you need to learn about your customers’ purchasing habits and interests. The e-commerce purchases report examines the revenue by product item, popular items, and abandoned products. Monitoring this report will help you execute relevant strategies to increase purchases.
For instance, if you notice a substantial number of abandoned carts, you can trigger an email sequence reminding visitors of their carts and offering them discounts to prompt purchases.

How to access this Google Analytics 4 dashboard?
Reports > Monetization > Ecommerce purchases
How to read this Google Analytics 4 dashboard?
Tracking this Google Analytics 4 dashboard will help you answer these questions:
- Which products have a high cart abandonment?
- How many products do visitors usually buy?
- How can I make each visit more profitable?
Related: 8 Essential Ecommerce Google Analytics Dashboards Recommended by E-commerce Experts
8. Tech Details Report for Mobile Devices
Creating an excellent user experience on mobile is a must, and it needs constant monitoring to ensure all pages are mobile-friendly. This Google Analytics 4 dashboard tells you if your website on mobile devices prompted users to take the desired action and gives additional insights, like engagement time and event completions.

How to access this Google Analytics 4 dashboard?
Reports > User > Tech > Tech details > Add filter > Device category > Exactly matches match type > Mobile > Apply
How to read this Google Analytics 4 dashboard?
By monitoring this report on Google Analytics 4, you can learn the following:
- Which devices do your mobile visitors use?
- Do mobile users complete key actions on your site?
- How long do mobile users remain engaged on average on your website?
Want this dashboard in Databox instead? Grab the Google Analytics 4 Engagement Overview Dashboard below to measure the overall engagement of your website and app visitors, including mobile. Get insights into how visitors interact with your most important pages, their actions, and more.

Related: A Beginner’s Guide to Mobile Website Optimization
9. Conversion Report
The conversion report in Google Analytics 4 provides you with detailed data on event completions (including purchases) and shares the number of users who completed each event.
By applying additional dimensions, you can find out which channels have the best event completion rates, the ages and locations of visitors who completed goals, and what pages drove the most event completions.
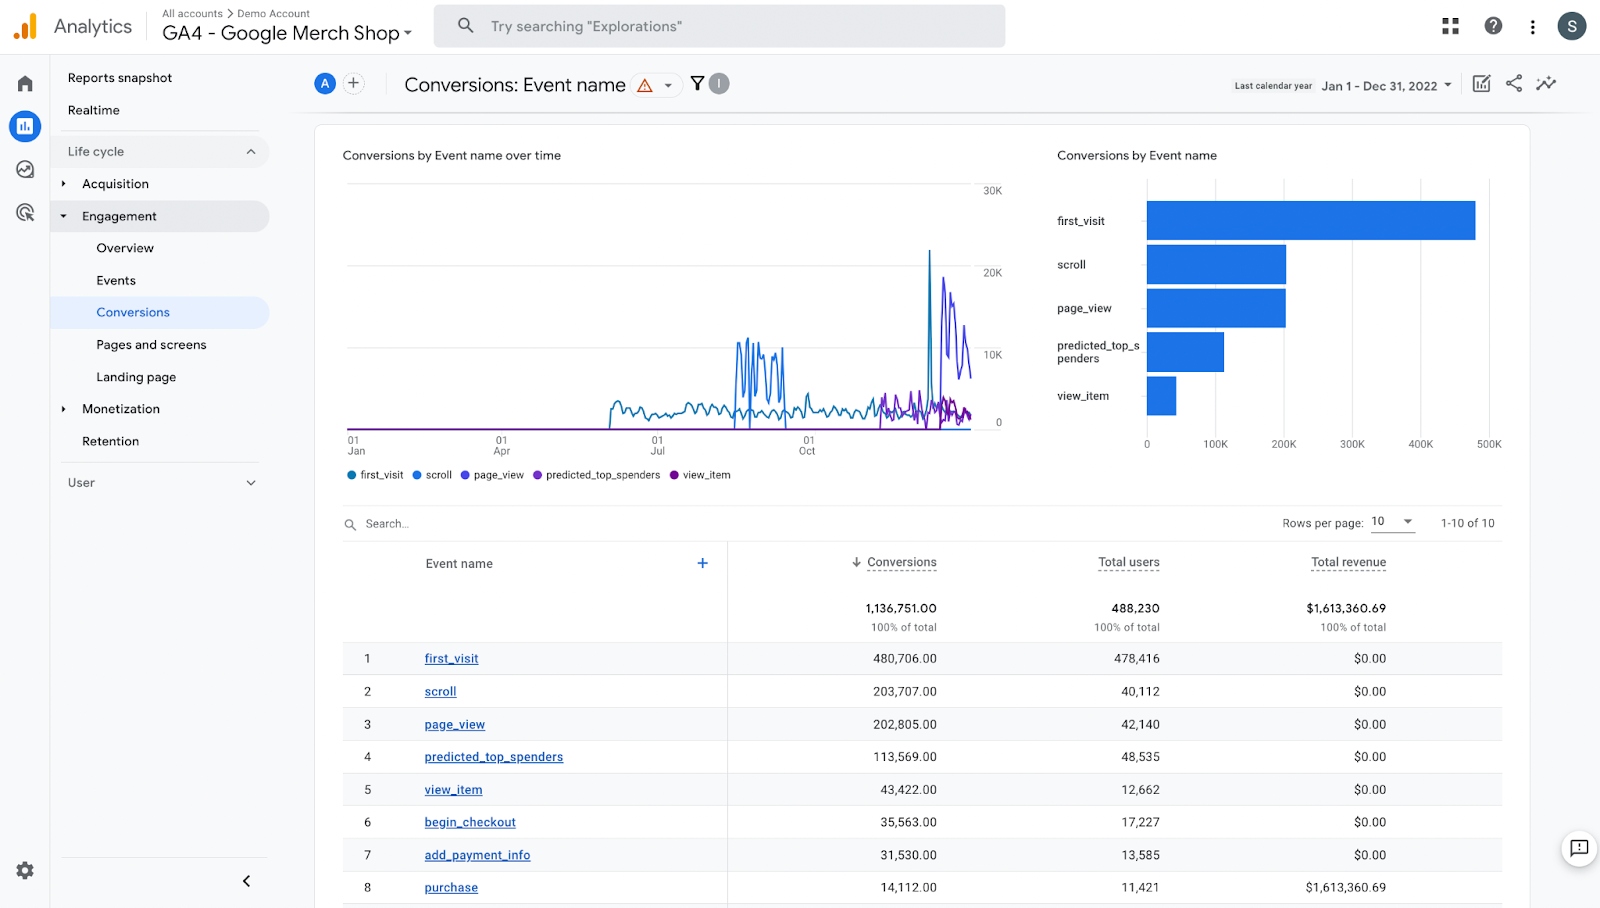
How to access this Google Analytics 4 dashboard?
Reports > Engagement > Conversions
How to read this Google Analytics 4 dashboard?
Monitoring the conversions report in Google Analytics 4 answers the following questions:
- Which channels generate the most leads/sales?
- Which pages generate the most leads/sales?
- What age groups are most likely to convert?
- What time of day are users most likely to convert?
Want this dashboard in Databox instead? Grab the Google Analytics 4 (Conversion Report: Goals Overview) below to easily track your website’s goal completions and conversion rates.
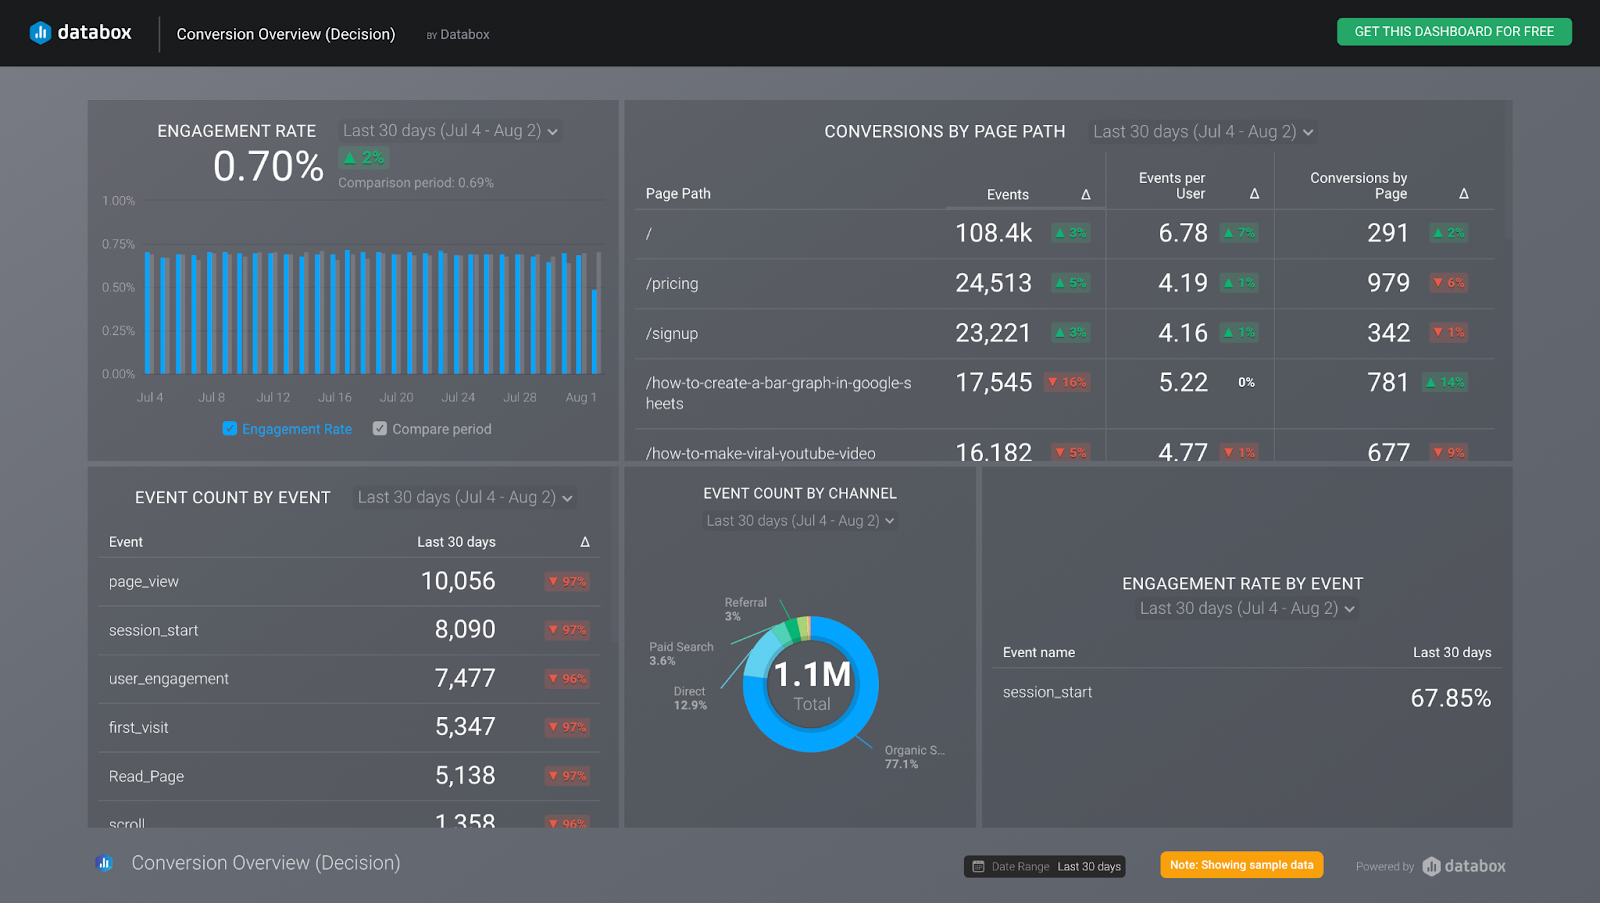
Related: How to Improve Your Business Bottom Line By Setting Goals and Alerts in Databox
10. Bonus: 3 Combined Google Analytics Dashboards You’ll Love
You’ve seen examples of Google Analytics 4 dashboards to track your website performance, but what if you need even more insights?
Databox makes GA4 reporting simple with templates that integrate data from popular tools like HubSpot, Shopify, and Facebook. Here are three GA4 dashboards you can start using today:
• Email Marketing Analytics Dashboard: Track email performance, including sessions, signups, and conversions. Browse more email marketing dashboards here.
• PPC Analytics Dashboard: Get a complete view of your ad performance by integrating data from Facebook Ads, Google Ads, and GA4. Browse more PPC dashboards here.
• Online Sales Analytics Dashboard: Monitor e-commerce metrics with a dashboard combining Shopify, Facebook, and GA4 data. Browse more e-commerce dashboards here.
These dashboards seamlessly integrate your favorite tools, giving you a comprehensive view of your marketing and sales efforts.
The Only Google Analytics Dashboard BI Tool You Need
A clean desk allows you to focus on your tasks and doesn’t distract you from coming up with the best possible solutions for your challenges.
The same goes for your dashboards and reporting. Why scatter your attention around when you can monitor all important metrics and KPIs in one place instead of jumping from one screen to another 20 times within a single minute?
A clean, organized overview of your performance helps you identify issues more easily and act promptly. A messy analytics dashboard (or several overcomplicated, overcrowded dashboards) will likely lead to missed opportunities and issues caught too late.
With marketing reporting software like Databox, you can have access to:
- A simple, automated reporting process
- 500+ templates to choose from when you don’t have time to build dashboards from scratch, including multiple Google Analytics 4 dashboards
- The possibility to build and customize dashboards to fit your needs
- Integrations with your favorite analytics tools and the ability to pull data from 100+ sources (Google Analytics 4, HubSpot, Shopify, etc.) for deeper and more actionable insights
That sounds about right—the best way to streamline your data monitoring and reporting and make time for more meaningful actions that lead to business growth.
Don’t waste another second, sign up for a free trial today.
FAQ
Databox is a Business Intelligence (BI) platform known for its ease of use, data integration, and customizable dashboards. It simplifies Google Analytics 4 (GA4) reporting by offering pre-built templates, cross-platform data blending, and drag-and-drop dashboard creation—no coding required.
With Databox, you can quickly connect GA4, visualize key metrics like traffic, engagement, and conversions, and create unified reports by combining data from tools like HubSpot, Facebook Ads, and Google Ads. This makes it easier to build executive-ready dashboards that deliver actionable insights and streamline your GA4 analysis.
Google Analytics 4 dashboards provide quick, actionable insights into website performance. They help you:
Save time by consolidating key metrics in one place.
Track progress toward business goals.
Identify growth opportunities or areas that need improvement.
Improve communication across teams by providing a clear, visual representation of your data.
To create a dashboard in Databox:
Log in to your Databox account and connect it to your Google Analytics 4 account.
Choose from pre-built templates or create your own custom dashboard by selecting relevant metrics from GA4.
Customize the dashboard with additional data from other platforms (Google Ads, HubSpot, etc.).
View the dashboard and track data or set up scheduled reports for automatic updates.
Yes! The E-commerce Purchases Report in GA4 provides detailed insights into product sales, popular items, and revenue. You can use Databox to integrate GA4 data with your eCommerce platforms (like Shopify), allowing you to track product performance, cart abandonment, and optimize sales strategies.
To integrate GA4 with Databox:
Connect your Google Analytics 4 account to Databox.
Choose from pre-made GA4 templates or create your own custom dashboards.
Add metrics and integrate data from other platforms such as Google Ads, HubSpot, and Shopify.
Review and analyze data across all platforms for actionable insights.
Databox provides several benefits for GA4 reporting:
reporting: Automatically updates your dashboards with the latest data.
Customizability: Tailor your dashboards to track the most relevant metrics for your business.
Integration: Combine GA4 data with other sources (e.g., HubSpot, Shopify) for a more comprehensive view of your marketing and sales performance.
Visualization: Turn raw data into easy-to-understand charts, graphs, and tables.
Ease of Use: Set up dashboards in minutes with no coding required.


