Table of contents
Ecommerce analytics help you understand what’s going on with your online store and make better business decisions. Best of all, you can get them in Google Analytics at no extra cost.
But, when you want to look at specific metrics only, most analytics platforms give you a lot to process at once.
An ecommerce dashboard with Google Analytics metrics refines the process for you so you can get the insights you need fast.
In this blog post, you’ll learn more about Google Analytics ecommerce dashboards and how to use them effectively. You’ll discover these topics:
- What Is an Ecommerce Analytics Dashboard and Why Do You Need One?
- What Does a Good Ecommerce Analytics Dashboard Look Like? 4 Characteristics
- 5 KPIs and Metrics to Include in Your Analytics Ecommerce Dashboard
- How to Set Up Your Google Analytics Ecommerce Dashboard
- 8 Ecommerce Google Analytics Dashboard Templates for Instant Insights

What Is an Ecommerce Analytics Dashboard and Why Do You Need One?
An ecommerce analytics dashboard is a group of visualizations based on your ecommerce store’s data. Most dashboards cover a specific goal or topic, such as traffic or audience behavior.
Ecommerce dashboards provide the following benefits:
- Efficiency: Dashboards save you time by showing you your most important metrics at a glance. They also make decision-making faster since you won’t have to wait on a report to get the relevant data.
- Better data literacy: Since dashboards make it easier for everyone to understand data, your team will be better able to draw conclusions from it regardless of skill level.
- More data deep dives: With only your most important data in focus, you’ll be better equipped to analyze your critical metrics in-depth.
- Easier communication: The clear and concise data visualizations on your dashboard present your findings clearly, leading to simpler communication and a higher chance of buy-in from stakeholders.
What Does a Good Ecommerce Analytics Dashboard Look Like? 4 Characteristics
Maximize the benefits you get from your ecommerce dashboard by following our dashboard best practices and tips to build a better dashboard. A good ecommerce analytics dashboard has these traits:
- Most important metrics first: Put your dashboard’s most important metrics in a prominent space or near its top.
- Visual cues and appeal: Use colors wisely to highlight highs and lows in your data. Choose appropriate visualizations for each of your metrics.
- Concise presentation: Keep your dashboard to only the metrics you absolutely need to draw conclusions related to its goals.
- Business goal relevance: Build dashboards around your main business goals and sub-goals.
PRO TIP: Get Useful, Actionable Data on Your Ecommerce Store’s Performance
To improve the performance of your online store, it’s vital to have access to useful and actionable data. But, with so many metrics available to track, it may be hard to determine which ones will actually help you move the needle.
That’s why we have created a concise dashboard template that only tracks the most important metrics for analyzing the core elements of your ecommerce businesses, such as:
- Transactions and orders. How many transactions does your online store process in a day, a week, or a month? How many orders, and how many were placed on the same day of the previous month?
- Sales volume and trends. See how much money has been generated from sales in the current month. Analyze daily trends to compare with your sales goals and take action to reach them.
- Website traffic trends. Track the number of new and returning visitors to your website and the number of individual sessions initiated by these users.
- Conversion to customers. See what percentage of your website visitors convert to customers.
- Revenue per customer. See how much revenue you get from each unique visitor that interacts with your store during a given time period.
- Amount per transaction. Track the average dollar amount each customer spends on a sale.
- Best-selling products. See your most popular products in terms of volume and revenue in a given period.
And more…
Now you can benefit from the experience of our Google Analytics 4 experts, who have put together a plug-and-play Databox template showing the most important KPIs for monitoring your online store’s performance. It’s simple to implement and start using as a standalone dashboard or in ecommerce reports!

You can easily set it up in just a few clicks – no coding required.
To set up the dashboard, follow these 3 simple steps:
Step 1: Get the template
Step 2: Connect your Google Analytics 4 account with Databox.
Step 3: Watch your dashboard populate in seconds.
5 KPIs and Metrics to Include in Your Analytics Ecommerce Dashboard
With all those best practices said, you still might not know what KPIs and metrics to start with. We consulted 20 Ecommerce experts about their thoughts on dashboards, 19 of whom use Google Analytics for their Ecommerce websites. They shared five key metrics with us:

- Conversion rate: Percentage of your visitors who buy an item (i.e. convert to becoming a customer)
- Shopping cart abandonment rate: Percentage of your visitors who put items in their shopping cart but don’t check out
- Average order value (AOV): Average cost of the orders your customers make
- Customer acquisition cost (CAC): Average cost of converting a visitor to a customer
- Customer lifetime value (CLV): Total average money a customer earns you throughout their time interacting with your company
All these metrics relate specifically to customer behavior at different points in their purchasing journey. They indicate how many customers want to buy, how much they want to purchase, and the overall value they bring to your store.
How to Set Up Your Google Analytics Ecommerce Dashboard
Before creating your ecommerce Google Analytics dashboard, set up your Google Analytics account for ecommerce tracking.
Then, sign up for an ecommerce reporting software like Databox and connect your Google Analytics account. Databox lets you connect your integration and choose your data source at the same time in this menu.

After you choose Google Analytics, you’ll decide what metrics to track on your dashboard. Your software may ask you to connect your account at this point, but Databox leaves that step for later.

From there, you’ll authorize your connection to Google Analytics using your login credentials. You’ll then choose the exact data source and view.

Congrats! You have a Google Analytics dashboard for your ecommerce store now.
8 Ecommerce Google Analytics Dashboard Templates for Instant Insights
We also asked 20 ecommerce experts about their top Google Analytics ecommerce dashboard templates. To help you understand their priorities here’s a little more information about them.
Nearly fifteen out of the 20 respondents use two to five dashboards, meaning they keep their data analysis varied but focused.

More than 15 of the 20 respondents agree that different businesses need different data dashboards, that customizable metric display is important, and that ecommerce is one of the most competitive industries.

Out of the experts who responded to our poll, 13 are store owners, and 7 work for agencies that serve ecommerce businesses. Ten of the total respondents manage single-brand stores, seven work at multi-brand stores, and three analyze data for marketplaces.
Now, let’s see what dashboard templates these ecommerce pros prioritize. You can find even more templates in our gallery of ecommerce examples.
- Ecommerce Overview
- Audience Overview
- Sales Performance
- Product Performance
- Customer Checkout Behavior
- Acquisition and Conversion
- Customer Shopping Behavior
- Email Campaign Performance
1. Ecommerce Overview Dashboard
“The most important Google Analytics dashboard for your eCommerce business is the eCommerce Overview dashboard,” says Maggie Simmons from Max Effect Marketing, a multi-brand agency. “This dashboard will show you the total number of visits, the number of new visits, total revenue, and total sales rank. These are all important metrics to look at and analyze so that you can determine if any changes need to be made or if other factors may be preventing your eCommerce business from reaching its peak potential.”
See these metrics in action in Databox’s Google Analytics (Ecommerce Overview) Dashboard Template.

It gives an overview of all your transactions, revenue, and visitors using these metrics:
- Transactions
- Total revenue
- Revenue by channel
- Revenue by visitors
- Users and sessions
- Ecommerce conversion rate
- Revenue per visitor (RPV)
- Average order value (AOV)
At a glance, you’ll understand how much money your store is making and how your visitors contribute to it.
Plus, using Databox’s drag-and-drop editor, you can change the order of your metrics or the visualizations you use. You can also include or exclude metrics as you see fit.
2. Audience Overview Dashboard
Ryan Stewart of Webris, a multi-brand agency says, “In my experience, the most important Google Analytics dashboard for eCommerce is the Audience Overview. This dashboard contains information about your visitors, the pages they visit on your site, and where they come from. It provides insights into how your customers behave, enabling you to decide how to improve your website.”
Stewart continues, “The metrics I see most often are bounce rate and average time on site. These metrics show me how users are interacting with my site—or not interacting!—and help me decide what steps I should take next in order to improve that interaction. The insights this dashboard provided were invaluable in helping me understand my customers’ behavior while on my site and where they went when they left it.”
Databox’s Google Analytics Audience Overview Dashboard uses metrics like the ones Stewart mentioned to help you understand your audience’s behavior. By understanding where your users and sessions are coming from, you’ll have a better idea of how to optimize your store accordingly.

It tracks these metrics specifically:
- Users
- Sessions
- New vs. returning sessions
- Sessions by affinities
- Page views
- Bounce rate
- Pages per session
- Average duration
- Sessions by country
- Sessions by device
Customize the color, metrics, and visualizations as you’d like to view your data the way you want.
3. Sales Performance Dashboard
Out of the Google Analytics dashboards Kurt Walker uses for Mill City Home Buyers, a single-brand store, “The most significant dashboard that is helping us is the Sales Performance dashboard,” Walker says.
“Sales is an integral aspect of the operations of an ecommerce website. We regularly have to monitor how our metrics are performing to keep an eye out for any irregularities. Some of the metrics we’ve included in our sales performance dashboard are Cost per Acquisition, Sales Conversion Rate, and Refund and Return Rate. The dashboard has provided us with several insights, such as the cost of doing sales or revenue generation trends,” Walker continues.
At RevenueGeeks, a multi-brand store, Elisa Bender counts on the same type of dashboard. “In my experience, the eCommerce Sales Performance dashboard proved to be the most important for my business. That’s because it allows me to see what products are more popular with the public and how well my company’s sales and profits are doing. As a result, I can develop targeted strategies to drive my sales up. It contains metrics like the number of customers, conversion rate, and profit margins,” Bender says.
Bender continues, “It gave me a deeper insight into the products that were being sold more and the type of customers who bought them. So, I could develop strategies that solely catered to this niche audience. What’s more, is that I was able to understand the different factors that increased my revenue. As a result, I could forecast future revenues and develop ways to boost them.”
Databox’s Google Analytics Ecommerce Sales Dashboard uses similar metrics to help you monitor your ecommerce sales. This template focuses on purchases, orders, and costs to give you critical revenue numbers.

All of its featured metrics include:
- Visits
- Percentage of visitors who buy
- Number of orders
- Gross revenue
- Session value by channel
- Shipping costs
- Revenue by source/medium
- Average order value
- Purchases by day of the week
If you’d like to use some of the metrics our experts mentioned using in their sales dashboards, drag and drop them using Databox’s Dashboard Designer. Add or replace whatever metrics you’d like to create a truly custom sales performance dashboard.
4. Product Performance Dashboard
Kyla Smith from Evolve Fit Wear, a multi-brand store, implements an ecommerce product performance dashboard in the store’s analytics. Smith says it contains the following metrics: “Product revenue, unique purchases, average price, product refund amount, cart-to-detail rate, and buy-to-detail rate.”
“This dashboard helps give insights into which products are the best-sellers,” Smith says. “With this information, I can optimize my site to showcase these products on the homepage and through email marketing campaigns to potentially increase my sales. Secondly, it helps me understand which products are underperforming so I can either mark down the prices on those products or create a new collection to try and give customers more exposure to them.”
The Google Analytics Product Revenue Dashboard Template for Databox achieves similar goals.

It lists revenue by product alongside metrics that add context like transactions and AOV. Here’s the full list of included metrics:
- Revenue by product
- Sessions
- Revenue by device
- Revenue by source/medium
- Ecommerce conversion rate
- Transactions
- Average order value
- Revenue per visit
Move the metrics around however you’d like in Databox’s drag-and-drop interface to put them in an order that makes sense to you.
5. Customer Checkout Behavior Dashboard
What’s the top ecommerce Google Analytics dashboard for Jeffrey Aspacio at RedLettersPH, a single-brand agency? “It’s the Customers Checkout Behavior report, with Enhanced Ecommerce configured,” Aspacio says.
Aspacio explains, “This report contains the checkout steps and the metrics that are tracked include session drop-offs for each step and events were set up to track errors encountered by users in any step of the checkout funnel. This tracks a metric called the “error rate”, making sure this decreases over time. The type of error is pushed to the event label in Google Analytics’ Top Events report. When a certain error type is persistent, recommendations are provided to the developers to investigate and resolve the issue.”
Track your customer checkout journey with Databox using the Google Analytics (Ecommerce: Checkout Behavior) template. It displays each stage of checkout in a pipeline to show you where bottlenecks happen.

You’ll monitor these metrics:
- Conversions in the information, shipping, payment, and transaction phases of checkout
- Information dropoff
- Shipping dropoff
- Payment dropoff
Databox can also display other forms of data in a pipeline or funnel for other ecommerce situations, such as in the marketing to sales funnel. Choose the “Funnel” or “Pipeline” visualization from the Dashboard Designer’s Visualization Types category.
6. Acquisition and Conversion Dashboard
Jared Hendricks from Feruo, a single-brand store, is a self-proclaimed “religious Google Analytics user.” Hendricks vastly prefers Universal Analytics (UA) over the upcoming Google Analytics 4 (GA4) and uses an acquisition and goals conversion dashboard based on UA.
“Here, I can set up predefined rules and see what customers I am getting, and from where. I utilize UTM tags to determine which marketing efforts are bringing me the most valuable customers. I also check the steps customers are going through and combining that with heatmaps (MS Clarity) I can determine what necessary changes/improvements I should make in the landing page to drive the max sales,” Hendricks explains.
“The latest GA4 does not have this level of user behavior tracking in goal conversion so far and it is truly disappointing. This I believe is the single most important dashboard every ecommerce store should religiously implement to remove any friction from their customer acquisition process,” Hendricks adds.
If you want to track where user acquisition happens in your marketing, try the Google Analytics Acquisition Snapshot Dashboard Template. This dashboard tracks traffic sources, page performance, and keyword performance to offer a comprehensive view of your acquisition points.

Check out the full list of metrics:
- Direct traffic
- Sessions by source
- Bounce rate
- Percent of new sessions
- Sessions by source
- Sessions by social networks
- Organic keywords
- Paid keywords
Do you also consider GA4 difficult to use? As you get ready for the full switch, our Google Analytics 4 Acquisition Overview Dashboard Template will lend a hand. It monitors user numbers to help you connect visitor trends with revenue trends.

This dashboard includes all of these metrics:
- Total users
- New users
- 1-day active users
- 7-day active users
- 28-day active users
- Users by country
- Users by source
- Total revenue
- Total revenue by user
Databox offers plenty more GA4 templates, all of which you can customize as you wish. The Databox GA4 integration gives you access to all your most important GA4 metrics in one place to help you adjust to the new platform.
7. Customer Shopping Behavior Dashboard
“The Google Analytics dashboard that proved to be most important for our business would be Customers’ Shopping Behavior,” says David Lee from Neutypechic, a single-brand store. “ This provides us with a quantitative measure of why individuals choose to shop at our store. It allows us to understand the motivations of consumers and what eventually impacts their buying decisions. This allowed us to fill gaps in the marketplace and identify required products before they run out.”
Lee continues, “A customer shopping behavior contains the following metrics:
- Types of customers
- Dwell time
- Types of purchases
- Number of returning customers
- Website traffic patterns
It provides our business with insights such as what products consumers are interested in and whether they are first-time buyers or repeat customers. Once we have these insights, an informed decision can be made.”
The Google Analytics (Ecommerce: Shopping Behavior) template for Databox takes a slightly different approach to tackle the same goal. It displays a pipeline of sessions that progress through the shopping experience to show how far your customers typically get.

This template displays the following metrics:
- Pipeline with all sessions, sessions with product views, sessions with cart additions, sessions with checkouts, and sessions with transactions
- Shopping activities
- Cart additions
- Cart abandonment
- Checkout abandonment
If you’re looking for a dashboard with more of the metrics David Lee mentioned, feel free to start one from scratch or modify this template by dragging and dropping your preferred data.
8. Email Campaign Performance Dashboard
“As a CEO, I have released and worked on many long-term campaigns for our company. I have noticed that email campaigns are becoming a more efficient and effective way to communicate and engage with our customers. That’s why Email Google Analytics eCommerce Dashboard is my favorite dashboard for 2022,” says Chris Walker of Legiit, an online marketplace.
Walker continues, “The dashboard gives us a performance report for the email campaign that we launch while providing a bounce rate for the traffic from the email campaign. Importantly, it shows us the revenue from the email campaign which helps us track our progress so that we can meet the objectives of our company. The dashboard has helped us gain insights that we can use to improve our strategies so that we can focus on increasing our sales and monitoring how our resources are being used.”
Databox’s Google Analytics Email Marketing Dashboard Template analyzes email performance in a variety of contexts, including ecommerce. It tracks what email campaigns sessions come from and how many sessions come from your email campaigns overall.
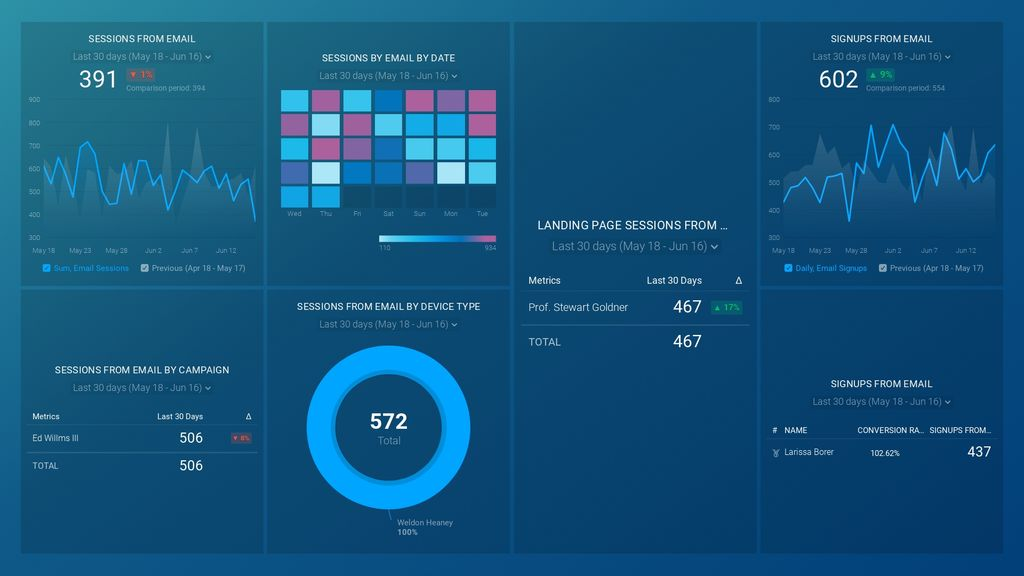
You’ll see all of these metrics on this dashboard:
- Sessions from email
- Sessions by email by date
- Sessions from email by campaign
- Sessions from email by device type
- Landing page sessions from email
- Signups from email (graph)
- Signups from email (table)
If you consider email an important pillar of your marketing strategy, you’ll also discover many more email marketing templates for Databox, including ones with Google Analytics metrics.
Monitor Your Online Store’s Performance in Databox
Databox has a low barrier to entry so business owners of any skill level can analyze their metrics right away. It has a free forever plan perfect for users focused on a few data sources. Plus, the easy-to-use Dashboard Designer and templates make anyone a pro at creating their own dashboards.
Since it’s so easy to use Databox, it’ll become easier and faster to look at the Google Analytics metrics that matter most to your store. Sign up for free today.