


Table of contents
Business intelligence reporting is a highly sought-after set of skills in the data industry. In fact, we surveyed dozens of analysts and business intelligence professionals and found that when analyzing business challenges, more than 50% of companies still lean on qualitative data, instead of quantitative business reporting (through BI dashboards).
According to Databox’s State of Business Reporting, most companies stated that regular internal monitoring and reporting improved progress monitoring, increased team effectiveness, allowed them to identify trends more easily, and improved financial performance.
How can business intelligence reporting help your business? In short:
- Improve decisions and business performance. For example, a manager might notice that their team’s performance has fallen behind its KPI target for two consecutive quarters. They could then use this information to perform additional analysis such as reviewing sales forecast accuracy and productivity reports.
- Have a single source of truth – A big part of the job of a BI tool is to organize data in a single place so that everyone can access it whenever needed. This way, you become aware of important information and keep track of developments within the company. You might not be able to react immediately to certain situations, but this is crucial for long-term planning and management.
If you want to make your business smarter in the decade of constant changes then you should definitely consider implementing business intelligence reporting.
In this article, we’ll look at the definition of BI reporting, why it’s important for any business, and some of the best practices for creating a successful business report.
- What Is Business Intelligence (BI) Reporting?
- Why Is BI Reporting Essential for Any Business?
- Benefits of Business Intelligence Reporting
- Business Intelligence (BI) Reporting Examples
- How to Create a Business Intelligence Report
- Business Intelligence (BI) Reporting Best Practices
- Transform Data into Business Insights with Databox
What Is Business Intelligence (BI) Reporting?
BI reporting or business intelligence reporting is a business solution that enables you to analyze your company data in an organized, accurate, and streamlined manner in order to find actionable insights. In simpler terms, you can view the data collected and organized via your BI tool in one place, allowing you to monitor trends and spot patterns that can help you improve your decision-making process.
Ultimately, making better (data-driven) decisions, will allow you to develop more profitable results.
Why Is BI Reporting Essential for Any Business?
Tied into the broader topic of business intelligence, business intelligence reporting helps make sense of data.
As a result, BI reporting is considered an essential component in any organization’s overall BI strategy. There’s no doubt that business intelligence (BI) reporting plays a critical role in the success of most organizations. Whether it’s tracking stock market trends or project management performance, BI reporting is the foundation for making informed decisions.
Some of the main reasons why companies reach for business intelligence data reporting are:
- Monitor KPI trends. Reports help users track KPIs over time and spot problems before they become expensive issues.
- Improve resource efficiency. Highlight opportunities to optimize resources and provide early warning of impending problems or trends in performance.
- Optimize departmental performance. Supervise current department processes in real-time and figure out if you need to make any adjustments.
- Perform better competitive analysis. Keep track of the trends in your industry so that you can stay ahead of the game. Without competitive intelligence, it’s easy to get caught flat-footed by your competition’s moves.
- Make better revenue predictions. A BI report can take the data from sales reports and inventory management reports and produce a revenue forecast.
Truly, BI reporting tools not only help in analyzing the data but also help in creating new reports as and when required. It is essential for organizations to run reports at regular intervals in order to make business decisions based on facts and figures. The operational data should be analyzed in order to make the right business decisions at right time.
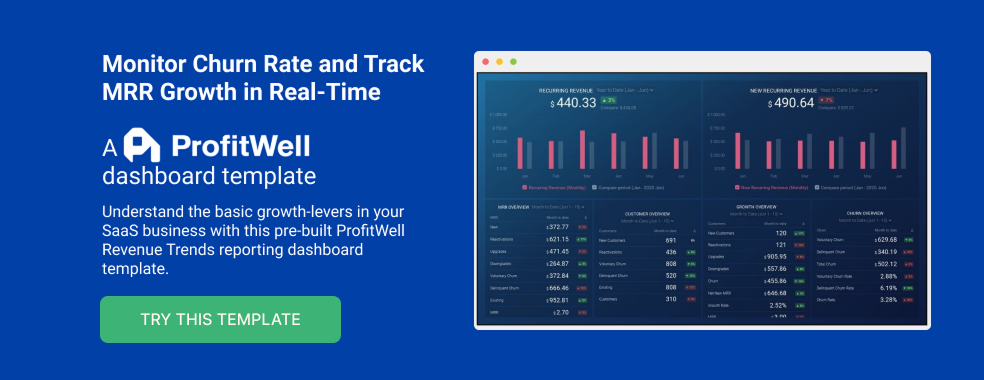
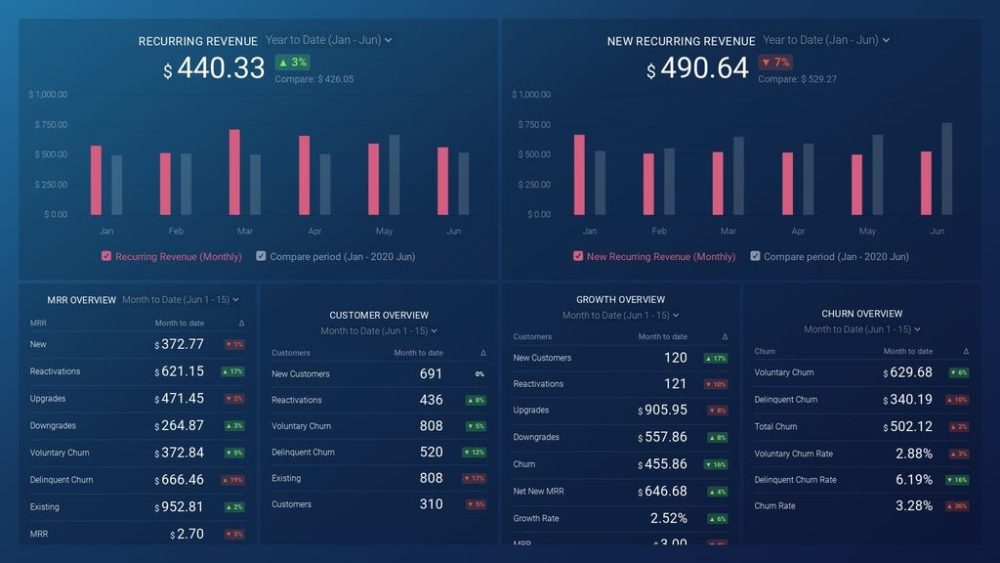
PRO TIP: Are You Tracking the Right Metrics for Your SaaS Company?
As a SaaS business leader, there’s no shortage of metrics you could be monitoring, but the real question is, which metrics should you be paying most attention to? To monitor the health of your SaaS business, you want to identify any obstacles to growth and determine which elements of your growth strategy require improvements. To do that, you can track the following key metrics in a convenient dashboard with data from Profitwell:
- Recurring Revenue. See the portion of your company’s revenue that is expected to grow month-over-month.
- MRR overview. View the different contributions to and losses from MRR from different kinds of customer engagements.
- Customer overview. View the total number of clients your company has at any given point in time and the gains and losses from different customer transactions.
- Growth Overview. Summarize all of the different kinds of customer transactions and their impact on revenue growth.
- Churn overview. Measure the number and percentage of customers or subscribers you lost during a given time period.
If you want to track these in ProfitWell, you can do it easily by building a plug-and-play dashboard that takes your customer data from ProfitWell and automatically visualizes the right metrics to allow you to monitor your SaaS revenue performance at a glance.
You can easily set it up in just a few clicks – no coding required.
To set up the dashboard, follow these 3 simple steps:
Step 1: Get the template
Step 2: Connect your Profitwell account with Databox.
Step 3: Watch your dashboard populate in seconds.
Benefits of Business Intelligence Reporting
The two main aspects of business intelligence reporting are operational and strategic:
- The operational aspect focuses on giving users access to real-time company data in order to perform their daily tasks more efficiently.
- The strategic aspect, on the other hand, helps organizations make better decisions by using data analysis and reporting capabilities.
BI isn’t just about generating reports for the sake of generating reports, it’s about providing valuable information to the people who need it to make better decisions. There are many benefits to using BI in your organization, whether you’re a small business or a large corporation:
- Increase workflow speed
- Implement in any industry or department
- Utilize both real-time and historical data
- Better customer analysis
- Improved operational processes and forecasting
- Optimize costs
- Better decision-making
- Streamline procurement processes
- Improve data quality
- Improve employee performance management
Increase workflow speed
The companies that invest in BI solutions are those that have a plan in place to utilize the data for improving their day-to-day operations or to make strategic decisions that can lead to increased profits. Trying to reach data in different formats from different places can also be a challenge. This can lead to a lot of frustration, especially when you’re trying to present something on the fly.
One of the most notable benefits of business intelligence reporting is how it allows users with limited technical skills to use their own data quickly. Also, BI solutions provide business users with a holistic, multi-dimensional, and user-friendly view of the enterprise from traditional “top-down” reporting and analysis to real-time “bottom-up” transaction data which increases the workflow of the whole organization.
Implement in any industry or department
Business intelligence reporting is used in any industry or department. There are many different types of business intelligence reports. They all have one common goal: cost reduction and improvement of efficiency. Business intelligence reporting can be written for different departments or groups within a company such as HR, finance, sales, or marketing departments.
A successful business intelligence report will help the members of the department or group focus on what matters most and improve their performance.
Utilize both real-time and historical data
In the past, businesses relied on reports that were written as a word document. The problem was that these reports needed to be updated, modified, and presented to the audience. The time that it took to do these tasks meant that the information was usually too late for the audience to use. Business intelligence reporting is a technology that integrates real-time and historical data to provide better insights and metrics.
What differentiates business intelligence from traditional reporting is not just its greater scope, but also its ability to provide critical information that can be acted upon immediately.
Better customer analysis
One of the most important benefits of BI reporting is to gather data and information about the customers and their purchase habits. This data, gathered by different channels and platforms, can be used for further analysis and predicting future trends. Using BI, companies can raise customer loyalty and improve the overall user experience.
For instance, if there’s a new trend in ice cream consumption, you need to know that so you can adjust your product line. Or maybe you want to try and predict which customers will switch to a competitor next quarter. BI reports to help you with this and much more.
Related: 7 Ways to Use Customer Data for More Efficient Marketing
Improved operational processes and forecasting
Business intelligence reporting helps in the analysis of information, but it also helps in decision-making processes by providing the right information at the right time. For example, if a business wants to determine customer satisfaction rates, they will use metrics such as surveys and questionnaires completed by their customers. They will then analyze this data with business intelligence reporting software to present it in easy-to-understand charts and graphs that can be accessed by all levels of management within the company for any type of decision-making.
This process is used for operational optimization as well as forecasting.
Optimize costs
The cost of implementing new software can be detrimental to a company’s budget without an immediate return on investment (ROI). This is especially true for smaller businesses where every dollar counts. Therefore, it’s important for them to understand why their particular needs require the use of business intelligence software.
Better decision-making
Business intelligence reporting can help you formulate crucial strategies, and make important choices that have a significant impact on the business. In the first instance, BI reporting allows for informed strategic decision-making, something that’s crucial for any senior business executive. It also facilitates collaboration between departments, thanks to its ability to visualize data in an easily digestible manner.
To put it simply, business intelligence is concerned with gathering and organizing digital data in order to improve overall business decision-making for CEOs, executives, or senior managers.
Streamline procurement processes
All businesses, both large and small, have procurement processes in place, and the truth of the matter is that they are vital to your organization’s overall success and sustainability.
BI software provides valuable insight into procurement operations by providing real-time reporting on RFI and RFP response times, supplier performance, and compliance rates. This allows managers to streamline procurement processes and keep abreast of potential issues before they become critical problems.
Improve data quality
There are two components to data intelligence. The first is access to the right data at the right time, and the second is enhanced data quality. Data quality refers to having the most reliable data possible at your fingertips. Data quality means not only having access to good information but also knowing that you can rely on it when making key decisions about your business’s future. The main function of BI reports is to provide a summary of specific quality metrics designed to make it simple for users to access data from multiple sources in one place.
Related: 6 Data Quality Issues in Reporting and Best Practices to Overcome Them
Improve employee performance management
Employee engagement is a critical component of a successful organization. When your employees are engaged, they’re more productive, more creative, and generally happier at work. With a central repository for performance data, you can easily identify any patterns or trends that may be present in your organization’s performance data. This allows you to adjust accordingly. For example, if you notice that certain teams are exceeding expectations for a specific metric, you can tailor your training programs to reflect these high standards.
In other words, you can help drive the success of your organization by identifying an area of excellence and expanding upon it.
Related: How SMA Marketing Uses Databox as the Single Source of Truth for Clients and Employees
Business Intelligence (BI) Reporting Examples
The range of BI capabilities and use cases is often misunderstood, with business users wondering why there is so much flexibility. They want to know how the various terms apply to their specific needs. Here are the most common business intelligence reporting examples and use cases:
- Self-Service BI
- Dashboards and Data Visualization
- Static Reports and Alerting
- Augmented Analytics
- Mobile Business Intelligence (BI)
Self-Service BI
A self-service BI report is a subset of business intelligence that allows users to analyze data without writing code. Although self-service BI is widely used today, it wasn’t always so. In the past, business intelligence tools were very expensive and difficult to use, if not unusable. In addition, users needed IT support for any kind of reporting or analytics.
Dashboards and Data Visualization
In the business intelligence industry, a dashboard is defined as a graphical instrument displaying KPIs or key information on a particular topic of interest. Dashboards use data visualizations such as charts, graphs, and maps to allow users to quickly see an overview of their organization’s performance over a certain time period. The key benefits of dashboards are improved collaboration and information sharing across the organization.
Related: What’s the Best Chart Type for Your Dashboard Metrics?
Static Reports and Alerting
Static Reports are easy to build and share. Business users can create static reports by using business intelligence software to analyze their data and then choose which data they want to summarize in charts, graphs, and tables. Alerting helps to identify trends and take quick action. Alerts should be simple so that users can quickly understand the situation and take action without having to dig through a document for more information.
With Databox, you can receive alerts and recommendations when they matter most. Connect your data now to never miss an important performance change ever again.
Augmented Analytics
With the advent of AI and machine learning, we are seeing a paradigm shift in the use of BI tools. Augmented analytics use artificial intelligence (AI) and machine learning to enhance human intuition with suggested insights and analyses, automation of tasks, search & natural language interaction, and real-time advanced analytics. Augmented analytics is related to cognitive computing, which enables computers to think the way people do.
Mobile Business Intelligence (BI)
Leveraging the power of mobile devices for reporting purposes is now possible with fast wireless networks, new mobile applications, and the wide availability of mobile devices such as smartphones and tablets. Given the way work happens today, users need to be able to access and analyze their data wherever they are.
How to Create a Business Intelligence Report
For years, most business intelligence (BI) reports have been created for a specific audience. The problem is that the audience may not be using BI reports to get the information they need. Today, BI reporting needs to go further than just generating a report – it needs to deliver results. To do this, you need to understand who your stakeholders are and how they want to consume your data.
Here are the key components to creating a successful business intelligence report:
- Define your stakeholders
- Choose the right metrics
- Take advantage of data visualizations
- Monitor your data
- Bonus tip 1: Implement a data-driven culture in your business
- Bonus tip 2: Be willing to learn and adapt
Define your stakeholders
The first step to creating a successful business intelligence report is reaching out to your stakeholders — the people who need access to the information you’re gathering — and getting their feedback on what they’re interested in seeing in a report. Stakeholders are the people who are interested in your report. They have various roles, and for each of these roles, you need to create a separate report. The role of a stakeholder can be defined by their position, interests, or even their availability and perception.
Related: Reporting Strategy for Multiple Audiences: 6 Tips for Getting Started
Choose the right metrics
Let’s say you want to start a business in the restaurant industry. It is very important for you to understand the metrics that are going to help you analyze your business because it will help you make better decisions. If you know how many customers come to your restaurant per month, how much money these customers spend and what their average bill is then you can assume how much money you will make or lose from this month.
Related: How to Choose the Right Performance Metrics To Track for Your Business
Take advantage of data visualizations
Thanks to the evolution of data visualization, by now it is possible to create bar graphs, and pie charts in seconds for business intelligence reporting. The use of more advanced visualizations such as maps, images, and videos can have a great impact on the way your BI report is perceived by the users. Data visualization makes it easier to spot patterns in your data. It is also a more effective way of presenting data than tables and spreadsheets, which are harder to understand and compare.
Monitor your data
Once you have identified the right key performance indicators (KPIs) that measure your goals, the next step is to monitor them in real-time. This is maybe the crucial step because you track the data and how it evolves over time. If you underestimate this step you won’t be able to know when it’s time to act.
Related: Marketing Monitoring vs. Marketing Reporting: What Is More Important?
Bonus tip 1: Implement a data-driven culture in your business
To be successful, data analysis needs to become a part of your company culture. This can happen when you make sure everyone in your organization is aware of the importance of business intelligence reporting and how to use it effectively:
- Empower your team – If you want to see your company grow and prosper, you need to empower your team members by giving them the opportunity to make decisions based on data analysis.
- Invest in Data Literacy – The best way to ensure that every employee can take advantage of Business Intelligence is to invest time and effort in teaching them how to use it effectively. The more people who are familiarized with data analysis, the better decisions can be made, which will result in an overall improvement in the company’s performance.
- Promote accessibility – After motivating employees and teaching them how to use Business Intelligence reports, you need to make sure that they have easy access to all of them. Implementing technology like an Intranet portal will let everyone at any time access all BI reports so they can make informed decisions.
Bonus tip 2: Be willing to learn and adapt
The old proverb says: “Anyone who stops learning is old, whether at twenty or eighty.”
Don’t let your business become old.
Learning is actually adapting to new trends in the global market. Every day brings new demands so you must prepare for tomorrow and be able to adapt constantly by finding problems and tackling them.
Business Intelligence (BI) Reporting Best Practices
A lot of best practices can make your business intelligence reporting more effective. Here we mention some of them:
- Prepare data – The goal is standardizing formats so that data can be easily analyzed across the enterprise without needing to spend significant time on extracting, transforming, and loading processes or dealing with issues related to incompatible file types. Also, it’s crucial to present data in a way that makes sense to key decision-makers.
- Be flexible and scalable – Choose a solution that’s flexible enough to meet the needs of your growing company as well as one that’s scalable so you can access and share data insights across on-premise and cloud deployments while keeping governance policies high.
- Govern data – Easily find any data from any system across any number of systems without asking IT for help or hunting through IT management consoles. Find, understand, interpret and act upon the most important information from all company-wide data sources with a single search or query. Automate processes by setting permissions for each source of data and automating workflows for approval and action.
- Tell a story with data – With today’s technologies, you can design and develop interactive dashboards to tell your data story. With a solid foundation in business intelligence, you can make data come alive and actually tell the story of what is going on in your business.
- Keep it simple – Don’t get caught up in making your visualizations or dashboards overly complicated. The purpose of these tools is to present information clearly so people can understand their meaning quickly.
Transform Data into Business Insights with Databox
Business Intelligence (BI) reporting is a powerful set of practices that allows you to take the data your team collects, and turn it into actionable insights. In essence, with BI reporting, you no longer have to manually pull together data from dozens of sources into million-dollar reports.
It’s time to start collecting and analyzing data! But what is the most efficient way to do it?
Databox is a cloud-based analytics tool designed to make your business world a better place. By giving you the power to collect, analyze, and report on data in real-time, this tool can help drive your business forward and make informed, data-driven business decisions.
No more sifting through dozens of tools, squinting at spreadsheets and grappling with outdated databases. Transform your data into meaningful insights today and get to the right business action faster than ever before.


