Table of contents
Monthly business reports are one of the best ways to keep your internal stakeholders in the loop and make sure they are up to date with the latest company activities.
These reports include recent accomplishments, productivity levels, current tasks, and overall significant happenings that have occurred within the past month. They are used as a foundation for future decision-making and healthy business growth. No wonder that more than 75% of companies report on Marketing at least once a month, according to Databox’s state of business reporting.
In most cases, you will present a monthly business report to the most important company members, which is why you should formulate them meticulously and carefully.
Of course, you will have your hands full with other tasks, and creating a detailed report each month can become tiresome if you don’t use the right methods.
This guide will teach you what monthly business reports are, why you should use them, and provide you with practices and a step-by-step guide you can follow to create them quicker and with more efficiency.
Want to impress your stakeholders with a great monthly business report? Let’s dive in.
- What Is a Monthly Business Report?
- Why Are Monthly Management Reports Important for Businesses?
- What Should Be Included in a Monthly Business Report?
- How to Write a Monthly Business Report?
- Monthly Reporting Best Practices
- Monthly Report Templates
- Improve and Automate Monthly Business Reporting with Databox
What Is a Monthly Business Report?
Monthly business reports are documents that summarize all of the most important activities, operational information, and data collected during a particular month.
They include the most significant statements from each business department and should be presented in an understandable way to the stakeholders.
Executives use these types of business reports to showcase certain performances, results, schedules, and eventual problems. Monthly reports have become a common practice within companies since they are one of the most effective ways to keep the highest-ranking company members informed on the latest activities.
When each important member is up to date with everything that’s going on in the company, you can work together to create future plans, decisions, goals, and solutions to specific problems.
You should try to keep monthly business reports brief but extensive.
Related: Quarterly Business Review: How to Write One and How to Present It Successfully
Why Are Monthly Management Reports Important for Businesses?
Operating a company is a team effort. The highest-ranking members typically have plenty of different tasks to complete and overlook specific parts of the business.
However, completing any type of task requires insight into how things are operating at the other ends of the company. Monthly reports provide this insight.
Here are some of the most important things monthly business reports can help with:
- Evaluating the financial performance of the business as a whole and making decisions based on the operational data.
- Having a clear picture of budget spending. You can compare the estimated budget with what’s actually being spent.
- Measuring the overall actual performance and checking if it is in line with the goals you set for the future.
- Formulating new strategies and making decisions with the aim to enable healthy business growth.
- Recognizing and coming up with both short and long-term plans on how to handle the company’s resources.
- Minimizing any risks that can cause harm to the company by reviewing the budget on a monthly basis and preparing for future market fluctuations.
- Staying on top of contenders by tracking the company’s progress and maintaining a competitive position.
- Analyzing historical trends to come up with accurate performance forecasts.
What Should Be Included in a Monthly Business Report?
Monthly business reports have to be well-formatted, organized, concise, and understandable. All of the most important data within a month will be included so there mustn’t be any space for misinterpretation.
Creating a monthly report isn’t the easiest task, but there are some universal guidelines that you can follow to make sure your report passes with flying colors.
These are the most important things your monthly business report should incorporate.
- Branded Cover Page
- Mission, Vision, and Values
- Table of Contents
- Organizational Scorecard Views
- Detailed Pages
- Charts
- High-Level Project Overviews
- An Online Version of the Report
Branded Cover Page
The first page of your report is also the first impression. No matter how good your report may be overall, your cover page shouldn’t come off as sloppy.
The cover page highlights the logo, name, address, and other key pieces of information. By creating a branded cover page, you will show the stakeholders that you are a true professional who takes these reports seriously.
Mission, Vision, and Values
Defining your organization, in the long run, is necessary for appropriate planning. It will also help you come up with an adequate strategy to achieve the goals you have set for the future.
To make sure the strategy succeeds, your employees need to know the mission you have in mind.
Include mission, vision, and value statements at the beginning of your monthly report to better present your overall strategy.
Table of Contents
Even though your monthly report should be as brief as possible, in bigger companies it could end up having dozens of pages.
Also, the stakeholders may be interested in reading one part of the report more than another, and including a table of contents will make navigation easier.
Organizational Scorecard Views
Scorecards have always been one of the best ways for companies to identify and improve their internal operations. They include historic performance data and provide feedback that can be useful for making future decisions.
Including scorecards in your report will increase the readability of the various financial statements and performance overviews.
Generally, the best way to organize scorecards is through different perspectives:
- Financial perspective
- Customer perspective
- Internal perspective
- Learning and growth perspective
Explain the value of each of these so your team can easily grasp the bigger picture.
Detailed Pages
To make sure everyone is clear on the objectives, you should include detailed pages that contain the most significant information.
Monthly management meetings tend to involve discussions about objectives and future plans. While having a brief analysis of the projects and metrics can help clarify certain things, there are some topics that you want to discuss more thoroughly.
Detailed pages can help you engage in these thorough discussions.
Charts
Comprehensive charts equal happy leadership teams.
Creating a monthly business report can’t go without including the most important KPIs. The best way to present KPIs is through charts. Make sure they are easy to read, consistent, and well-visualized.
High-Level Project Overviews
While discussions are an important part of monthly management meetings, you don’t want to be discussing every little detail of the ongoing projects.
Include an overall brief for each project with the most important information and leave the prolonged discussions for project review meetings.
An Online Version of the Report
Last-minute changes to monthly reports happen all the time. Having an online version of the report helps you keep the information up to date more efficiently and it makes it easily accessible to stakeholders that might not be able to join the meeting.
Also, if you need to make any small adjustments to the reports during the meetings, you can implement them right away in the online version of the report.
How to Write a Monthly Business Report?
Now that you know what your monthly report should include, we can move on to the writing process.
Since you will be writing these reports each month it’s important to have certain guidelines that you can follow every time.
Follow these five steps to create a great monthly business report in no time:
- Gather Data and Information from the Past Month
- Study and Analyze the Gathered Data and Information
- Make Use of Graphs and Charts
- Come Up with Solutions to Problems
- Review Everything from Start to Finish
1. Gather Data and Information from the Past Month
The most important data and information of the month are the key contents of any good monthly report. You can’t start writing without gathering them first.
Ask the employees from different departments to provide you with the paperwork so you can obtain the data you need to include. Also, make sure to include your own observations about the situation in the company.
2. Study and Analyze the Gathered Data and Information
After you have gathered all the information you need from the various departments, you should start analyzing them.
Find out what led to certain outcomes and what caused problems. Create official statements that explain the causes and consequences of specific actions.
3. Make Use of Graphs and Charts
Visualizing the most important metrics and KPIs through graphs and charts can make the report much more comprehensible.
They can also make it easier for the readers to connect the different variables and understand better what you are presenting.
4. Come Up with Solutions to Problems
Every business in the world occasionally runs into some kind of problem. What separates great companies is their ability to deal with them as soon as they arise.
If there was some kind of problem during the month, make sure you come up with a couple of solutions. This way, your superiors will know that there isn’t any reason to panic and that you have everything under control.
5. Review Everything from Start to Finish
Before you provide the stakeholders with the finished monthly report, go over it once more. It’s always a good idea to proofread it and check if all the information you provided accurately represents the overall performance and future strategies. You will also see if there is anything that you forgot to add or overlooked.
PRO TIP: How Well Are Your Marketing KPIs Performing?
Like most marketers and marketing managers, you want to know how your efforts are translating into results each month. How is your website performing? How well are you converting traffic into leads and customers? Which marketing channels are performing best? How does organic search compare to paid campaigns and to previous months? You might have to scramble to put all of this together in a single report, but now you can have it all at your fingertips in a single Databox dashboard.
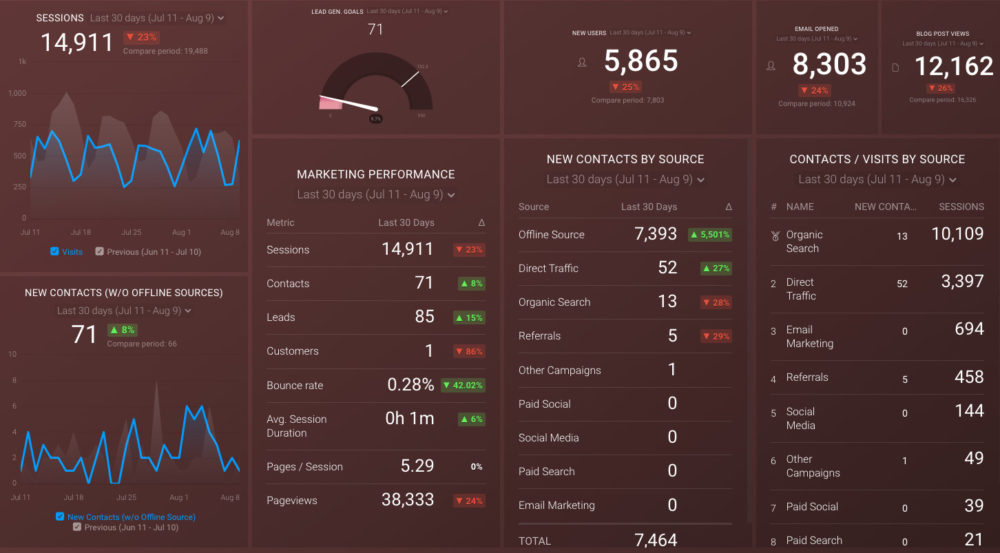
Our Monthly Marketing Performance Dashboard includes data from Google Analytics 4 and HubSpot Marketing with key performance metrics like:
- Website sessions, new users, and new leads. Basic engagement data from your website. How much traffic? How many new visitors? How many lead conversions?
- Lead generation vs goal. Did you reach your goal for lead conversion for the month, quarter, or year? If not, by how much did you miss?
- Overall marketing performance. A summary list of the main KPIs for your website: sessions, contacts, leads, customers, bounce rate, avg. session duration, pages/session, and pageviews.
- Email response. Overall, how effective were your email campaigns, measured by email opens?
- Blog post traffic. How much traffic did your blog attract during a certain period?
- New contacts by source. Which sources drove the highest number of new contacts
- Visits and contacts by source. How did your sources compare by both sessions and new contacts in a certain period of time?
Now you can benefit from the experience of our Google Analytics and HubSpot Marketing experts, who have put together a plug-and-play Databox template that contains all the essential metrics for monitoring and analyzing your website traffic and its sources, lead generation, and more. It’s simple to implement and start using as a standalone dashboard or in marketing reports!
You can easily set it up in just a few clicks – no coding required.
To set up the dashboard, follow these 3 simple steps:
Step 1: Get the template
Step 2: Connect your HubSpot and Google Analytics 4 accounts with Databox.
Step 3: Watch your dashboard populate in seconds.
Monthly Reporting Best Practices
Implementing certain practices into monthly reporting can transform your company’s performance. They can make reporting faster and easier for each party involved.
However, if the report contains errors, misleading information, or is presented inefficiently, it can cause quite a bit of trouble.
The leading companies in the world use several practices to make sure their monthly business reports are always state of the art. We picked out five:
- Filter Useful and Accurate Data Each Week
- Make up-to-date data available to key decision makers and stakeholders at all times and in all places
- Remove complexity from financial reports
- Implement a strong, well-organized reporting process
- Set Strategic Goals and Objectives
1. Filter Useful and Accurate Data Each Week
No matter how big or small your business is, you will probably be receiving a large amount of data each week. The best way to prevent it from piling up is by freeing up time at the end of the week to categorize it.
Time goes fast, but it goes even faster in growing businesses. You may think that categorizing data on a weekly basis will end up taking up more of your time, but that isn’t the case.
By filtering the most useful and accurate data each week, you will already have a better idea of what to include in the monthly report when you start writing it. You can use different reports to place the data you have filtered over the previous weeks and combine it all in one place in your monthly report.
Related: How to Analyze Data: 30+ Experts on Making Sense of Your Performance
2. Make up-to-date data available to key decision makers and stakeholders at all times and in all places
To establish healthy business growth, the key decision-makers have to provide their input and be caught up on the latest activities.
As we said, in growing businesses, data can pile up rather quickly and you will have to make certain decisions along the way.
For better decision-making, it’s wise to make the latest data available to all the stakeholders and department leaders in one place. Online reports are a great choice since they can be updated as soon as something changes.
With online reports, all the key decision-makers in the company will be able to have an insight into the most recent and important information regarding the company’s performance, and they can access them from anywhere. You won’t have to arrange in-person meetings for every single detail.
Related: How to Set Up an Automated Reporting System: Tips, Tools and Best Practices
3. Remove complexity from financial reports
When creating your monthly business report, you should keep in mind that not every member is trained to understand accounting terminology. This doesn’t mean their ideas are any less useful.
By simplifying the complex financial information and making it understandable to all the potential problem solvers, you will have a much easier time creating future strategies.
One good way to increase the readability of financial statements is through graphs and charts built in centralized financial reporting software. Visualizing the most important metrics and financial KPIs can be a lot more powerful than conveying the message through words alone.
Related: How to Write a Great Business Expense Report: A Step-By-Step Guide with Examples
4. Implement a strong, well-organized reporting process
Writing a good monthly report involves a lot of steps that you have to follow precisely and in order.
Aside from having digital or paper checklists, you also have to clarify who needs to do what and give departments deadlines on when to provide information that you will have to include in the report.
Without specifying these things, you risk falling behind on the reporting process and having the report turn out inaccurate.
Creating a checklist and telling department leaders when to provide data will have a major impact on the organizational aspect of your monthly reports.
Once you have a precise reporting process in play that you can use each month, the reporting process will be much more efficient and will take up less of your time.
Related: How to Write a Great Business Development Report: A Step By Step Guide with Examples
5. Set Strategic Goals and Objectives
Before you begin writing your monthly report, you should have a clear idea of what goals and objectives you want to set at the end.
Why is that certain piece of information important? Are the customers satisfied? Is there anything from the previous month that needs to be changed?
By having the answers to the most important questions you will understand which company affairs will have to be thoroughly addressed in the report.
Make sure you set the next month’s objectives and goals clearly and let the stakeholders know what they can do to help.
Related: What Is Strategic Reporting? 4 Report Examples to Get Inspiration From
Monthly Report Templates
Monthly business reports are used to keep stakeholders up to date with the latest information regarding the company’s performance.
They include the most important data from each department and track KPIs with the goal of making them understandable to all the high-ranking members.
To stay on top of modern technology and remain competitive, many businesses turn to monthly report templates to present the company’s performance accurately.
Here are some templates that you can use to improve your monthly business reporting process:
- Project Management Report
- Monthly Sales Report
- Monthly Marketing Report
- Social Media Monthly Report
- Monthly Financial Business Report
Project Management Report
Use this Project Management Report from Harvest to track all of your most important projects in one place. This dashboard will help you monitor all your tracked time, billable hours and billable amount split by projects in Harvest. Use this report to see how many hours are tracked on a monthly, quarterly and yearly basis, split tracked time by projects and compare with previous periods, and more.

Monthly Sales Report
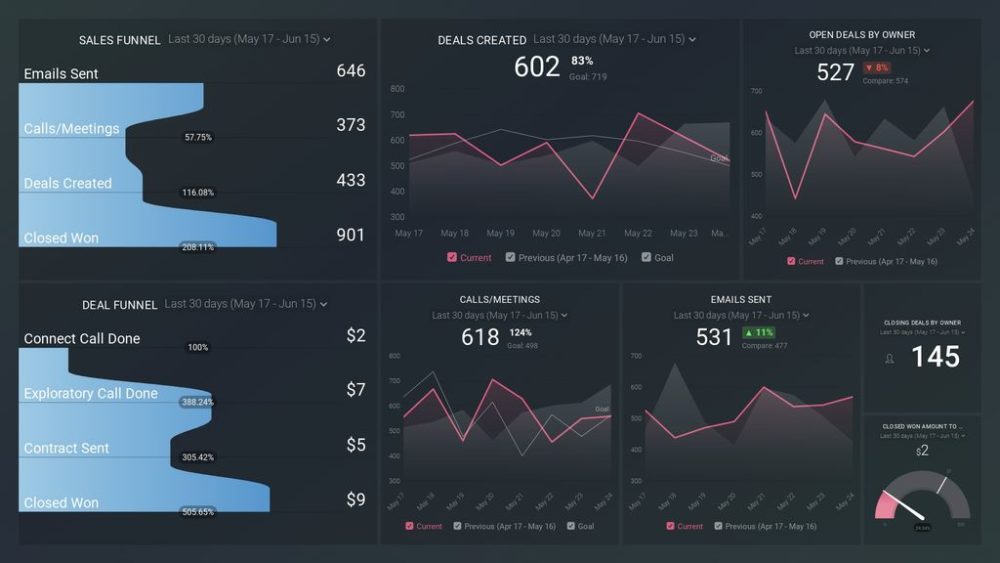
The Monthly Sales Report from HubSpot CRM can help sales representatives manage and track their monthly sales activities much more efficiently.
This report tracks monthly progress in all of the most important areas such as:
- Deal pipelines and level of progress in sales
- Comparison of monthly activities
- Creating/closing deals rate
The key metrics included are sales funnels, deal funnels, open deals by owner, closing deals by owner, and closed won amount.
Pro Tip: If you want to drill down into your data further and create valuable context around it that you can easily share, you can use our HubSpot CRM Monthly Performance Report Template. Manual reporting is a time-consuming and tedious process. Databox Reports offer automation features to make the reporting process quicker and easier, so you can make reporting a regular part of your workflow.

Monthly Marketing Report
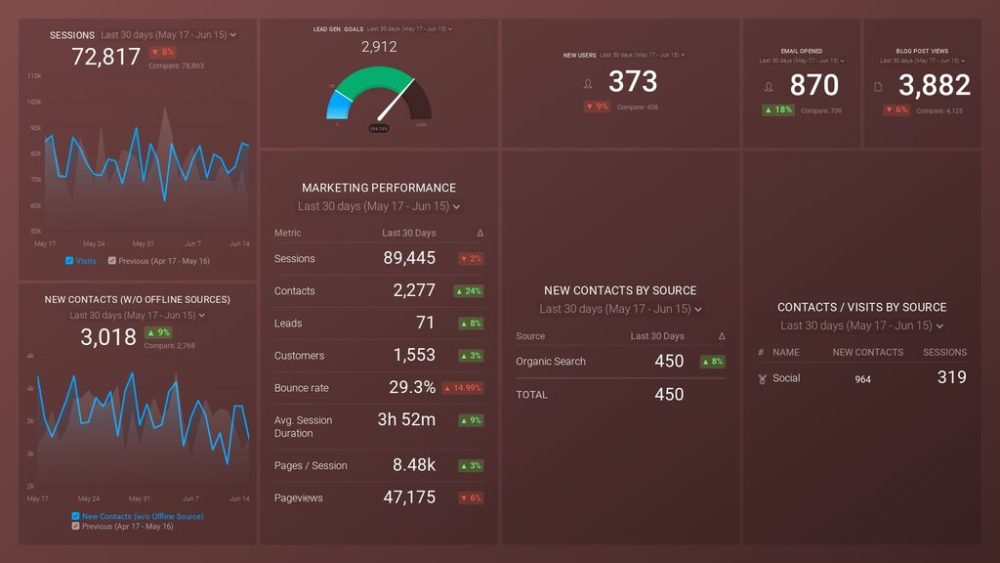
One of the best ways to capture all the efforts of marketing is through the Monthly Marketing Report. This dashboard provides answers to questions like:
- Which traffic sources generate the most leads?
- How to track the number of new users?
- How to compare traffic from email vs. blogs?
- Are the marketing efforts paying off?
It also includes key metrics such as bounce rate, new users, pages/sessions, and page views.
PRO TIP: You can use text slides to give your agency the flexibility to provide context right where it belongs—inside your client report. Write up your report inside Databox, no slide deck is needed. Auto-add Insights to help build a narrative that proves ROI and guides all stakeholders to the next right step. All that with our Advanced HubSpot Marketing Performance Report Template. This report template includes the following sections – HubSpot Marketing overview, Website Performance overview, Landing Page Performance overview, Blog Performance overview, Email Performance overview, Work Completed, and Recommendations.

Social Media Monthly Report
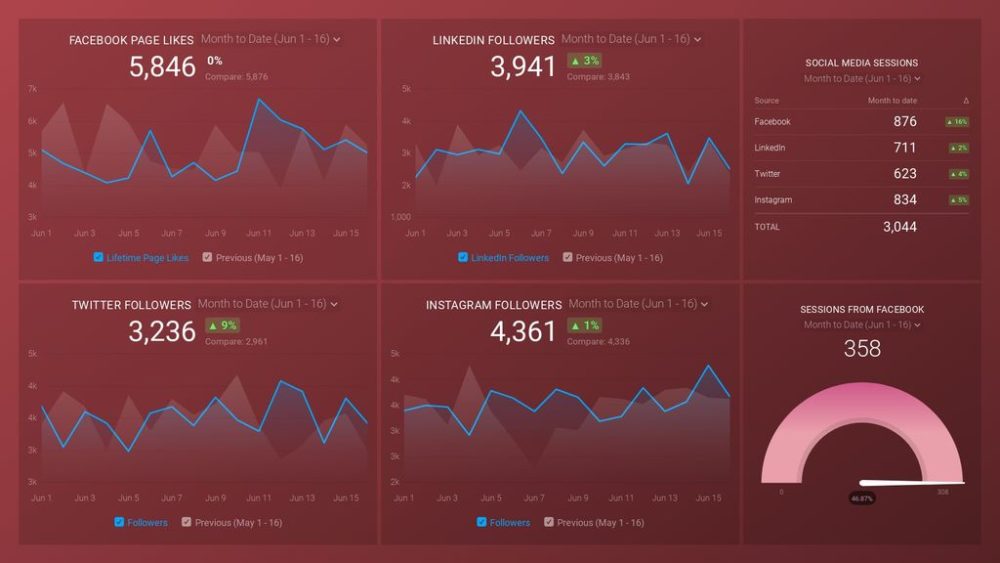
Do you want to measure the impact social media marketing has on your website? You can do it by using our Social Media Monthly Report.
This dashboard lets you track all the crucial metrics and create accurate reports based on your social media data.
Furthermore, you will gain insights into all the crucial activities going on across your social media networks. You will get the answers to these questions:
- How many likes do I have on my Facebook page?
- How to track follower growth on different channels?
- Which social media drives the most traffic to my website?
Pro Tip: You can use this Organic Social Monthly Performance Report Template to share insights and create context and a story around your Facebook, Instagram, and LinkedIn Performance. With Data Story slides, you get pre-written insights that you can use to share your results in a more meaningful way, and, even better—your text will stay up to date along with your data.

Monthly Financial Business Report
The Monthly Financial Business Report can help you monitor the overall financial health of your company. Also, you can use it to quickly identify problems that could impact your company’s cash flow and turnover.
This dashboard is also extremely useful if you use QuickBooks and HubSpot since you can connect your accounts to the report in just a few minutes.
The key metrics that are included in this report are paid invoice amount, gross profit margin, expenses, and income.
Improve and Automate Monthly Business Reporting with Databox
Monthly business reports are the foundation of better decision-making and company scaling. They should always be accurate and understandable since they keep the stakeholders updated on the most significant activities that occurred within a month.
Databox can help you take your monthly business reports to the next level.
By visualizing all of the most important metrics and KPIs through customizable dashboards, you can easily break down even the most complex financial statements to your stakeholders. Furthermore, you can use Databox to track all of the most important data from each department in one place to make the reporting process much less time-consuming.
Sign up for a free trial and automate your monthly business reporting in no time.


