


Table of contents
Manual copy‑pasting belongs in 2015.
Modern BI platforms automate every step—from pulling raw data to distributing presentation‑ready insights—so your whole company can spot trends and act faster.
In this guide we’ll show you how to build a fully automated reporting workflow in Databox (and why ‘democratized speed’ beats spreadsheets every time).
On to the details:
- What Is Report Automation?
- Why Should You Automate Your Reports?
- Benefits Of An Automated Reporting System
- How Can You Automate Your Reports?
- Report Automation Tips and Best Practices
- Best Tools for Setting Up an Automated Reporting System
- Free Automated Reporting Templates for Marketing and Sales
- Automate Reporting with Databox

What Is Report Automation?
Automated reporting means your BI platform continuously syncs raw data from every source you connect—marketing, sales, finance, product—refreshes it in real‑time, then packages the insights into dashboards or slide decks that fire off on a schedule. No SQL, no copy‑paste..
Report automation software is typically running on your own computer (or cloud) to collect and process online data by using software APIs. Therefore, automated report gathering and composing technology can eliminate a lot of manual work processes in an organization.
Why Should You Automate Your Reports?
Report automation is a great way to get a bird’ eye view of your digital marketing efforts. It’s important for all parties involved to always have access to updated reports that are specific to the data they are interested in. Data is entered into the system, automated and then delivered either online or sent via email.
No doubt there will be a time or two in your business life where running and reviewing reports is a time-consuming process that impacts your ability to take appropriate action. Report automation can help remove the burden of some inefficient processes which bog down your staff, give you the ability to produce reports on a more frequent cycle, and free up resources for more value-adding tasks.
Benefits Of An Automated Reporting System
There are a lot of benefits to using automated reporting, such as:
- Save time and money
- Enhanced accessibility, transparency & productivity
- Access to real-time decision-making
- Improved growth and development
- Democratization: Unlimited user seats mean anyone—from the C‑suite to interns—can explore live data, not just analysts.”
- Speed: Real‑time sync + scheduled delivery = decisions informed in minutes, not at month‑end.
Save time and money
An automated reporting system that automatically tracks and updates your data is going to save you countless hours of manual effort, as well as a lot of money. More than that, it will empower you to get the most value from the time and energy that you invest. You will always have the necessary up-to-date information ready at your fingertips within minutes of your request.
Related: How Automated Reporting Saved 16 Agencies Time, Money, and Headaches
Enhanced accessibility, transparency & productivity
Increased collaboration and transparency, greater productivity, and better insights are just some of the benefits of working with automated reports. These reports can be easily accessed from your software application or made available on a centrally located website or via service-oriented architecture. By providing all stakeholders with access to reliable information (delivered on a regular cadence) they will be able to make better decisions. This is essential for steady growth. What’s more, as modern reporting tools offer built-in analytics, you will get more bang for your buck!
Access to real-time decision-making
Sometimes, you need data fast. Like, really fast. That’s when a simple automated report can come in handy. Reports are one of the most effective ways to gain insight into your marketing efforts, but not all reports do the trick. Let’s look at an example: If you notice your blog is underperforming, how long will it take to analyze your traffic and find the problem? Having access to real-time data is important, especially for small businesses and startups. And that’s where having a small business dashboard software comes to play.
What good does having a basic dashboard with historical data do if you have to wait three weeks for it? Are you going to wait three weeks to make a decision? Maybe in the time that it takes you to gather accurate reporting data, your business could be missing out on potential customers and sales.
Improved growth and development
Thanks to the latest innovations in data analytics, your business can benefit from continuous growth and development at any point in time. If you can work between the hours of 8 am and 2 am, you’ve already got access to tools and technology that will greatly improve how well you monitor your web stats and digital marketing performance.
How Can You Automate Your Reports?
There are many options out there when it comes to automation tools. Some are more complicated, while others are easier to use. Some are more expensive, while others come free. The only way to know which is right for your particular business is to have a clear understanding of your business goals, the important metrics that affect those goals, and what kind of reporting you find yourself doing over and over again.
Here is a list of the four most popular methods for automating your reports:
- Code-It-Yourself System
- Business Intelligence (BI) Tools
- Data Analytics Dashboard Tools
- Automated Reporting Tools
Code-It-Yourself System
This is the most time-consuming and expensive way to create a reporting system. However, it can offer you the highest level of customization and flexibility. You can pick your own features, add in custom-made functionalities, or choose from some pre-developed ones.
There are also some other issues that you might face. First, as in the case of DIY tools, you won’t be able to get any support from the team if any issues arise. So, you’re on your own. Second, you might need a lot of time to build and customize your own system. And last but not least, if you plan to grow fast and hire a lot of employees, the DIY option is not for you. It might cause bottlenecks and slow down your sales process because every time someone new joins the team, they have to learn how to use all of your tools.
- Pros: Full control, customizable
- Cons: Expensive, time-consuming
Business Intelligence (BI) Tools
Tool manufacturers often provide a wealth of ready-to-go templates, including dashboards, scorecards, and reports with all kinds of data visualization. You can use these templates as-is or customize them to fit your needs. The downside to these tools is that they generally require a steep learning curve. For example, Tableau offers a free version, but you can’t export your data outside its platform.
In addition to the analytics capabilities, BI tools work best when you have a good deal of raw data available (not just a small sample), which means you have to collect more than you need right away.
- Pros: Robust data analysis, custom and flexible
- Cons: Highly analitical, requires time to learn
Databox vs. Traditional BI
Tableau, Power BI, and Looker Studio excel at deep analysis but often require data engineering resources. Databox delivers the same core outcome—trusted, actionable insights—without code or steep learning curves, so everyone can move faster.
From the multitude of tools available today that allow users to create automated reports, I have chosen this tool as the best among them. Connect 130+ integrations out‑of‑the‑box— Salesforce, HubSpot, GA4, Snowflake, QuickBooks, Stripe—plus any custom source via SQL or API.
The reports you can create with this tool include: Ad Campaign Reports, Top Landing Pages Report, Cost Per Acquisition Report, Affiliate Referral Report, Geo-Location Report, and many more.
When you’re using an automated reporting tool like Databox, all you have to do is connect your data source and choose your metrics in order to visualize them. With pre-built templates, you don’t even have to pick your own metrics.
- Pros: Easy-to-use, multiple integrations
- Cons: Subscription pricing scales with data volume.
Data Analytics Dashboard Tools
The best data analytics dashboard software for small businesses is the one that lets you build and deploy your reports quickly, and easily share them with colleagues. I’ve been using Google Data Studio for over a year now and it has served me well. One of the best things about Google Data Studio is that anyone on your team can use it! With just a little bit of help from your analytics expert, most of your team will be able to create their own reports in no time. I also love how easy it is to share my reports with clients or prospects by simply sending them an email with a Google Drive link.
- Pros: Could be free, less complex
- Cons: Basic features, less customization
PRO TIP: How Well Are Your Marketing KPIs Performing?
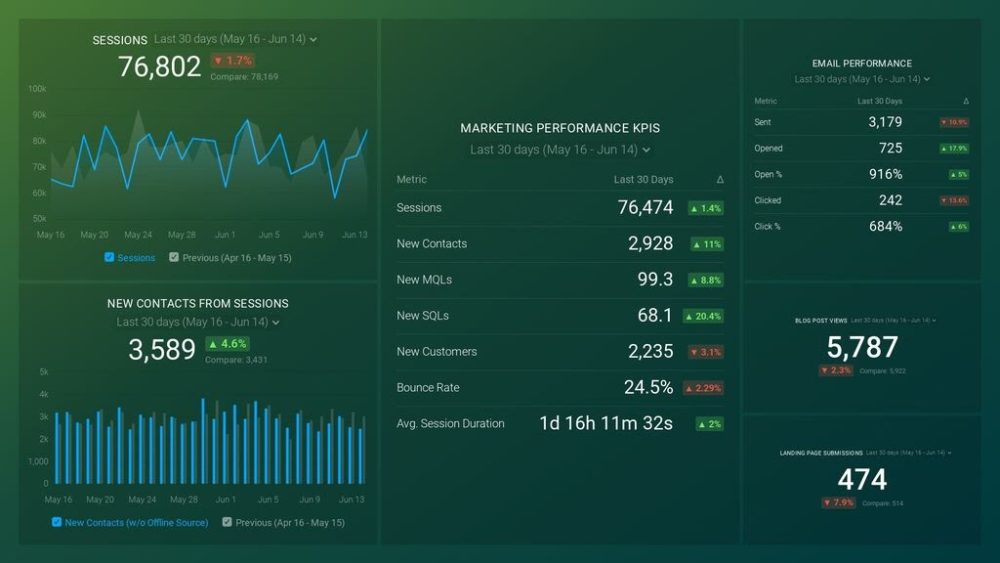
Like most marketers and marketing managers, you want to know how well your efforts are translating into results each month. How much traffic and new contact conversions do you get? How many new contacts do you get from organic sessions? How are your email campaigns performing? How well are your landing pages converting? You might have to scramble to put all of this together in a single report, but now you can have it all at your fingertips in a single Databox dashboard.
Our Marketing Overview Dashboard includes data from Google Analytics 4 and HubSpot Marketing with key performance metrics like:
- Sessions. The number of sessions can tell you how many times people are returning to your website. Obviously, the higher the better.
- New Contacts from Sessions. How well is your campaign driving new contacts and customers?
- Marketing Performance KPIs. Tracking the number of MQLs, SQLs, New Contacts and similar will help you identify how your marketing efforts contribute to sales.
- Email Performance. Measure the success of your email campaigns from HubSpot. Keep an eye on your most important email marketing metrics such as number of sent emails, number of opened emails, open rate, email click-through rate, and more.
- Blog Posts and Landing Pages. How many people have viewed your blog recently? How well are your landing pages performing?
Now you can benefit from the experience of our Google Analytics and HubSpot Marketing experts through a plug-and-play Databox template. It includes key metrics for tracking your leads and can be used as a standalone dashboard or as part of your marketing reports. You can try it during your free trial no setup headaches.
You can easily set it up in just a few clicks – no coding required.
To set up the dashboard, follow these 3 simple steps:
Step 1: Get the template
Step 2: Connect your HubSpot and Google Analytics 4 accounts with Databox.
Step 3: Watch your dashboard populate in seconds.
Report Automation Tips and Best Practices
The potential of automation certainly has a positive impact on business productivity levels since the entire workforce can focus on more human-centric tasks while embarking on deeper discussions surrounding the meaning of the data, migrating away from tedious tasks and manual calculations in the process. But how does this look in practice?
To make sure you make the most out of report automation, before you start, answer these critical questions and consider these tips or tricks.
Here are some tips and tricks to help you get started:
- KPIs and metrics selection
- Define your goals
- Determine reporting frequency
- Determine the format of the report
- Provide access and education
- Choose the best tools for your needs
KPIs and metrics selection
Pick the right KPIs (Key Performance Indicators). They should be relevant to the project at hand and motivate your team members to take action. An easy way to do this is by picking those metrics that are most important for each team member’s performance review. You should select around 6-8 KPIs. These will be the center of each report and you need to communicate them clearly and on-point.
Define your goals
It all starts with defining a clear set of goals. This sounds glaringly obvious, but you’d be amazed at how many people overlook this task. Once you’ve decided on which department, processes, or functions you think need streamlining, it’s time to define your core data automation goals within those parameters. You can ask yourself these questions:
- Do you want to save time on proving the worth of your paid advertising efforts?
- Are you looking for a better, more effective way of displaying your team’s performance metrics?
- Is saving time sifting through your recruitment data a top priority?
- Do you want to reduce (or eliminate) manual admin tasks?
- Are you trying to cut down on repetitive queries and requests for access to sensitive information by providing a central portal for employees to access their own information in one place?
If you set specific automation goals, you will streamline your data analytics strategy in the right areas. As a result, your automation will provide responsive, intelligent insights related to the departmental functions that matter most.
Determine reporting frequency
The frequency of automated reporting depends on the business problem you’re trying to solve. Most data-driven companies have different reporting frequencies for operational and strategic data, but there are no hard and fast rules about when one solution is more appropriate than another. A daily report is commonly used for operational data, as it provides real-time information that can be acted upon immediately. On the other hand, weekly reports often suffice for strategic data that requires more time to analyze and draw conclusions from. But depending on your business needs, both types of reports could be needed simultaneously.
Determine the format of the report
A report format should be consistent, easy to read, and contain the information that needs to be conveyed. The ultimate goal is to create a report that is clear and actionable for the consumer. You should also determine whether your data should be visual or non-visual (text only). Also consider whether it will be helpful to have a “live” report that updates regularly, or if you want the data at a specific point in time–for example, such as after the weekend or after a monthly financial review.
Provide access and education
These are the two cornerstones of creating a smooth automated reporting system. If you’re considering moving your business to an all-automated data reporting solution, you’ll need to implement both of these measures in order to reap the benefits that such a system can offer.
The more people who have access to your data, the more likely they are to use it effectively. The secret is making sure that these resources are easily accessible from anywhere at any time. Once you’ve established a foundation for success, you should begin working towards an ever-increasing level of automation, which will ensure that there’s always someone on hand to interpret the data for those who need it most—making your business as efficient as possible. Schedule a weekly Metric Digest so team members get a bite‑sized email of KPIs; it keeps non‑analysts engaged without overwhelming them.
Related: How to Position Automated Marketing Reporting To Your Clients
Choose the best tools for your needs
Choosing the best-automated reporting software for your business needs is crucial in order to save time and boost productivity. With so many available options, it can be difficult to determine which one fits your needs best. Here are a few key factors to consider when choosing the best tool for your business:
- Scalability: Your business is on the go, and your reporting should follow suit. This means that you should consider how scalable your selected tool is. It should be able to grow with your business by providing solutions that work for you now, but also later on when you have more data or more employees generating reports.
- Data Security: The last thing you want to worry about is making sure that the data you are collecting stays safe. When choosing an automated reporting tool, make sure it offers security features such as encryption, role-based access control and regular auditing of data activity.
- Performance: Depending on what kind of reporting tool you choose, some will have better performance than others. For example, if you choose a cloud-based solution with no local hardware requirements then users will be able to access reports from anywhere at any time – this might not be ideal if you don’t have reliable internet access or if multiple people need to access reports at once.
Free Automated Reporting Templates for Marketing and Sales
Once you’ve started collecting data through your various sales and marketing automation tools, it’s time to start analyzing that data – so you can make more informed decisions. Marketing Automation tools have extremely robust reporting capabilities that can help you understand the effectiveness of your campaigns. Since there are so many different report options available, it can be difficult to know where to start.
But don’t worry!
Databox created a free collection of 90+ Marketing Automation dashboards with all the major metrics you’ll need to assess your performance. Use these templates as-is or customize them to suit your needs.
- HubSpot Marketing Report
- Klaviyo Report
- Monthly Marketing Performance Report
- Outreach (Prospect Overview) Report
- Drift Conversations Insights Report
- HubSpot Sources Report
HubSpot Marketing Report
In addition to tracking your marketing metrics, HubSpot Marketing Dashboard does something very special: it allows you to see how your team is performing together. The report provides instant snapshots of over 140 key marketing metrics, including traffic sources, social media performance, and lead generation funnels across all stages of the sales cycle — all in one place.

Klaviyo Report
Use this Klaviyo Dashboard Template to track open and click rates, subscribers growth, email performance in real-time, and more. With just a few easy steps, you can set up your own dashboard to track and measure your email marketing performance in real-time.

Monthly Marketing Performance Report
The monthly Marketing Performance Dashboard is the most comprehensive way to track how each traffic source is contributing to your bottom line. A well-planned and regularly updated marketing dashboard such as this one can help you measure month-over-month progress toward your end goals. We suggest using this template as a starting point for your custom report.

Outreach (Prospect Overview) Report
This is a very easy-to-use marketing template that offers you the ability to track and assess the impact of your outreach in real-time. In addition to tracking the number of times you contact your prospects and how they engage with your outreach, you can also track the percentage of your prospect list that did not receive an email from you. This will allow you to easily see if any segments of your prospect list are not being reached by your messaging. If a large percentage of your list is not receiving your emails, then you may need to adjust the frequency or type of messages.

Drift Conversations Insights Report
This Drift dashboard template is a great asset for businesses that want to set up automated reporting systems to help monitor sales performance and sales tea activity. The main advantage of this template is that it provides everyone in your team with an insight into the activity of your customers and prospects, helping you consolidate salespeople and support agents’ activity in one view.

HubSpot Sources Report
One of the best tools to help you to monitor all stages of your inbound marketing efforts is the HubSpot’s Sources Report Dashboard, which enables you to track how visitors move through your funnel based on how they found your site (e.g., from a link on another site versus from an organic search). This dashboard will allow you to filter and view data based on specific sources, mediums, and campaigns.

Automate Reporting with Databox
The first step to automation success is having the right tools and marketing dashboard software at your disposal to assist you.
Databox is an end‑to‑end BI platform that centralizes, visualizes, and automatically distributes data stories to every stakeholder. This makes it easy for agency owners and business executives to connect their client’s data, visualize it in one place, build dashboards and reports, customize them in real-time, and serve their clients with personalized analytics that look great and perform smoothly on any device. Next to that, it also offers:
- AI‑generated slide narratives & goal status updates
- Master date‑range switch (updates every block in one click) Databox
- Report‑level brand styles you can save as defaults (released June 2025
“We cut weekly report prep from 4 hours to 15 minutes and finally got sales and marketing looking at the same numbers.”— Danielle Belanger, Premio
At the end of the day, automating your reporting setup is really a question of saving time. And if you ever want to scale your business goals, you’re going to need as much of it as you can get. Take a look at some of the major benefits that Databox can offer for your business and see for yourself how making a small investment today will pay off in the future.
Start a free BI trial—14 days, unlimited data sources.


