Table of contents
“Does this actually matter to clients? I am not sure if they will give a crap about this…”
You can already hear your account managers muttering this as you consider whether automated reporting will work at your agency.
And you can’t blame them! If they haven’t tried to automate their reports before, they are probably accustomed to KPI spreadsheets or Powerpoints filled with screenshots that make it difficult for clients to understand their own marketing data. In their mind, it is pointless to put more effort into a process that the client does not easily understand.
But, if you are looking to retain and grow your client base, you also know you cannot afford to have each account manager spend hours digging up data for a monthly report AND provide careful analysis. You need to choose one or the other. Automated reporting will allow you to provide more value to the client without hours of data extraction from all your digital services.
Before we go any further, let’s define “automated reporting”. Automated reporting is the process of delivering marketing data to the client on a regular basis with 0 marginal effort for each report. Whether the client wants daily, weekly or monthly reports, you will not need to spend any valuable time on copying and pasting data from different services. The data extraction is automatic. You set up the metrics that you want to track once, and they are delivered on a regular basis.
Of course, you will need to put in effort to choose the right metrics to track in your marketing dashboard for each client. That is when the questions from the account managers start rolling in.
So, here are 4 ways that both clients and account managers will benefit from automated reports.
1. Time To Analyze Client Data
This is the most common reason for eliminating manual reports. If you are not spending hours on copying and pasting from multiple systems and carefully formatting a monthly report, you can spend more time on analyzing client results for the same price.
So, when your account manager arrives at the monthly meeting, he or she can spend time on data-driven explanations of trends rather than simply reporting the numbers.
Jessica Janda from Weidert Group has used automation to maintain their high standards for reports in a fraction of the time.
“We used to build these absolutely beautiful reports in Keynote after manually extracting data from each service. They looked great, but they took SO MUCH time. Now, we can offer beautiful reports without the manual data entry.”

Brendon Macdonald from Yelloveedub combines a marketing dashboard software like Databox with Soapbox from Wistia to avoid typing out long, dry reports.
“I used to send long reports with screenshots from Google Analytics and other services. Clients would tell us that there was too much data and they needed to focus. Now, we track only the important KPIs in Databoards and send a quick video with our insights.”


A Soapbox example from Brian Moseley on our sales team
2. Data Is Easy To Understand
When you add screenshots from many different services into one presentation, the data quickly becomes confusing. Graphs have different y-axis scales. Some are based on raw numbers while others focus on rates. Others have trend lines.
Each digital marketing service has a specific method of presenting data. This may work well for the analytics experts in your agency, but it will not work in a monthly meeting. If you start using new digital services, your client will be even more stressed.
Also, you will not be able to present a consistent brand to clients with screenshots from different services. Although many agencies pride themselves on design, a recent survey of client-side marketers revealed that design/creative services are the number one place where agencies fall short.
By using marketing automation dashboards, you guarantee that data will be presented in the same way every month. You take the burden off the client and allow them to focus on analysis, not simple comprehension.

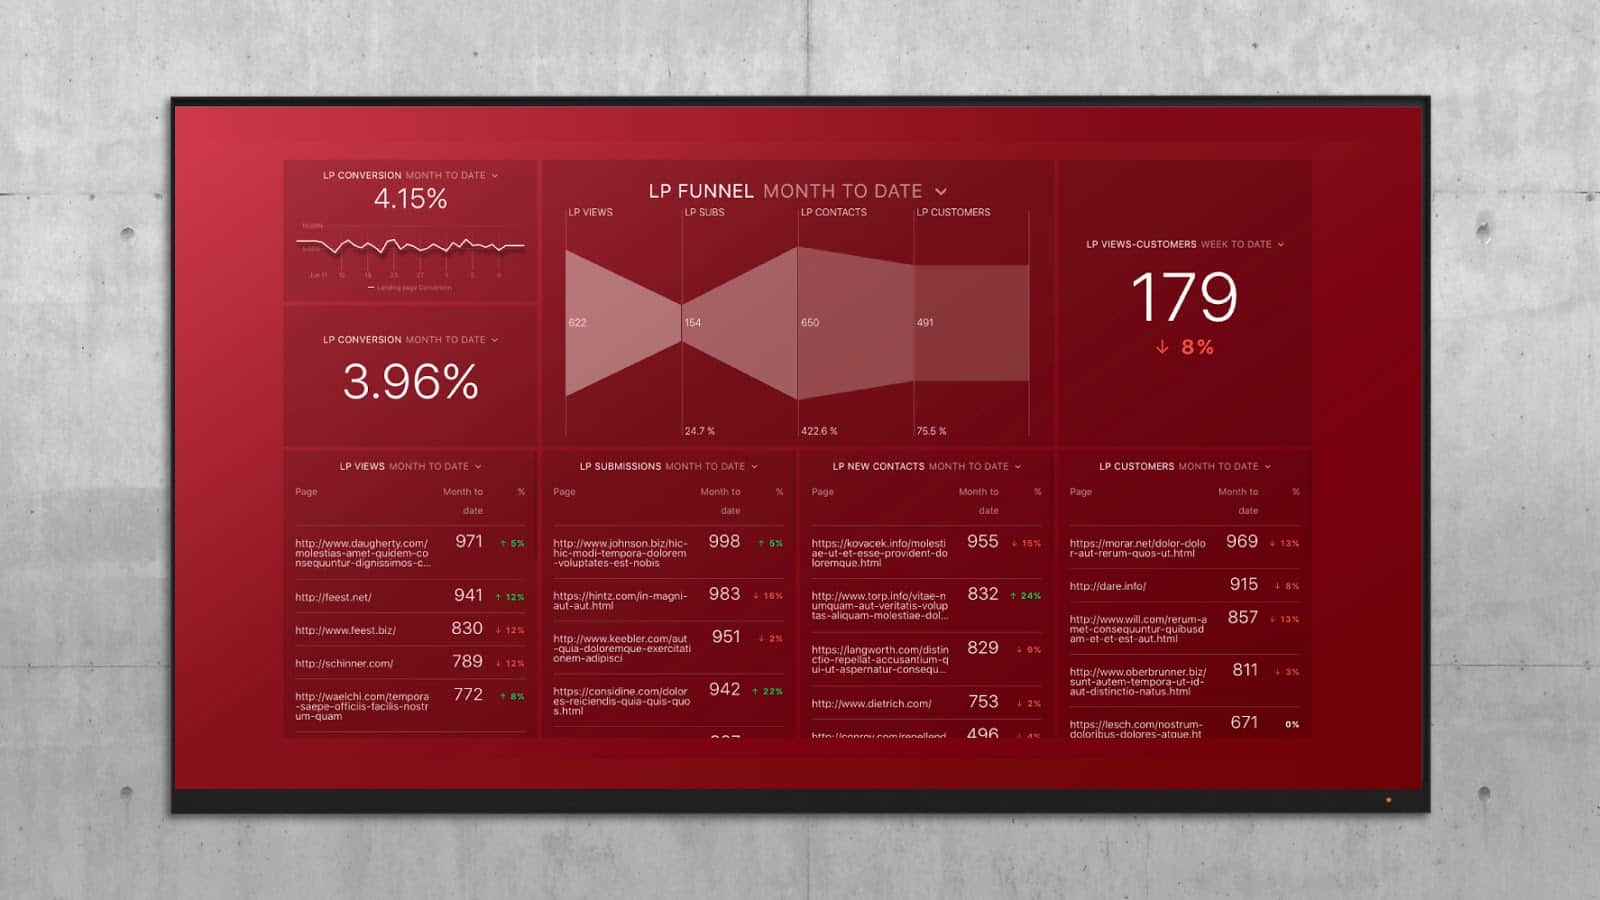
Example of a consistent presentation for all digital marketing data
Jessica from Weidert helps one client by formatting reports so they can be directly forwarded to the client’s boss.
“When we send data to the client, we send a link to a carousel, which is a group of performance dashboards. She loved that. She asked for one metric to add. Once we did, she was able to send it right on to her CEO. She did not need to change anything because she knew he would understand it.”

Parker Short from Jaxzen Marketing enjoys the ability to align data from separate digital marketing services and explain to the client.
“Being able to quickly pull data from a bunch of different sources was a big deal. It is very easy to integrate new services into our reporting process”

3. Real-Time Internal Decision-Making
If you only review marketing data once a month before a client meeting, you may find a nasty surprise that you will need to explain to the client, like an ad campaign that failed to run or a critical e-commerce error. Then you face an awkward conversation with no way to recuperate those lost days. If you want to be more agile, you need an easy way to stay on top of data in real-time.
With automated reporting, you can set up daily Alerts that fire when one of the client’s metrics takes a nosedive. So, if something goes wrong on the 14th of the month, you can catch it and make adjustments rather than learn about it 2 weeks later. You can then turn that into a positive story by the time you meet with the client.
Brendon from Yelloveedub has one client that focuses on Facebook Ads.
“This particular client needs weekly reports due to the dynamic nature of ads. The automated reporting process allows us to highlight the exact KPIs this client requires without the noise and distraction of multiple screenshots.”

4. Transparency with the Client
If you want to build trust with the client, you should be willing to share the ROI of your services. Here is a great way to start that conversation- ask them about their goals for the quarter or for the year. Then, calculate the leads and visitors that you need to generate to help them meet those goals.
After that, you can position your results around that quarterly or monthly goal. This affirms that you are aligned with their business objective. In fact, once you you set a goal with them, you can then mark that goal directly on the automated dashboard so the client knows you are serious.
You can also set up two sets of automated reports- more intricate reports for internal decision-making, and high-level reports for the client. That way, you can still share the metrics you are trying to improve without overwhelming clients.
Parker from Jaxzen uses a set of client tracking dashboards to provide explanations when the client wants to go deeper into specific results.
“We can have these secondary reports that give clients broader access to what is going on. We can spend more time digging into specific things we are seeing when needed.”

What Success Looks Like
Here are a couple signs that your rollout has been successful:
- The client inquires about new metrics, and you need to tell them to slow down!
- The client asks if they can see metrics outside of monthly meetings, for example, on their smartphone.
- The client asks if they can put their metrics on a TV in their office
All of these are signs that the client is engaged around your results.
Build Momentum With One Client
If you want to run accounts more profitably and increase the chances of retaining clients, you need automated reporting. However, you also need to learn how your account managers and clients will react.
Every agency starts with one client. This may be a client that has been a long-time, stable customer, or it may be a client that has demanded more data-driven strategies in the past, which you could not satisfy at a reasonable price. You want to make sure that the reports you build for the first client will be applicable across multiple clients. You do not want to become a custom reporting shop that forces each account to come up with their own ideas.
After one successful rollout, share these reports with another wave of clients to ensure that your processes work across multiple accounts. Then you can make more data-driven marketing decisions on each account!


