


Table of contents
The software as a service (SaaS) industry straddles the line between product and service. You’re selling a product, but it functions as an ongoing service. As a result, you need to track a wide variety of metrics related to growth, sales, and customer satisfaction for the best chance at success.
If your SaaS business doesn’t already use dashboards to measure and analyze data, you’re missing out on their productivity benefits. Let’s learn more about SaaS dashboards and what metrics and KPIs you should monitor.
- What Is a SaaS Dashboard?
- Why Should You Use a SaaS Dashboard?
- Top 5 Saas Dashboards Examples Recommended by Experts
- Top KPIs to Include in Your SaaS Dashboard
- Build Your First SaaS Dashboard for Free
Time to get started.
What Is a SaaS Dashboard?
A dashboard, also called a databoard, is a data visualization tool that displays your most important metrics in one place. It can include data representations like:
- Line graphs
- Pie charts
- Bar graphs
- Tables
- Numbers and number comparisons
- Funnels
- Pipelines
- Progress bars
- Gauges
Most dashboards feature different but related metrics that you can analyze together. For example, you could make a dashboard with time tracking metrics across your team so you can see them all in one place. Or, you could pull data from different ad platforms to look at your overall ad performance.
Why Should You Use a SaaS Dashboard?
What sets a dashboard apart from a good ol’ fashioned spreadsheet or report? Plenty. When you use a dashboard for your SaaS business, you’ll enjoy these benefits:
- Visualization: Dashboards translate data from multiple sources into graphs, charts and other visualizations that make it easy to compare them.
- Consolidation: You’ll have all of your top metrics accessible in one place, saving you time and effort.
- Real-time info: No need to wait for monthly reports — check your dashboard at any time for real-time updates on your data.
- Data-first workflows: When you integrate databoards into your daily workflow, you’ll encourage a data-driven culture at your organization where everyone can use data to improve.
In conclusion, the importance of dashboard in your SaaS business cannot be overstated. When you use the right databoards for your SaaS organization, you’ll have more accessible data and more efficient analyses. For example, relying solely on a stacked bar chart in Google Sheets might not be sufficient because it lacks the dynamic and interactive features that a dedicated dashboard offers.
PRO TIP: Are You Tracking the Right Metrics for Your SaaS Company?
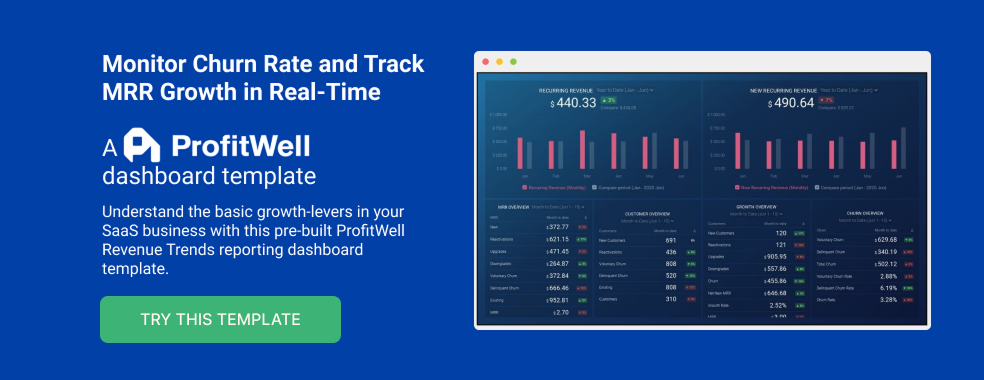
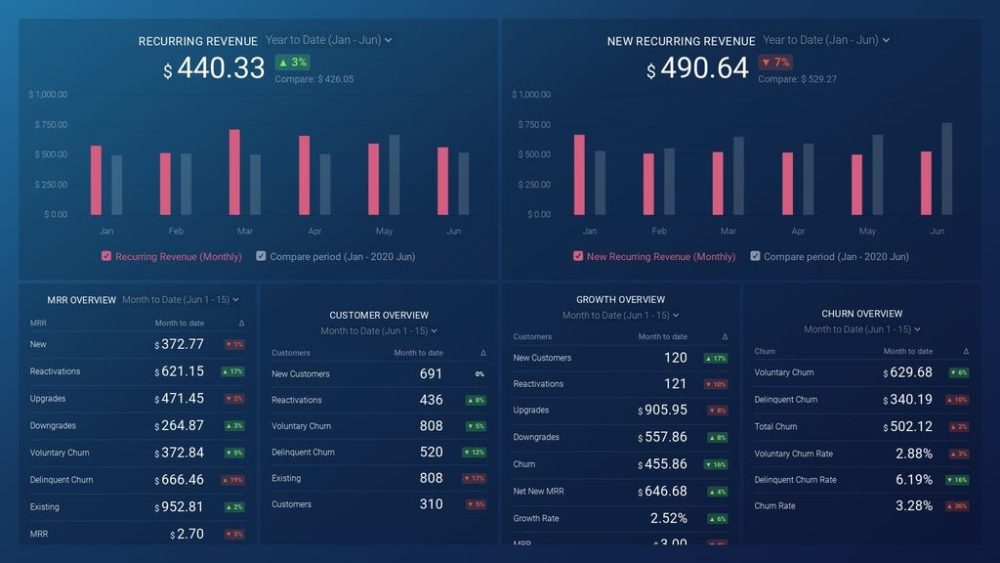
As a SaaS business leader, there’s no shortage of metrics you could be monitoring, but the real question is, which metrics should you be paying most attention to? To monitor the health of your SaaS business, you want to identify any obstacles to growth and determine which elements of your growth strategy require improvements. To do that, you can track the following key metrics in a convenient dashboard with data from Profitwell:
- Recurring Revenue. See the portion of your company’s revenue that is expected to grow month-over-month.
- MRR overview. View the different contributions to and losses from MRR from different kinds of customer engagements.
- Customer overview. View the total number of clients your company has at any given point in time and the gains and losses from different customer transactions.
- Growth Overview. Summarize all of the different kinds of customer transactions and their impact on revenue growth.
- Churn overview. Measure the number and percentage of customers or subscribers you lost during a given time period.
If you want to track these in ProfitWell, you can do it easily by building a plug-and-play dashboard that takes your customer data from ProfitWell and automatically visualizes the right metrics to allow you to monitor your SaaS revenue performance at a glance.
You can easily set it up in just a few clicks – no coding required.
To set up the dashboard, follow these 3 simple steps:
Step 1: Get the template
Step 2: Connect your Profitwell account with Databox.
Step 3: Watch your dashboard populate in seconds.
Top 5 Saas Dashboards Examples Recommended by Experts
We consulted 17 SaaS professionals about the data dashboards they consider essential in the industry. The majority, 88.2%, work directly at SaaS companies, while agencies and investors that work with SaaS organizations made up 5.9% each.

Most of these experts have used databoards for at least a year. While 64.7% of them have 1 to 5 years of experience with dashboards, 17.6% have more than 5 years of expertise.

More than half of the professionals we surveyed use dashboards for key metrics, growth, marketing, customer metrics and sales. Approximately 30% use financial and user experience dashboards.

When we asked what dashboard they would choose for a SaaS business if they could only pick one, the experts we consulted named these five dashboards:
- Customer retention dashboard
- Monthly recurring revenue (MRR) dashboard
- Net revenue retention (NRR) dashboard
- Sales dashboard
- Web analytics dashboard
1. Customer retention dashboard
The SaaS industry’s subscription model requires you to stay on top of your customers’ reception to your product. Customers who continue using your software contribute to ongoing profits and a more stable business. A customer retention dashboard helps you track how many customers stick around to indicate your revenue’s overall health.
“The customer retention rate dashboard would be my pick for the most essential dashboards in any SaaS business,” says Sally Stevens of FastPeopleSearch. “The phrase ‘customers are always right’ is most important in any SaaS business.”
Stevens continues, “Having long-term loyal customers is a sign of brand trust. The customer retention rate dashboard will ultimately give you insights into customer satisfaction, and the things that need improvement in order to reduce customer churn.”
Some of the most important customer retention metrics to keep an eye on including your customer loyalty rate, customer churn rate, and user frustration rate.
Try using Databox’s Customer Success Overview Dashboard as part of your customer retention databoards. It combines service and revenue metrics to help you see how your service affects churn — the number of customers you don’t retain every month.

2. Monthly recurring revenue (MRR) dashboard
Monthly recurring revenue (MRR) refers to the regular income you can expect to get from your SaaS subscriptions every month. It’s the backbone of every SaaS organization’s profits, so it’s a no-brainer to use a databoard to track it.
“The dashboard I would choose as an essential for SaaS is monthly recurring revenue,” Ravi Parikh from RoverPass confirms. “MRR is an essential dashboard because it doesn’t just show how successful your business is right now. It helps you predict how successful it will be in the future.”
“By taking a snapshot of what your customers are paying month to month for your software, the MRR dashboard can effectively answer questions such as: ‘Are we onboarding enough new customers? Are we effectively upselling our products? Are we generating consistent revenue streams?’ I make sure to include it in every one of our quarterly reports,” Parikh concludes.
MRR analyses work well when you compare them to customer activity data. Try the Stripe (MRR & Churn) Dashboard for Databox if you want to see your MRR in comparison to customer churn.

3. Net revenue retention (NRR) dashboard
Net revenue retention (NRR) captures the recurring revenue you keep over a given period. It gives you a nuanced look at your MRR that accounts for upgrades, downgrades, and churn.
Dan Rua from Admiral: The Visitor Relationship Management Company explains it this way: “[NRR measures] the percent change in revenue from all customers in a rolling cohort, typically looking at a change of 12 months — including expansion, contraction, and churn of each cohort. That single number — preferably over 100% but as high as 130-150%+ for SaaS beasts — speaks to product/market fit, stickiness, scale potential, and ultimately enterprise value of a SaaS business.”
How does NRR come into play at Admiral? “NRR has been a particularly valuable metric for Admiral because of our multi-module ‘land & expand’ approach to Visitor Relationship Management (VRM) — reminding us that it’s not just about closing customers and moving on, but instead increasing our value to customers over time — and that results in consistent growth and solid NRR,” Rua says.
In other words, while MRR shows you if you’re getting consistent revenue, NRR demonstrates if you’re increasing those ongoing profits sustainably.
The Profitwell Revenue Trends Dashboard explores multiple aspects of your MRR to help you calculate metrics like NRR. Give it a shot if you’d like to start tracking your ongoing revenue.

4. Sales dashboard
Sales databoards include information critical to gaining and retaining SaaS customers. Since the sales field covers so many practices, these dashboards come in all sorts of forms.
You might use them to track metrics and trends like:
- Your highest-priority sales KPIs
- Sales rep performance
- Sales forecasts
- Competitor performance
- Overall pipeline performance
“For me, the sales dashboard is the heartbeat of the company, as it shows attrition rate, new client onboarding rate, and everything else you need to keep an eye on churn and your business as a whole,” says Rich Kahn from Anura Solutions. “Especially for a SaaS company, all of these moving parts are crucial, and that’s why the sales dashboard is the most essential dashboard I use.”
Think about the sales metrics that you keep coming back to and consider turning them into your company’s heartbeat — your main sales dashboard.
Looking for an all-rounder sales dashboard to get you started? The Pipeline Performance dashboard for Databox combines your sales and marketing data into a single pipeline to show you how those two parts of your business work together.

5. Web analytics dashboard
Today, most marketing happens online, with an organization’s website at the center of its marketing. This rule especially applies to SaaS businesses competing in the tech industry.
At Breadnbeyond, Andre Oentoro considers their web analytics dashboard a top priority. “A website is our primary vehicle for sales and prospecting. So, monitoring the traffic, visitor analysis and behavior, and other metrics regarding the website is really important to us,” Oentoro says.
Most web analytics databoards pull from platforms like Google Analytics to display page views, link clicks and user behavior. More popular website engagement metrics to measure include bounce rate, average session duration and returning visitors.
Consider also analyzing your web metrics in an attribution report alongside your dashboard to see which parts of your website make the most impact on subscriptions.
Databox users can use the Google Analytics Website Engagement Dashboard to get a broad overview of their website metrics. It provides an audience overview, user counts, top pages and many other metrics to help you understand your website performance at a glance.

Top KPIs to Include in Your SaaS Dashboard
We’ve already covered some of the most important KPIs to cover in your dashboard by way of dashboard type. Some more critical KPIs for SaaS dashboards include:
- Signups: The number of people who sign up for your software subscription
- Product-qualified leads (PQLs): Customers who have a high chance of becoming paying customers
- Organic vs. paid traffic ROI: The return on investment you get from non-paid traffic vs. paid traffic like ad visitors
- Conversion rate to customer: The rate that you convert leads/free users to paid users
- Average revenue per account: The average amount of money you earn per user
- Customer acquisition cost (CAC): The average amount of money you pay for sales and marketing to close a deal
- Net promoter score: The likeliness that customers would recommend your business to others
- Customer lifetime value (LTV): The total revenue you expect to earn from a customer’s time as a paying subscriber
You can learn about these metrics and others in our blog post on important metrics for SaaS companies to track. Great inspiration for your next databoard!
Build Your First SaaS Dashboard for Free
Now that you know what goes into a SaaS dashboard, it’s time for you to build your own. Did you know that you can get started for free?
Create your Databox account for free today to begin capturing your metrics in dashboards. You can work with three data sources at no cost.
Need help building a SaaS databoard? The first one’s on us.


