


Table of contents
Understanding your website traffic is crucial for optimizing your online presence, growing your audience, and improving conversions. Google Analytics 4 (GA4) is a powerful tool that provides detailed insights into where your visitors come from, how they interact with your website, and which channels drive the most traffic.
Unlike its predecessor, Universal Analytics, GA4 is built for the future of analytics, with advanced features like event-based tracking, AI-powered insights, and cross-platform measurement. By using GA4, you can easily track website traffic across various sources such as organic search, social media, email campaigns, and paid ads.
In this guide, we’ll walk you through the process of tracking website traffic using Google Analytics 4, analyzing your data, and leveraging advanced tools to simplify reporting and gain actionable insights. Whether you’re a beginner or a seasoned marketer, you’ll learn how to make the most of GA4’s robust features to grow your website traffic effectively.
- How to Track Website Traffic
- How to Analyze Your Traffic Data in Google Analytics 4
- How to Analyze Your Traffic Data in Databox
- Google Analytics Traffic Report Templates
- Streamline Your Google Analytics Tracking & Analysis Process with Databox

How to Track Website Traffic
Determining where your website traffic originates can seem overwhelming, especially if you’re new to analytics. Understanding which channels are driving visitors—whether it’s organic search, social media, paid ads, or referrals—is key to optimizing your strategy and achieving your goals.
In this section, we’ll break it down step by step, highlighting the exact reports you should focus on in Google Analytics 4 to easily track website traffic without confusion. From identifying your top-performing channels to uncovering specific traffic sources, you’ll learn how to gain actionable insights into your audience behavior and the domains driving traffic to your website. Understanding the performance of referral domains or external sources can help refine your marketing efforts and grow your online presence.
Google Analytics 4
If you’ve already migrated to Google Analytics 4, you can find your website traffic report by going to Acquisition > Traffic Acquisition.

In GA4, the Source/Medium data is automatically revealed and you won’t have to open any additional tabs to find it.
Depending on what you want to track here, you’ll have to set up comparisons (more about that in the following section).
GA4 simplifies traffic tracking by consolidating key metrics into a user-friendly interface, allowing for better visibility into your most important data.
Related: Google Analytics 4 Custom Dimensions 101 Guide
Databox
There’s no doubt that GA4 has done a great job of simplifying the traffic reports in the new platform, making it a lot easier to track where your users are coming from and later analyze that data.
However, there are still quite a few alleyways and detours that might cause confusion.
With Databox, this same process is like an open highway.
You can track all of your most important traffic metrics in one comprehensive dashboard and monitor changes in real-time.
Here are the 3 easy steps you can follow to track your traffic in Databox:
1. Connect Your Data
Connecting Google Analytics 4 to your dashboard takes literally seconds.Just go to Data Sources, choose Google Analytics or GA4, and click on “Connect Now”.
We have 100+ other integrations available and you can combine different data sources if you want to track metrics from several tools in one place.
Each integration comes with the most popular metrics and their visualizations already built in, but we also have a range of custom metrics available, and ultimately, depending on your needs, we can even build custom metrics for you.
2. Build Your Dashboard
Once you connect your data source, you can use the Dashboard Designer to drag-and-drop the traffic metrics you need and organize them how you see fit.

You can visualize the metrics with just a few clicks and customize each block in the dashboard, without any coding or design knowledge whatsoever.
We have 300+ pre-built templates available (we’ll show you some of the best ones for Google Analytics traffic in a minute) but you can also create a dashboard from scratch.
3. Share Your Dashboard
Does your team frequently lose track of shared spreadsheets and report screenshots?
This is a common occurrence in many companies, especially when data needs to be pulled out manually and organized in multiple sheets or data sources.
Databox eliminates this issue and you can automate the reporting process in just a few minutes.
You can send customized reports specific to each department’s needs by looping dashboards together and scheduling when and how you want them to be sent.
How to Analyze Your Traffic Data in Google Analytics 4
Google Analytics 4 offers a ton of insightful reports, allowing you to measure critical metrics like user engagement, traffic sources, and conversion rates. To get the most out of these reports, you’ll need to know which dimensions and filters to use.
And while there is no one-size-fits-all solution to analyzing traffic in GA, here are some of the reports and best practices that most companies use during analysis.
PRO TIP: Save Time Creating Your Google Analytics 4 Traffic Dashboard
Yes, you can DIY in Google Analytics 4, but what if you would prefer a simpler, easier route? After all, once you learn how it’s done, you still have to choose the right metrics and design your custom dashboard to answer the important questions your stakeholders have, for example:
- How many people are visiting my website?
- Which channels bring in the most users?
- How engaged are my users?
- How well is my website keyword optimization performing?
and more…
Now you can benefit from the experience of Google Analytics experts, who have put together a great Databox template showing all the most important website traffic KPIs. This template allows for easy integration with scheduled report delivery. It’s simple to implement and start using as a standalone dashboard or in marketing reports!
You can easily set it up in just a few clicks – no coding required.
To set up the dashboard, follow these 3 simple steps:
Step 1: Get the template
Step 2: Connect your Google Analytics 4 account with Databox.
Step 3: Watch your dashboard populate in seconds.
Google Analytics 4
In GA4, the report where you track overall traffic (Acquisition > Traffic Acquisition) is the same place where you can find channel data for analysis. you can access consolidated traffic data in a single report, eliminating the complexity of navigating multiple views.
However, you do need to customize and filter the data through different comparisons if you want to get more granular.
If you want more detailed data on a certain part, just hover your mouse over the graphs.

Below the fold, there’s a detailed breakdown of all channel groups (or session source/medium data depending on how you’ve set your GA4 account) alongside a few customizable elements.

This data shows you exactly where traffic is coming from (e.g. Organic), data is presented in an updated format for enhanced usability.
But sometimes, you might run into a ‘Direct/None’ value. This appears when GA4 doesn’t have any information on those visitors and can’t attribute them to a specific source.
Another thing that might be confusing is the ‘Not set’ value. This means that the keyword dimension for that direct traffic isn’t filled and the keyword data is unknown.
You can fix both these issues with URL tags that will help GA4 track the users back to their entry point.
Related: How to Track Conversions with Google Analytics 4: 7 Best Practices
Another good tip here is to customize the information that appears in this part of your traffic acquisition report.
To get more information on each category, just click the ‘+’ sign to insert an extra row and get granular with the information that’s important to you.
For instance, if you want to check which browser your visitors are using, you can add a ‘Browser’ section.

Depending on what you want to see in your traffic acquisition report, you can customize it by adding different comparisons at the top until you have a comprehensive view of your most important traffic data.
In the picture below, you can see an example of a report with an ‘Country’ comparison built in.

GA4’s comparison feature allows you to create custom views of your data, offering improved flexibility and usability compared to older analytics tools.
Pro Tip: Are You Successful at Attracting Website Visitors from Different Channels?
To better understand how your website performs in terms of customer conversion and acquisition, you probably use Google Analytics 4 to learn how people are finding your website, what your most profitable traffic sources are, and how successful specific marketing campaigns are in attracting website visitors. You may have to navigate multiple areas and reports within GA4 to get the data you want though. Now you can quickly assess your website performance in a single dashboard that monitors fundamental metrics, such as:
- Total users by country. Where are your website users coming from? By mapping out your customers, you can adjust your strategy to determine which tactics work best with a specific demographic.
- Users by source. Which channels drive the most traffic? Stay focused on the marketing channels that are driving the best results and make adjustments to those that are underperforming.
- New users. How many new users visit your website? Track how many new users your website attracts during a certain time period.
- Total revenue. How much revenue has your website generated? Monitor this metric to make sure you’re acquiring new customers, and that your conversion rate numbers are increasing.
Now you can benefit from the experience of our Google Analytics experts, who have put together a plug-and-play Databox template that contains all the essential metrics for understanding how successful you are at attracting visitors from different channels. It’s simple to implement and start using as a standalone dashboard or in management reports, and best of all, it’s free!

You can easily set it up in just a few clicks – no coding required.
To set up the dashboard, follow these 3 simple steps:
Step 1: Get the template
Step 2: Connect your Google Analytics 4 account with Databox.
Step 3: Watch your dashboard populate in seconds.
How to Analyze Your Traffic Data in Databox
In Google Analytics 4, you can create more comprehensive reports if you know how to navigate custom dimensions and filters, but this was always considered an advanced feature reserved for more experienced marketers.
This changed in Google Analytics 4 with the introduction of comparisons. Now, it’s pretty much a necessity to know how to implement comparisons in order to get the most out of your data. The upside is that the customization options are a lot easier to learn now.
However, organizing the metrics and visualizing your most important KPIs is just as messy as it used to be.
There’s only so much you can fit in a single report, you can’t combine metrics from unrelated reports, it takes up a whole day to visualize the data… you end up spending more hours compiling data than actually analyzing it.
With Databox, you won’t have to deal with these issues anymore.
You have a lot more flexibility in combining the metrics you want to track, visualizations are just a few clicks away, you can get as granular as you want with your traffic KPIs, and you can integrate metrics from other tools to get the full picture of your performance.
In a matter of minutes, you can build a comprehensive report with all of your key information and have it ready for analysis.
Depending on which metrics you include, you can conduct granular analysis for:
- Organic traffic: Monitor data like the number of organic sessions you’re generating, the number of unique users, the best-performing landing pages, which devices organic visitors use, and more.
- Traffic sources: Track metrics that show you where the most valuable visitors come from, which marketing channels are performing the best, which channels need to be optimized, which campaigns have been the most successful, and more.
- Blog traffic: You can also zero in on specifically your blog traffic and track data like which keywords are driving the most visitors, which blog posts are the most popular, what’s your average ranking position, and more.
- General traffic overview: Monitor the overall number of sessions in a specific time frame, which channels are generating which % of traffic, which social networks are driving the most qualified visitors, what devices visitors use, and more.
The point is, customizing your report and preparing it for proper analysis in Databox doesn’t come with any restrictions or limitations.
You can combine metrics from several tools, visualize your metrics, and create reports that highlight key insights, such as page traffic, user engagement, and channel performance. This allows you to craft compelling data stories rather than simply presenting a collection of dry numbers.
Related: The 16 Most Useful Google Analytics Reports (Recommended By Experts)
Google Analytics Traffic Report Templates
Even though Google Analytics does provide users with various traffic reports, they simply aren’t very intuitive, especially if you don’t have much experience analyzing traffic in GA.
You can save both time and nerves by automating the process with report templates that come pre-built with some of the most popular GA traffic metrics.
Here are some of our most popular templates that you can download for free:
- Google Analytics Website Traffic & Engagement Report
- Google Analytics Organic Traffic Report
- Google Analytics Traffic Growth Report
- Google Analytics Traffic Source Breakdown Report
- Blog Traffic Distribution Report
- Mobile vs. Desktop Traffic Report
- Google Analytics 4 Audience Overview Report
- Google Analytics 4 Acquisition Overview Report
Google Analytics Website Traffic & Engagement Report
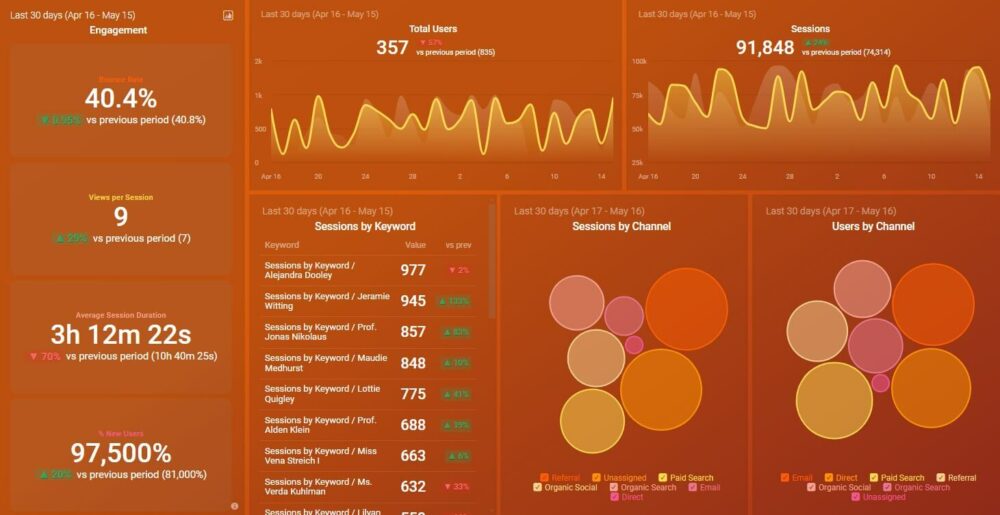
The Google Analytics Website Traffic & Engagement Report provides you with a birds-eye overview of your most important traffic and engagement metrics, like the number of unique visitors, total visitors, returning visitors, bounce rate, average time on page, and more.

You’ll know immediately how your website is performing and converting, without the hassle of searching for data in multiple reports.
Some of the main things you’ll learn are:
- Where website traffic is coming from
- Whether there’s an increase in traffic compared to a specific past period
- Progress toward hitting your set goals
- Which search queries drive people to your website
- Which channels are generating the most traffic
- Which pages have the highest bounce rates
And a lot more.
Google Analytics Organic Traffic Report
If you want to zero in on organic traffic and monitor the overall engagement your website is getting from search engines, you can download the free Google Analytics Organic Traffic Report.

This report contains a snapshot of key organic traffic metrics like sessions, users, pages per session, bounce rate, and more.
Use it to find out:
- The total number of organic sessions your website is generating
- The total number of unique visitors you’re generating organically
- Which landing pages generate the most organic traffic
- Which devices do organic visitors use the most
- The engagement level of organic visitors
Google Analytics Traffic Growth Report
The Google Analytics Traffic Growth Report provides deeper insight into what’s going on with your website traffic, including referral traffic from external websites and how different channels are contributing to overall traffic growth.

Some of the main things you’ll learn include:
- How many people have visited your website in X time
- Which digital channels are driving the most traffic
- Which websites are the main referrers to your website
- Which social networks are generating the most traffic
- Traffic quality for each channel
Google Analytics Traffic Source Breakdown Report
Want a full breakdown of your traffic segments?
This free Google Analytics Traffic Source Breakdown Report shows you where your website visitors come from, which channels generate the most valuable traffic, and which campaigns have been the most successful.

Download this free report and check out:
- What are the best-performing traffic sources are
- Bounce rates for each marketing channel
- Number of sessions for each marketing channel
- The average length of site visits for each channel
- Which channels drive the most engagement
- Which pages attract the most organic traffic
- How do new and returning visitors interact with the website
Blog Traffic Distribution Report
The Blog Traffic Distribution Report is a great tool to pinpoint your website’s top-performing articles in organic search and check out exactly how much traffic they are generating.

This report template also works great with SEMRush and similar keyword research tool integrations since you can track key metrics like keyword rankings, visibility trends, site errors, estimated traffic, and similar metrics in one place.
Other things you’ll learn include:
- Which keywords are driving the most traffic to your blog
- Which blog posts are the top performers and are driving the most organic traffic
- Immediate insight into sudden traffic dips
- Average keyword ranking position
And a lot more.
Mobile vs. Desktop Traffic Report
To drill into both your mobile and desktop traffic data, and find actionable insights that will help you further optimize user experience, you can use the Mobile vs. Desktop Traffic Report.

Download this report to find out how both mobile and desktop visitors interact with your website and use that information to make data-driven decisions regarding future optimization.
Learn things like:
- Which device do your top-converting visitors prefer
- How much of your traffic comes from a specific device type
- How does mobile traffic performance compare to desktop traffic performance
- How many pages do mobile visitors view on average
- What’s the bounce rate across devices and browsers
- The average session length across devices and browsers
Google Analytics 4 Audience Overview Report
If you’ve already transitioned to GA4 but still have some trouble adapting to the audience analytics, you can use the free Google Analytics 4 Audience Overview Report to streamline the process.

This template provides you with an at-glance overview of your website audience data and key user information such as location, engagement, and common devices.
Once you connect your GA4 account, you’ll learn:
- Audience demographics data (e.g. where most of your visitors are based)
- Which device does the majority of your audience use
- Which channels are driving the most traffic
- Which channels are responsible for the top-converting visitors
- How much traffic are you generating in a specific time frame
Google Analytics 4 Acquisition Overview Report
For a complete overview of your traffic sources, user behavior analytics, and insight into how it all affects your revenue, you can use the Google Analytics 4 Acquisition Overview Report.

Here are some of the main things you’ll learn with this template:
- Which acquisition tactics are working with each specific demographic
- Where are your website visitors coming from
- Which channels generate the most traffic
- What’s the ratio between new and returning visitors
- What’s the total number of unique visitors
- How is the traffic affecting your overall revenue
Streamline Your Google Analytics Tracking & Analysis Process with Databox
With Google Analytics 4 as the current standard, there’s only so much flexibility the platform offers for efficient reporting.
Sure, GA4 has made the process more user-friendly with some new customization features, but it still takes a lot of time and effort to navigate through the different reports and combine the relevant data in one place.
There’s simply not enough flexibility for businesses that prioritize data analysis and base their decisions on the actionable insights extracted from that data.
So why waste time and nerves when there’s a simpler alternative?
Databox can help you truly streamline both tracking and analysis of your traffic data.
We offer seamless integration with Google Analytics 4, allowing you to pull up your most important traffic data onto one comprehensive dashboard in a matter of minutes.
You can create a compelling story with your data, visualize the metrics in just a few clicks, and then analyze the data without spending countless hours on preparation.
And if you use any other tools alongside GA, you can find it in our 100+ integration library and pull out metrics from them as well onto the same report.
You can either build a dashboard from scratch or download one of our pre-built dashboard templates and customize them further based on your specific goals.
For those of you that migrated to GA4 but are still struggling to make sense of your performance data, we have a free GA4 setup service where you can contact our team to build you a dashboard and help you analyze the data.
Overall, staying on top of your traffic and transforming dry KPIs into meaningful reports has never been easier.
Sign up for a forever-free account and take control of your traffic data with Databox.


