


Table of contents
The time when picking a salesman for your business was based on whether they’ve ‘got it’ or not is long gone. Nowadays, we have CRM tools that allow us to closely analyze their performance.
Additionally, we can also integrate these tools to examine the sales pipeline and each stage that it includes. This provides us with data that we can use to optimize the overall sales process and recognize which areas need to be improved.
One of the best CRM tools for analyzing the sales pipeline is – Pipedrive.
Pipedrive is an easy-to-use CRM tool that closely examines all stages in a sales process and helps us understand the factors that led to won or lost deals.
In this article, we are going to focus on this tool’s reporting feature and show you how to customize and leverage your reports in Pipedrive.
- What is Pipedrive?
- What is a Pipedrive Report?
- Pipedrive Report Types
- X Ways to Customize and Leverage Pipedrive Reports
- Pipedrive Reporting Limitations
- Free Pipedrive Report Templates
- Monitor and Take Control of Your Sales Process with Databox
What is Pipedrive?
Pipedrive is one of the most popular CRM and account-management tools that helps businesses better understand and plan out their sales and marketing processes.
The software was developed by using activity-based selling methodology, which is why it can easily break down and visualize each step of a successful sale process (from conversion to closure). This can especially benefit smaller and mid-sized businesses since they will be able to improve the overall efficiency of their campaigns and avoid having to guess what went wrong.
Additionally, your sales team will gain insight into which actions to focus on in order to close deals with customers. The different sales pipelines can help salesmen maintain control over the most complex sales processes.
With the variety of sales reporting tools, Pipeline allows users to keep track of level targets, evaluate sales data, and create advanced visual reports.
Other useful features include email integration, goal monitoring, and sales forecasting.
Related: 10 Best CRMs For Small Businesses You Need To Try Right Now
What is a Pipedrive Report?
The reporting tool on Pipeline is one of its most notable features. You can use it to create Pipedrive reports that enable you to easily analyze the key performance metrics in your sales pipeline.
These metrics include:
- Project efficiency
- Insight data (deals in progress e.g.)
- Sales performance/closure indicators
Pipedrive reports can be presented in a few different ways – by users, stages, reasons, products, and status. The reports contain compact tables and visual tools that you can use to better understand your sales team’s performance.
Businesses can benefit from Pipedrive reports due to their ability to showcase both individual and team results, while also helping you recognize the areas that need improvement.
In short, Pipedrive reports are a great way to optimize your overall sales system and identify successful patterns.
Related: 12 Best CRM Reports You Can Build from Your CRM Data (Sourced from 50 Experts)
Pipedrive Report Types
Pipedrive reports include some of the most important data regarding your company’s overall sales process. You can either create your own reports or choose Pipedrive’s pre-formatted report generation.
No matter which option you choose, you should be able to differentiate the three different Pipedrive report types.
We’ll explain each one.
Activities Effort
Pipeline’s activities effort report measures the productivity and efficiency of your sales team through their completed activities.
These activities include Call, Deadline, Email, Lunch, Meeting, and Task.
The metrics included in the activities effort report are:
- Activities added
- Activities completed
- Emails sent
- Emails received
You can set the report to focus on your team’s overall performance, or if you want to find out which employee is generating the most sales leads, you can create individual performance reports.
Pipedrive Performance
To comprehend the full story behind your sales process, tracking activities won’t be enough. You have to be able to tell the difference between actual results and busy work that doesn’t really lead anywhere.
This is something that Pipedrive performance reports can help with. They allow you to monitor the status of the sales deals and understand the underlying purpose.
There are four types of performance reports, including:
- Deals started – Check the exact amount of deals your team launched, how they are progressing, and whether there are any linked products.
- Deals progress – A clear overview of each stage in your sales pipeline.
- Deal velocity – The average amount of time that passes until a deal is concluded won/lost.
- Deal conversion – Showcases how successful each stage of the sales pipeline is (the percentage of deals won/lost).
Later on, you can filter these reports for more granular data. Some of the options are users over time, deal stage, deal stage over time for individual performance, and deal stage over time for team performance.
Also, if you enable the product feature on Pipeline, you can also trace which products turn out to be the most successful and monitor their individual performance in specific periods.
Sales Performance
When it comes to analyzing your sales efforts, Pipedrive knows the one metric that counts the most is – the end result.
Pipedrive sales performance reports examine all the significant data and decisions that led to a deal being lost or won. The key metrics included are:
- Deals won – The exact number of deals won, value, and deals by user.
- Deals lost – The exact number of deals lost, the reasons behind it, and at which stage they were lost.
- Revenue forecast – Forecasts regarding the incoming revenue after examining the deals won and deals lost.
The biggest benefit of sales performance software, and reports generated from it, is that they make pattern recognition much easier. Once you generate enough data, you will be able to pick up the significant trends a lot faster.
Some of the questions you will acquire answers to include:
- At which month do sales tend to vary the most?
- Is there a specific point in the pipeline at which the deals get lost?
- Which steps do users make that result in a won deal?
Once you know the answers to these questions, you can make better sales strategies and use the information to maximize your generated revenue in the future.
PRO TIP: Monitor Your Sales Team’s Performance in One Dashboard
Smart Sales Managers know that to achieve your monthly and quarterly goals, you have to monitor your team’s sales performance on a daily, weekly, and monthly basis. To do that, you need an actionable dashboard that summarizes both team and individual sales rep metrics and allows you to:
- Understand the current sales pipeline.
- Track sales rep performance.
- Compare team results to revenue goals.
If you use the HubSpot CRM, you can benefit from the experience of our sales experts, who have put together a plug-and-play Databox template showing some of the most important metrics for monitoring your sales team performance. It’s simple to implement and start using as a standalone dashboard or in sales reports!
You can easily set it up in just a few clicks – no coding required.
To set up the dashboard, follow these 3 simple steps:
Step 1: Get the template
Step 2: Connect your HubSpot account with Databox.
Step 3: Watch your dashboard populate in seconds.
5 Ways to Customize and Leverage Pipedrive Reports
To acquire the best possible data analysis, you first have to organize your sales pipeline and the KPIs that come with it.
These are some of the best practices when it comes to customizing and leveraging your Pipedrive reports.
- Create your sales pipelines
- Customize activities
- Increase sales pipeline efficiency
- Categorize reasons for lost deals
- Forecast revenue
Create your sales pipelines
The first thing you have to do is create and define the pipelines in your sales process. Typically, a sales process consists of pipelines like online sales, product-related sales funnels, and inside/outside sales.
In Pipedrive, there are five default stages integrated into the sales pipeline, including:
- Qualified
- Contact made
- Demo scheduled
- Proposal made
- Negotiations started
To define new pipelines, you should click on ‘Create’ in Pipeline’s dropdown menu. In case you need to edit the existing pipelines, you can do that by pressing ‘Edit’.
When customizing a sales pipeline, add all the significant details but don’t overdo it by including unnecessary information.

Your main goal should be to recognize which milestones and stages in the process are the most important. People make the mistake of creating dozens of different stage pipelines, only to later realize that managing them is way too time-consuming.
Our recommendation is that you customize your sales process in five to eight stages.
Related: Sales Pipeline Report: How to Build One, What to Include In It, Benefits, and Best Practices
Customize activities
There are six activities in Pipedrive that appear by default, but it’s possible to create additional ones that are tailored for your company’s needs.

The ones you can see in the screenshot are presentations, reservations, and brainstorming activities.
Increase sales pipeline efficiency
To increase the efficiency of your sales pipeline, it’s important to be up-to-date on the average deal velocity. This is because B2C sales tend to have a much shorter timeline compared to B2B sales.

Once you break down your sales cycle’s overall length into different stages, you will gain insight into the exact stage in which the deals are won or lost. Later, you can use the information you gather to optimize your deal conversion rates and come up with better strategies.
Pipedrive can additionally help businesses with sales consolidation since all the relevant customer information can be tracked in a single CRM database.
Related: How Healthy is Your Sales Pipeline? 8 Strategies to Make It Stronger
Categorize reasons for lost deals
Of course, winning deals is great and it’s what every business strives for.
However, many overlook the importance of lost deals and the factors that led to them. Pipedrive has a feature that allows you to receive direct feedback from users on why they gave up on a deal, but for better information categorization, you should create predefined reasons beforehand.

Once you know the reasons for lost deals, you will know which areas in your sales pipeline need to be optimized, which will ultimately result in more won deals.
Forecast revenue
The last feature we are going to talk about is Pipedrive’s Forecast Revenue. This feature takes into consideration all the won, lost, and pending deals in your business and makes revenue forecasts based on that data.

While it’s impossible to calculate the exact number, the rough estimates do help executives make decisions regarding capital expenses, operating expenses, and taxes.
Additionally, the forecast revenue does a great job at predicting the outcome of pending deals, which results in more efficient budget planning.
Related: 10 Sales Pipeline KPIs to Track for Accurately Forecasting Sales
Pipedrive Reporting Limitations
Although Pipedrive is one of the best CRM tools currently on the market and it has some of the most advanced reporting features, it does come with certain limitations.
These limitations can easily be overcome by integrating Pipedrive with another reporting tool such as Databox. You can check out this page for additional information or connect Databox with Pipedrive immediately by signing up for a free account.
Let’s go through these limitations and explain exactly what are talking about.
- Enhanced Reporting
- Data Quality
- Marketing Analytics
- Per User/Dynamic Filters
- Custom Reporting
- Publishing Reports Automatically
- Sharing Reports Outside the Team
Enhanced Reporting
Enhanced reporting seems to be one of the main issues that users come across in Pipedrive. However, this isn’t something that only Pipedrive struggles with, most CRM tools have a problem simplifying custom reporting for their customers.
For instance, in Pipedrive it’s extremely easy to create additional fields of data (custom fields), but reporting these fields can get quite complex in case they vary from numeric fields to text fields. Creating an accurate dashboard that can report on these custom fields is hard, especially because the basic reporting tools don’t acknowledge them.
By integrating Databox, you will be able to use all the available APIs from Pipedrive and gather the data related to the custom fields and major entities (e.g. People, Organizations, Deals, Leads, and Activities). If you want you can also combine data from other data sources, Google Sheets or Excel.
Plus, all of these custom fields can be combined in a single report with only a few clicks of a button.
Data Quality
Another issue that you could face in Pipedrive is duplicated data. Although there is a ‘Merge’ feature that you can use to merge the duplicated data, it works only through human input.
Having duplicated deals appear in your sales pipeline and go unnoticed can ultimately result in bad data quality.
Databox can help with this since it allows users to consolidate all the different data such as people, deals, or activities and make custom data calculations.
Once you have this information in one comprehensive dashboard, recognizing duplicate data will also become much easier.
Marketing Analytics
While Pipedrive is undoubtedly one of the best CRM tools when it comes to sales analytics, it doesn’t really include any helpful tools for marketing analytics.
It is possible to monitor visitor activity through the web tracking module, but to acquire more advanced analytics, this needs to be combined with Google Analytics. This way, you can gather information on which page content is driving the most sales.
However, this whole process can be extremely overwhelming, especially since everything has to be done manually.
With Databox, all the data you gather will be collected in one place, which results in a more efficient marketing analysis.
Per User/Dynamic Filters
Pipedrive does a great job of gathering important metrics within sales pipelines and while the reporting feature does offer some flexibility, it’s still not sufficient for users that want complete control over their interactions, style, and overall data visibility.
Once again, Databox can create these data sets that users are in need of. Not only that, but it also includes many advanced visualization features that allow you to showcase the data through understandable graphs and charts.
Custom Reporting
The main reason why Pipedrive is a bit limited in custom reporting is that it is not its main area of expertise. Pipedrive’s primary goal is to help your sales team come up with more efficient strategies and optimize the overall sales process. Analytics and reporting are its secondary features.
Because of this, users won’t be able to do some advanced analytics such as identifying the average time spent on the website and visualizing it.
Building custom dashboards can be a whole lot easier with our DIY Dashboard Designer. This tool allows you to connect your Pipedrive account and pull out all of the most important metrics and visualize them in one place. Plus, you will already have 300+ prebuilt dashboard templates that you can customize to your specific needs, so you won’t have to go through the hassle of creating a dashboard from scratch.
And if you have even less time, our Customer Success team will be happy to create a dashboard for you for free. To get started, simply request your free dashboard via chat.
Publishing Reports Automatically
Pipedrive doesn’t include any automatic report publishing features. This means that if you want to stay on top of the latest updates, your sales team would have to go through the reports, filter them via department, and send them to you each day or week.
In the long term, this process ends up taking too much valuable time for both you and your team.
Instead, you can use Databox’s Alerts or Scheduled Snapshots feature to get notifications each day regarding the most important updates.
You can set up the exact time at which you will receive daily alerts for any type of data and metric changes. This allows you to stay on top of the numbers and take action in a timely manner.
Sharing Reports Outside the Team
Most businesses that integrate Pipedrive have reported having a hard time sharing the generated reports with team members that aren’t subscribed to Pipedrive.
And to be fair, not everyone needs the functionality that Pipedrive offers, especially the management or high-ranking members who only need the end reports and the data included in them.
Instead of having everyone buy licenses to access the reports, you can use Databox Scorecards. With Scorecards, you can choose specific KPIs and performance updates to be sent to either the whole company, specific departments, or even a few individuals.
Free Pipedrive Report Templates
While CRM tools such as Pipedrive are great for gathering data regarding your sales pipeline, tracking the overall performance can be much easier with dashboards.
Here are some free report template examples that you can try out.
- Pipedrive CRM Dashboard
- Pipedrive CRM Persons Dashboard
- Pipedrive CRM Deals Performance Dashboard
- Pipedrive CRM Organizations Dashboard
- Pipedrive CRM Activities Effort Dashboard
Pipedrive CRM Dashboard
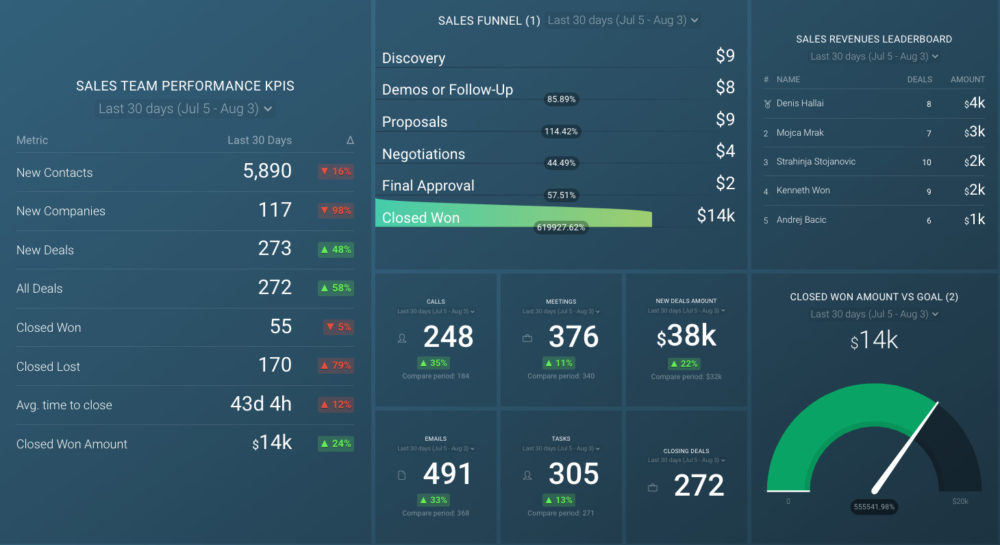
If you want to efficiently track the stages of your sales pipeline to see how deals are progressing, you can do so by using the Pipedrive CRM Dashboard.
This dashboard will provide you with a complete overview of your team’s activities and visually present all the important data generated in Pipedrive.
Some of the things you’ll learn include:
- The total value of the won deals
- The exact number of deals closed in a specific month
- How to monitor your sales performance
- Which sales representative is having the most success in handling the deals
- What causes lost deals
Additionally, you can also track metrics such as activities added, activities completed, calls added, new contacts, deals won, deals lost by reason, deals started, and dozens more.

Pipedrive CRM Persons Dashboard
The Pipedrive CRM Persons Dashboard provides you with granular insight into your persons, their activities, and numbers.
This free dashboard captures all the relevant data regarding your persons won/lost deals, complete/incomplete activities, and total activities for each individual.
Some of the metrics included are new contacts, total won deals by person, total lost deals by person, total persons count, total files by person, and much more.

Pipedrive CRM Deals Performance Dashboard
To stay on top of the most important sales KPIs in your business, you can download the free Pipedrive CRM Deals Performance Dashboard. The simple layout contains all deal performances in one comprehensive report.
Here is a summary of everything you will acquire through this dashboard:
- Live funnel that includes contacts, meetings, opportunities, and other metrics
- Detailed comparisons between months
- Overview of total team calls and emails
- Insight into which team members have won the most deals
- Automatic deal flow snapshots

Pipedrive CRM Organizations Dashboard
The Pipedrive CRM Organizations Dashboard focuses on providing users with a comprehensive overview of the organizations within your business, their activities, and numbers.
This easy-to-use dashboard can answer some common questions such as:
- What are the activities within my organization?
- How many won and lost deals were there in my organization?
- How many new organizations are there?
- How many organizations are you currently tracking?

Pipedrive CRM Activities Effort Dashboard
For gaining insight into the overall efforts, activities, and KPIs of your sales team, you can use the Pipedrive CRM Activities Effort Dashboard.
This dashboard helps you understand how your sales funnel looks through features like:
- Automatic deal flow and progress snapshots
- Live funnel overview containing contacts, meetings, opportunities, and other metrics
- Insight into which team members won the most amount of deals
- Month-by-month comparisons
The key metrics included are activities completed, won and lost deals, new contacts, organizations added, and count/amount of started deals.

Monitor and Take Control of Your Sales Process with Databox
Pipedrive is an extremely useful CMR tool that helps businesses better understand the key elements of their sales process by providing full visibility into the sales pipeline.
However, even though Pipedrive does offer some basic reporting features, analytics and reporting aren’t exactly its main strong suits. To make the most out of the data you receive from Pipedrive, businesses will have to integrate external tools.
If you want to take full advantage of Pipedrive’s data and display it through insightful and comprehensive dashboards, you should give Databox a try.
Databox allows you to connect all the significant KPIs from your Pipedrive account and display them through customizable dashboards. One of the main advantages of Databox is that you can connect multiple data sources and combine them in one report.
Not only that, but you will also be able to transform the data into understandable graphs and charts by using Databox’s advanced visualization tools.
Staying on top of complex sales processes and understanding your customer’s behavior has never been easier. Sign up for free and integrate your Pipedrive account with Databox to take sales reporting to the next level.


