
Already have an account? Sign in
Sign up for free
Connect your datasources and instantly see your data in this template.
Creating your account...
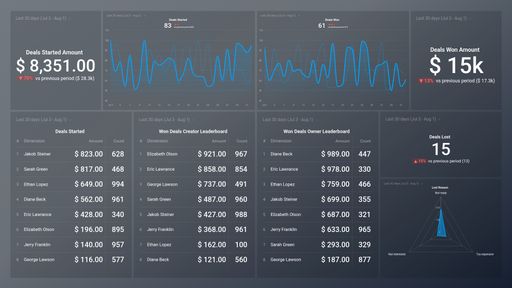
A Pipedrive dashboard functions as a sales performance control center, offering a visual and customizable overview of the entire sales pipeline. It presents real-time insights into sales activities, deal progress, and team performance, empowering data-driven decision-making to optimize sales strategies.
An effective Pipedrive dashboard should track key sales metrics such as Deals, Activities, Meetings, Calls, Emails, Contacts, and more. These metrics provide valuable insights into deal flow, sales team activity levels, customer interactions, and overall pipeline health, helping in the identification of bottlenecks and opportunities for sales growth.


Drag & drop your metrics
No-code editor
Fully customizable
Trusted by 20,000+ growing businesses


Explore all the different ways you can use Databox to gain better data insights needed to drive better business decisions. Discover our pre-built templates from various integrations that businesses use on a daily basis to improve performance.
Whether you are looking for client reporting dashboards, agency dashboards, marketing dashboards, or sales dashboards, Databox can help you build them.
Let us know what you are trying to build and our team of experts will help you turn your data into actionable insights.
Book a call


Connect your datasources and instantly see your data in this template.
Creating your account...