


Table of contents
Going from a rockstar sales individual contributor to a great sales manager requires a mindset shift. It is no longer about smashing your own quotas. Your role is now to manage and empower your sales team to smash theirs.
Sales reports allow you to get a pulse on how your team is performing, the overall health of your pipeline, and if you are on track to hit your sales goals. It’s no wonder that Sales is one of the top 3 most monitored and reported operations, according to Databox’s state of business reporting. The vast majority of time, sales reports should be written for senior sales executives as well as the C-Suite, as they are the ones primarily reading sales reports.
As reporting expectations increase, many teams are also looking for faster ways to interpret what their numbers actually mean. Instead of manually pulling data and drafting summaries, teams now use AI data analysts, like Databox MCP, to ask plain-English questions about performance and get answers based on their real metrics, definitions, and historical results. That makes it easier to understand why pipeline coverage changed, what impacted close rates, or whether current trends support the forecast, without relying on guesswork or surface-level summaries.

Nobody wants to read a lengthy sales report each week, month, or quarter, especially busy executives. That’s why choosing the right type of reporting practice is crucial. According to our research, most sales experts opt for either static reports or interactive dashboard solutions (like Databox).

But, what KPIs should you be track in your sales dashboard and share in these reports? In this post, we’re sharing the top sales reports that all sales managers should know about.
- Weekly, monthly or quarterly sales reports
- Net income report
- Conversion rate report
- Revenue by salesperson report
- Sales commission report
- Sales pipeline report
- Sales funnel analysis report
- Deals lost report
Let’s dig in.
1. Weekly, Monthly or Quarterly Sales Reports
This is almost too obvious to include, but you should have a revenue report that you produce weekly, monthly, or quarterly.
In fact, nearly 80% of the sales professionals we reached out to publish these revenue reports monthly.

“A monthly sales report helps managers assess the productivity and efficacy of a sales team,” says Paul Sherman of Olive. “By producing a report detailing the sales teams’ performance metrics, such as conversion rate, new leads, and customer lifetime value, managers can keep a pulse on how the sales team is functioning and where it could be improved. Managers can also identify trends over time, and don’t have to spend their time micromanaging their sales team. Instead, they can learn key insights from the report every month, and focus their efforts on other areas of the business that need more immediate attention.”
Jaya Aiyar of Créatif says, “In my opinion, a monthly sales report is one of the most critical sales reports for my business. It is because it can give you an accurate view of your company’s performance monthly. With that, you will be able to reassess your strategies and adjust them based on the result so you can improve the next month. Moreover, you will have ample time to improve so your profitability will increase by the end of the year.”
Charles Cridland of YourParkingSpace agrees, “I consider a monthly sales report to be the most important for my business because it allows me to look at the progress and notice some trends in sales numbers. This document provides data to work with and not just individual instances or actions. Generating monthly reports helps predict sales more accurately and gives me a better idea of my team’s areas of opportunity. I get data that can be used to create compelling sales strategies.”
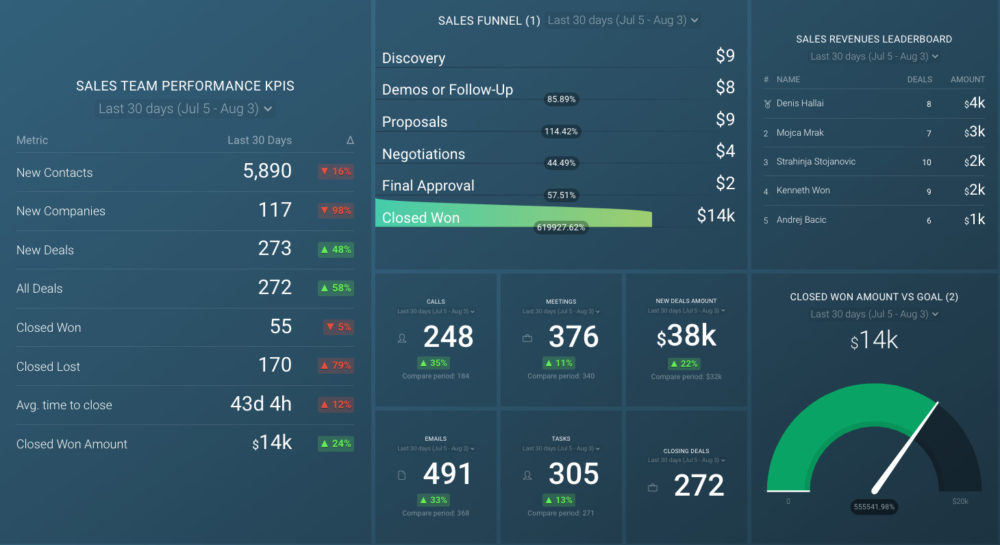
Find out how your sales team is performing using this sales team activity dashboard.
PRO TIP: Monitor Your Sales Team’s Performance in One Dashboard
Smart Sales Managers know that to achieve your monthly and quarterly goals, you have to monitor your team’s sales performance on a daily, weekly, and monthly basis. To do that, you need an actionable dashboard that summarizes both team and individual sales rep metrics and allows you to:
- Understand the current sales pipeline.
- Track sales rep performance.
- Compare team results to revenue goals.
If you use the HubSpot CRM, you can benefit from the experience of our sales experts, who have put together a plug-and-play Databox template showing some of the most important metrics for monitoring your sales team performance. It’s simple to implement and start using as a standalone dashboard or in sales reports!
You can easily set it up in just a few clicks – no coding required.
To set up the dashboard, follow these 3 simple steps:
Step 1: Get the template
Step 2: Connect your HubSpot account with Databox.
Step 3: Watch your dashboard populate in seconds.
2. Net Income Report
While a revenue report can give you the big picture, it is important to zoom into net income and profit.
“The most important report by far is the top line reports for sales because they indicate whether a company can continue to invest in itself,” says Jamie Hickey of Coffee Semantics. “There’s no point in looking into reports on how products perform if you know that monthly expenses will never be covered.
Hence, this forces companies into some tough decisions if they can’t afford to carry low-performing inventory and need to cut losses.
The secondary report is the net income because it relies on revenue, which can’t exist without expenses. Finally, the tertiary report is pro forma earnings per share because it considers all factors involved with investment (i.e., product development costs) when calculating growth and payout ratios for growth.” Looking for an effective tool to help you track this metric? check out this sales dashboard software.
3. Conversion Rate Report
Another key report is the conversion rate report (a.k.a. win-lose report)
James Khoury of Zendbox shares, “The most important sales report for my business is, without a doubt, sales conversion rate. This allows senior management to understand areas of the business that require further attention, and those which may be thriving in comparison.
For example, analyzing the effectiveness of paid versus organic marketing channels, and also the rate in which inbound sales leads are closed to track the effectiveness of conversions via in-house channels.”
4. Revenue by Salesperson Report
A revenue by salesperson report lets you see who your top sales performers are as well as which people on your team would benefit the most from your coaching.
“Every sales manager should be using a report that shows a breakdown of revenue by salesperson,” says Courtney Buhler of SugarLash Pro. “This report offers a quick look into how each salesperson is performing based on how much revenue they are generating. However, you have to consider other factors such as whether deals are still in the process of being closed. It can be helpful to look at trends month over month to get an idea of trends in performance for each salesperson.”
Joe Ternence of Mladengarment adds, “This report is basic but provides insights into revenue generated by each individual in the sales department. We have used it as a performance indicator which in turn has seen employee productivity increase. Here is the information our revenue by salesperson report includes:
- Number of deals closed/lost.
- Quotas and sales goals.
- Percent contributed to revenue generated by team
All of which can be tracked using this business development dashboard.
These reports have helped us in assessing which employees are successful in their sales techniques and which members of the team need further training. One thing it helped us in recognizing was our team’s performance in changing market trends, since then we have come up with newer strategies to deal with market fluctuations.”
5. Sales Commission Report
A natural extension of the revenue by salesperson report is a commission report.
“Commissions reports are the most important sales report,” says Austin Dowse of Aimvein. “This type of report produces profit figures that show how well each employee is doing in sales versus their financial goals. This shows me how much my sales staff sold and what percentage they made in commission. It shows me which areas of the store have the most sales volume. I can also see the top-selling items and can decide if more needs to be ordered or if it’s selling faster than expected. The commission report lets me know of any problems on the floor, such as disputes with cashiers, improper marking of items on sale, etc.”
6. Sales Pipeline Report
With a sales pipeline report, you get a bird’s eye view of both deal flow and your team’s processes.
“The most important type of sales report is the pipeline report,” says Max Benz of BankingGeek. ”A sales pipeline report is a visualized representation of the sales process for a given company. It shows the number of leads, opportunities, and deals that are in various stages.
The analysis will show you how your business is performing, which channels are performing best, what percentage of deals are closed by each channel, and much more.
This is so important because it is the first step in understanding how to close a sale and it tells you what deals are in progress, what deals are pending.”
Use this sales pipeline dashboard to monitor and manage your sales prospects as they move through the different stages of the buyer’s cycle.
7. Sales Funnel Analysis Report
While the pipeline and conversion rate reports allow you to visualize your entire deal flow and see the percentage of deals won and lost, the sales funnel analysis report allows you to dive deeper. You can get a better understanding of how many leads or deals are in every stage of your funnel and identify what’s working and isn’t working right now.
Joe Brown of Digital Junkies explains, “The sales funnel analysis report shows the number of leads and conversion rates at each stage in the sales process. It also helps compare the end-of-the-month sales figures with your forecasts, allowing you to pinpoint the areas of improvement. By analyzing this report, I get a good idea of how each salesperson is performing at each stage, and at which stage they require additional coaching. It gives me a holistic view of the overall sales process, which in turn allows me to optimize the process and get the best performance out of my team.”
Alina Clark of CocoDoc adds, “Sales pipeline and funnel reports are a crucial part of our business reports. We review our pipeline and funnel reports weekly.
The sales funnel analysis helps us figure out the number of leads acquired and how our lead conversion strategy is functioning too. With such frequent reviews, we can pinpoint the reasons for a sudden drop in leads and conversions and figure out a solution within a relatively short time.
The funnel report also shows us the pain points within our sales teams. This informs decisions to train the team on certain areas. For instance, the funnel may show that the team as a whole is struggling with qualifying leads. This acts as a bench press for decisions on whether to give one person the responsibility if they’re good at it or train the whole team.
In general, this funnel report is just like a frequent health checkup for the whole sales system. It shows us where we are hurting, and helps us determine whether the pain is a sign of worse things.”
Get a broad overview of all the sales qualified leads in your funnel using this sales leads dashboard.
8. Deals Lost Report
The final report to include is all of the deals that didn’t convert and where in the funnel did they drop off. This can be tracked using a sales funnel dashboard.
“The sales loss rate per phase provides information on the number of sales lost during each phase of the sales cycle,” says Sai Blackbyrn of CoachFoundation. “This data is useful to sales and marketing experts because it helps determine when potential sales are lost. Knowing when the lost sales occur can help the sales and marketing team develop strategies specifically aimed at mitigating losses incurred during a particular phase. The report helps you find the hole and plug it by allowing you to develop the sales’ retention strategies that are perfectly suited for that phase of the sales cycle.”

In sum, these 8 sales reports allow you to gauge the overall health of your sales pipeline, who your top salespeople are (and how much you are paying them in commissions) as well as understand where lost deals are dropping off in the funnel.
However, it is important to take this information a step further and measure progress week over week, month over month, etc.
Mike Pasley of Famous In Real Life explains, “Measuring progress in relation to a goal can be a useful sales report to put together. For instance, if you had originally decided that you wanted to close 20% more sales for this month than the previous month, you can take a look at your results thus far and see how close you’ve gotten to your goal. This can end up being informative in terms of determining how realistic your objectives are. While it’s good to be motivated, you wouldn’t want to keep setting yourself up for disappointment due to creating sales goals that are too ambitious for the time being.”
Once you have these sales reports up and running, the most valuable insights will come from learning to spot trends and how you measure progress over time using a sales performance dashboard.


