


Table of contents
How is my website performing?
What keywords is my site ranking for?
How do people find my blog posts on Google?
Where do people click on my site?
If you are a site owner, you have probably asked yourself these questions numerous times. And this is totally expected as answers to these questions are relevant for understanding your website’s SEO performance. What’s more, without knowing the answers to these questions, you can’t know whether you’re going in the right direction and adjust your SEO strategy accordingly.
So, where can you track your website’s performance on SERPs? Enters the Search Analytics report in Google Search Console.
The Search Analytics report in Google Search Console is a great way to understand how Google views your website. Whether you want to know what keywords people use to reach a page on your website, or which pages drive the most clicks, this report will help you monitor and maintain your site’s presence on the SERPs.
So, let’s take a closer look at how the Search Analytics report works.
- Understanding Google Search Console
- Google Search Console Metrics Explained
- Standard Google Search Analytics Reports Explained
- How to Use Search Analytics Report Data
- Reporting Limitations of Google Search Analytics Reports
- Google Search Console Reporting Examples and Templates
- Improve the Performance of Your SEO Campaigns with Databox

Understanding Google Search Console
Let’s take a step back and look at how search works on Google.
When you google something, the results you’ll see will be a mix of different factors including your personal browsing history (if logged into Google), what others have searched for recently (related to the keyword or phrase you typed in), and also other content that is popular online at any given time.
Google uses an algorithm called PageRank which assigns each web page a number between 0-100, which determines its importance when it comes to ranking in google search results. The higher the score of a website or webpage the better the chances of that website appearing higher in search engine results pages. However, there are no guarantees as this process is not 100% foolproof.
Now, on to Google Search Console. Search Console is a tool that Google provides to help you monitor and maintain your site’s search performance.
To understand how Google views your website, it’s useful to know the basics of the GSC including:
- What data is provided within the search analytics report
- Why this information matters for ranking in the search results
- The basic metrics that are included in this report
Related: 100+ Experts On How to Use Google Search Console for SEO
Google Search Console Metrics Explained
There are certain metrics within Google Search Console that can help you understand how Google views and ranks your websites in the search results. Those metrics are:
Impressions
An impression is recorded every time it appears in the search result – for example, a basic search result that includes your website’s homepage. The link to one of the website pages can appear in Google search results, Google News, and Google shopping. For example, if Google shows your site when someone searches for ‘running shoes’, then Google will record this as an impression.
Clicks
Clicks, as the name implies, show the number of clicks a certain website URL receives from google search results for a specific query. If you get a lot of clicks, Google will view your site as relevant to users’ searches. CTR shows how good your website is at matching user intent with relevance to its content.
For example, if you have an eCommerce store selling running gear, Google may use your website as an ad/sponsored listing for certain keywords like “running shoes” that people might be searching for online. If someone clicks on a Google ad and then clicks on your website, Google will record this action as a click.
Position
This metric tells us where exactly our URL appears among the top spots in the SERPs. Note that Google analyzes hundreds or thousands of keywords each day across all languages worldwide which makes it hard to predict what position we may end up with any given keyword phrase over time vs. other factors such as Google’s algorithm updates.
As an example, if your website is ranking 1st on Google search engine result pages (SERP) for a particular keyword phrase then you will get a 100% position metric for this query. If it ranks second then the percentage would be 50%, third 33%, and so forth.
Click-Through Rate (CTR)
Click-through rate (CTR) shows how many people click-through to your site from Google after they saw or clicked on one of its listings in the SERPs. CTR is also based upon keywords that are sending traffic to your websites which makes it hard to measure performance without paying attention daily.
PRO TIP: How to Improve Your Google Rankings
To optimize your website for organic search, you probably use Google Search Console to learn which pages receive the most impressions and clicks, and which queries drive them. To get the information you need, you may need to visit several areas within GSC and view multiple reports.
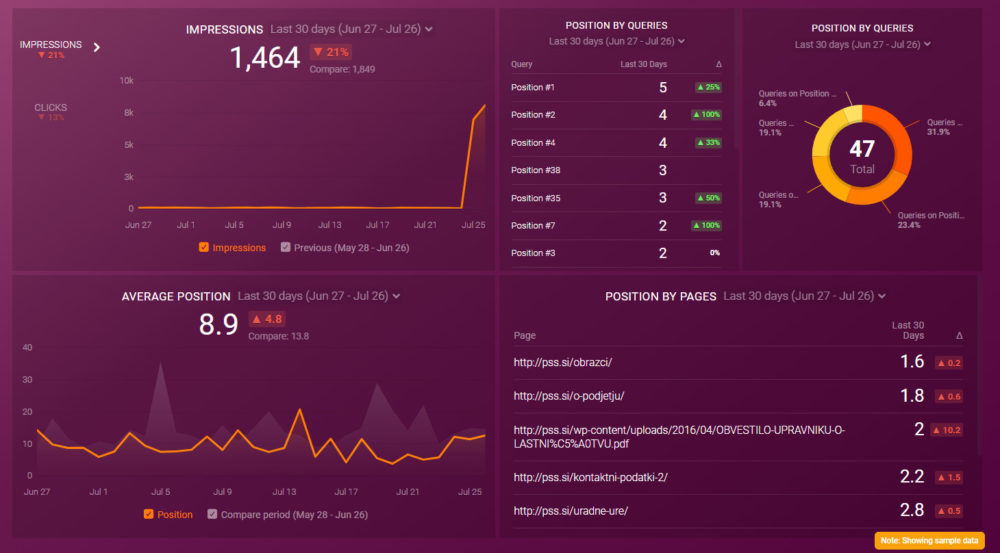
Now you can quickly assess your overall SEO performance in a single dashboard that monitors fundamental metrics, such as:
- Impressions. See how many impressions and clicks your website pages receive in Google.
- Average position. Track your average search position and monitor daily, weekly, or monthly fluctuations.
- Position by pages. Learn the search results page position of any page on your website.
- Position by queries. See how many search queries each position group receives.
And more…
Now you can benefit from the experience of our Google Search Console experts, who have put together a plug-and-play Databox template showing the most important metrics for monitoring your SEO performance. It’s simple to implement and start using as a standalone dashboard or in marketing reports!
You can easily set it up in just a few clicks – no coding required.
To set up the dashboard, follow these 3 simple steps:
Step 1: Get the template
Step 2: Connect your Google Search Console account with Databox.
Step 3: Watch your dashboard populate in seconds.
Standard Google Search Analytics Reports Explained
Google Search Console provides you with a standard set of reports to help understand how Google views your website, including the following:
Performance Report
The performance report shows how Google ranks the performance of your website pages. It provides you with several metrics to help you understand if Google considers your site as relevant for specific keywords, including impressions, click-through rate (CTR), average position, and click volume.
Other factors that Google takes into account (that are accessible in Google Analytics) are bounce rate, time spent on page, average session duration, etc. which can be used by marketers and SEOs to improve different aspects of a website, from the content itself to page titles, URLs, meta descriptions and images in order to rank higher in the search engine results.
URL Inspection Report
The URL Inspection report shows the status of all your website pages listed in the Google Search Console. It tells you if Google is indexing your pages, how many indexed URLs per page (URLs) you have, the number of backlinks pointing to each URL, and also Google’s cached version for each one of them.
Links Report
The Links report shows GSCs count of all backlinks pointing to your website. It contains the following metrics: number of pages with links, link type (e.g., dofollow or no-follow), spammy links that Google considers low quality, etc.
Also, in the Links report, you can see:
- Top Linked Pages
- Top Anchor Texts
- Top Linking Sites
- Top Referring Domains
- Top Linking Text
Coverage Report
The Coverage report shows Google’s coverage of your website by country, language, and device (desktop/mobile). It tells you the percentage of pages indexed for each one.
You can also get Googlebot crawl stats here, including Data crawled per day which is an indicator to understand how frequently Google crawls different sections on our site. If Google keeps crawling the same section over time it may be due to a problem within that page or because there are important changes in terms of content or design but Google doesn’t show it yet in its indexing process.
Mobility Usage Report
The Mobility Usage report tells you how Google ranks your website on mobile devices. It includes the following metrics:
- Mobile Usability,
- Desktop/Mobile Viewports over time
- Mobile-Friendly Test Result
Metrics are shown for each one of our pages listed in Google Search Console. The report helps you to understand the responsive issues Google may have.
How to Use Search Analytics Report Data?
The Search Analytics Report within Google Search Console is free to use and helpful to any webmaster who wants to understand their website performance better. The data found in this report can be filtered and grouped by search query, page, country, or device.
To access the report, you have to go into the Google Search Console, and click on Search Analytics under the Crawl section in the left menu. You can filter data by time period (last 90 days), location/language/device, and query or page result which will help you monitor how Google ranks your website for specific keywords over time in Google SERPs.
By default, the report shows top queries ranked in order of impressions with no filtering applied. By setting different filters, you can see other metrics like Clicks, CTR, and Average Position.
To get the most out of the Search Analytics Report in GSC, we recommend analyzing your data in the following ways:
- Analyze Search Query Data Once per Quarter
- Improve CTR
- Determine Search Queries for Specific Pages
- Identify Brand vs. Non-Brand Searches
- Monitor Key Pages Performance
- Keyword Opportunity Development
- Monitor Device Traffic
- Identify Search Intents
Analyze Search Query Data Once per Quarter
Search query data is basically a goldmine for marketers and SEOs and should be analyzed every quarter. By analyzing this data once per quarter you can get more insights on how Google ranks your site over time for different queries and take action accordingly. This analysis may also help you monitor Google algorithm updates and other changes.
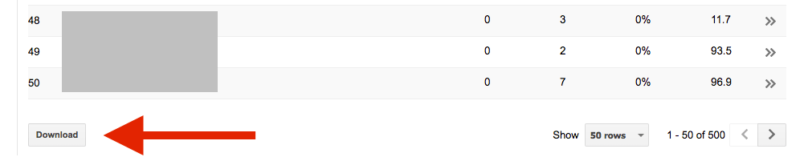
PRO TIP: Download your data into Excel or Google Sheets (look for the Download button at the bottom of the report) to avoid overwhelming yourself with data. You can also delete the non-relevant queries before you begin your in-depth analysis.
Improve CTR
If you regularly analyze data once per quarter, you will better understand how google ranks your website over time for specific queries. You will see which web pages or/and keywords perform better than others and easily spot if it’s time to improve CTR on some pages by adding more relevant content, updating your CTAs etc.
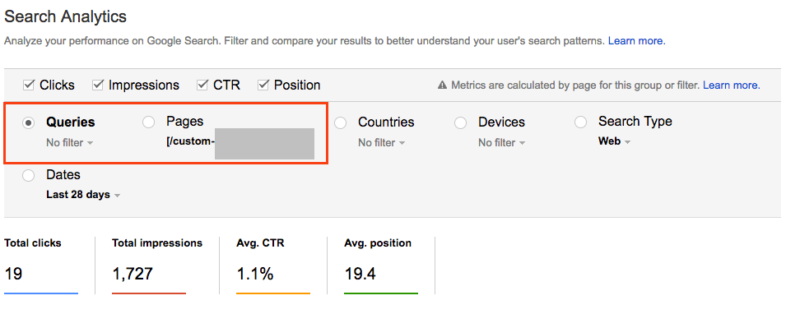
Determine Search Queries for Specific Pages
You can also get more insights into how Google ranks your website for specific queries by adding specific filters before exporting reports. For example, you can export data only for specific pages and identify your most popular keywords, most popular topics, content relevancy (based on CTR), and so on.
Related: Using Search Query Report in Google Ads: 7 Best Practices for Refining Your PPC Campaigns
Identify Brand vs. Non-Brand Searches
If you are an established brand, for example, like Databox, brand searches will dominate your search analytics report on Google Search Console. This is normal and expected since branded searches always generate higher clicks, impressions and CTR. And high brand affinity also positively impacts ranking for non-branded terms (if people know your brand, they will search for you and the product you sell).
However, most sites are not performing that well for non-branded terms. Since there is a pre-existing preference of the market for non-branded search queries, you may need to work on targetting users before they actually search for your product or services. For example, a good idea would be to target higher funnel queries that help in the education process and reinforce your brand.
Related: 9 Ways to Increase Your Branded Search Traffic for High-Quality Leads
Monitor Key Pages Performance
Use the search analytics report to determine whether the optimization of individual pages, key landing pages, and so on, is actually having an impact. To do this, simply filter your site by web pages instead of queries. For there, you take a closer look at sub-directories or individual URLs.
Here are some ideas on how to use GSC filters for gaining better key pages performance insights:
- Filter and compare different segments (for example: blog posts versus landing pages).
- Filter and compare optimized pages versus the ones still pending review by filtering specific URLs.
Keyword Opportunity Development
To spot new keyword opportunities, look for the following:
- Keywords with high CTR and moderate average position (use to identify successful patterns and then apply those patterns to new content and old content that you plan to update)
- Keywords with low CTR, high impressions, and moderate average position (these are opportunities to improve CTR based on an already well positioned key phrase.)
- Keywords with low CTR, high impressions, and lower average position (use to reevaluate existing strategy and uncover new opportunities for optimization)
Related: Google Analytics Keyword Report: A Step By Step Guide on How to Track Keywords in Google Analytics
Monitor Device Traffic
Google Search Console is helpful in tracking and monitoring how search engines view your site on different devices like desktop, mobile, or tablet.
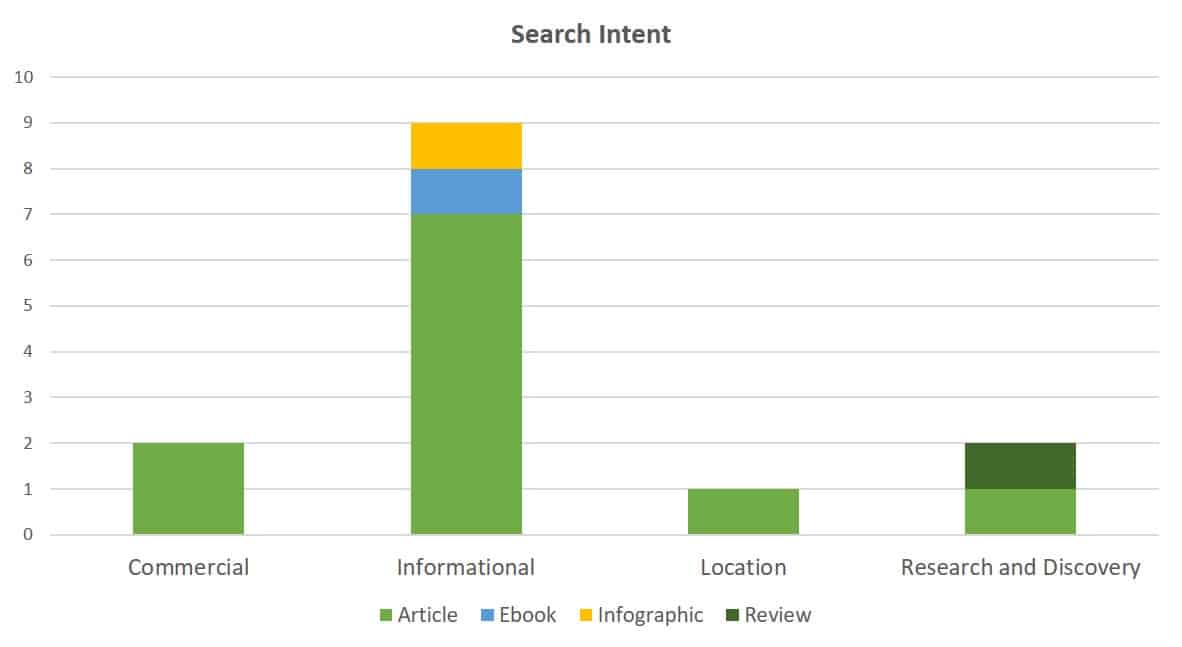
Identify Search Intent
Use the Search Analytics report to better understand the search intent of your website visitors. You can segregate the search queries gathered from the search analytics report into 4 different search intents:
- Informational
- Research and Discovery
- Commercial
- Location
Reporting Limitations of Google Search Analytics Report
As with any other tool, Google Search Console has certain reporting limitations. When it comes to the Search Analytics report:
- It will not show you traffic for non-ranking pages.
- Data is aggregated at the page level, so it won’t go beyond the top grouping of pages with similar metrics for CTR and/or average position in organic results per search query.
- Not effective for querieis with low search volume.
- It doesn’t identify any security issues.
- Data takes some time to come through.
Google Search Console Reporting Examples and Templates
If you are looking for pre-built SEO templates that pull data from Google Search Console and similar tools, like Google Analytics, look no further than Databox. With our reporting software, you can pull and combine data from your most important SEO tools in one place, and visualize your most important metrics and KPIs almost instantly.
Here are some of the templates you might find useful.
- Google Search Console Basics Dashboard Template
- Improve Your Google Search Position Dashboard Template
- Blog Post Performance After SEO Update Dashboard Template
- SEO Campaign Performance Dashboard Template
- Content Improvement Dashboard Template
- Decaying Site Pages & Posts Dashboard Template
Google Search Console Basics Dashboard Template
Let’s start with the basics!
This Google Search Console template shows the number of impressions and clicks and which search queries drive traffic to your website. You can view a comprehensive overview of the best pages on your website in terms of search engine visibility.

Improve Your Google Search Position Dashboard Template
With this Google Search Console dashboard template, you’ll get a comprehensive overview of the best pages on your website in terms of search engine visibility. Learn which pages receive the most impressions and clicks and which search queries drive traffic to your website.
![Improve Your Google Search Position [Free Template]](https://s3.us-east-1.amazonaws.com/dashboardsnapshots/l/pp6ot8cmpt7.jpg)
Blog Post Performance After SEO Update Dashboard Template
Use this easy-to-understand, and customizable Blog performance dashboard to track the performance of old blog posts you’ve recently updated in terms of organic search traffic, Google Search rankings, CTRs, and conversions.

SEO Campaign Performance Dashboard Template
With this free SEO dashboard, you can measure your SEO Campaign’s success in terms of clicks, users, channel sessions, and devices. Measure the impact of your SEO strategy and quickly identify what’s working and what isn’t.

Content Improvement Dashboard Template
You heard a lot of times: “Content is king”, right? From discovering your highest converting pages, and most-clicked keywords, to digging into your CTRs by keyword, this free Content Improvement dashboard you have everything you need to make sure your content stays top-notch.

Decaying Site Pages & Posts Dashboard Template
Last but not least, Google Search Console dashboard helps you to understand which old blog posts you need to update by showing you which posts are losing organic search traffic and Google Search rankings.

Improve the Performance of Your SEO Campaigns with Databox
Don’t want to miss an opportunity to improve your online presence? By connecting your Google Search Console account with Databox, you can get all your most important SEO data in a single place. With our SEO dashboard software, you’ll be able to monitor the performance of your keywords in real-time, and always stay on top of the important metrics that drive your website traffic.
Connect your data for free to start visualizing your performance in minutes.


