


Table of contents
When implementing an SEO strategy, you want to make sure everything is working as intended. And to do that, you shouldn’t only check where your site is appearing on search engines for chosen keywords. You should also analyze whether your target keywords are driving traffic to appropriate pages across your site, and whether users who land on those pages actually convert. And that’s where the Google Analytics 4 keyword report comes in.
The Google Analytics 4 keyword report gives you insight into your users which can help you decide whether or not it’s worth focusing more on certain keywords. It also shows which keywords are driving the most traffic to your site, helping you make better decisions when it comes to planning future on-page SEO strategies.
As you review keyword data in GA4, the next challenge is interpreting what those numbers actually mean for your business. It’s one thing to see traffic tied to a keyword, but another to understand why conversions increased, why engagement dropped, or how performance changed over time. Teams now use AI data analysts, like Databox MCP to ask plain-English questions about keyword performance and get answers based on their real metrics, definitions, and historical context, making it easier to connect search traffic to actual business outcomes.
As keyword tracking becomes more detailed, teams often need a faster way to interpret shifts in performance without manually digging through multiple reports. Many now rely on AI data analysts, like Databox MCP, to ask simple questions such as why a specific keyword’s conversions dropped or which landing pages improved engagement over the past quarter. Because it uses your actual metrics, definitions, and historical data, the answers reflect how your business measures performance, helping you understand not just what changed, but why it changed.
See how you can track and measure keyword performance in GA4 as you learn more about the following:
- Why Is Tracking Top Ranking Keywords Important?
- How to Set Up Keyword Tracking in Google Analytics 4
- How to Track and Measure Keyword Performance in Google Analytics 4
- Google Analytics 4 Custom Metrics and Custom Dimensions for Organic Search Keywords
- Google Search Console Limits in GA4
- Most Important Google Analytics 4 Reports for SEO
- Track Keyword Performance in Databox

Why Is Tracking Top Ranking Keywords Important?
Tracking top-ranking keywords gives you vital information about what content and topics your users are most interested in searching for and reading about. This can help with planning future posts and, ultimately, your entire on-page SEO strategy.
How to Set Up Keyword Tracking in Google Analytics 4
Unlike Universal Analytics, GA4 doesn’t show organic keywords by default because the tool wants to protect the privacy of website visitors.
Still, there’s a simple way to get around this. First, you need to connect Google Search Console to GA4.
Step 0: Website verification
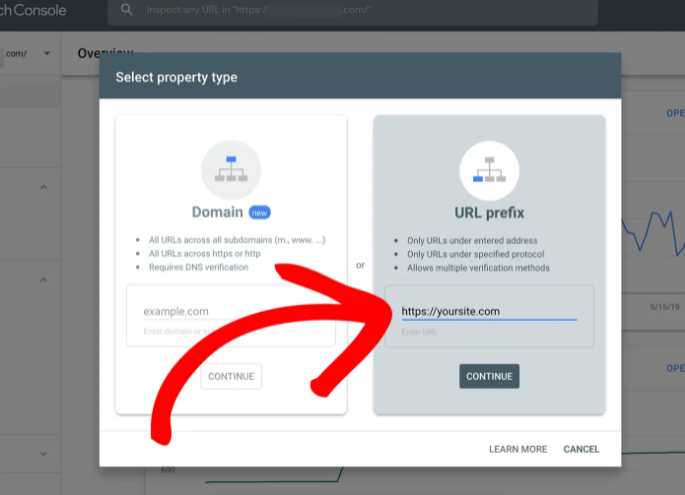
Before you can set up keyword tracking, you must first verify ownership of your website with Google Analytics. To do this, you need to open your Google Search Console account.
After you click on Search Property, open the drop-down menu, and select Add Property. Select the URL prefix option and then enter your site’s URL. Click Continue to proceed to the next step.
The process verification may take up to a few minutes, and once your ownership is verified, you’ll see the Ownership verification message. Click on Go to Property and finish the verification process. You’ll be navigated to your search console homepage.
Step 1: Connect Your Website with Google Analytics 4
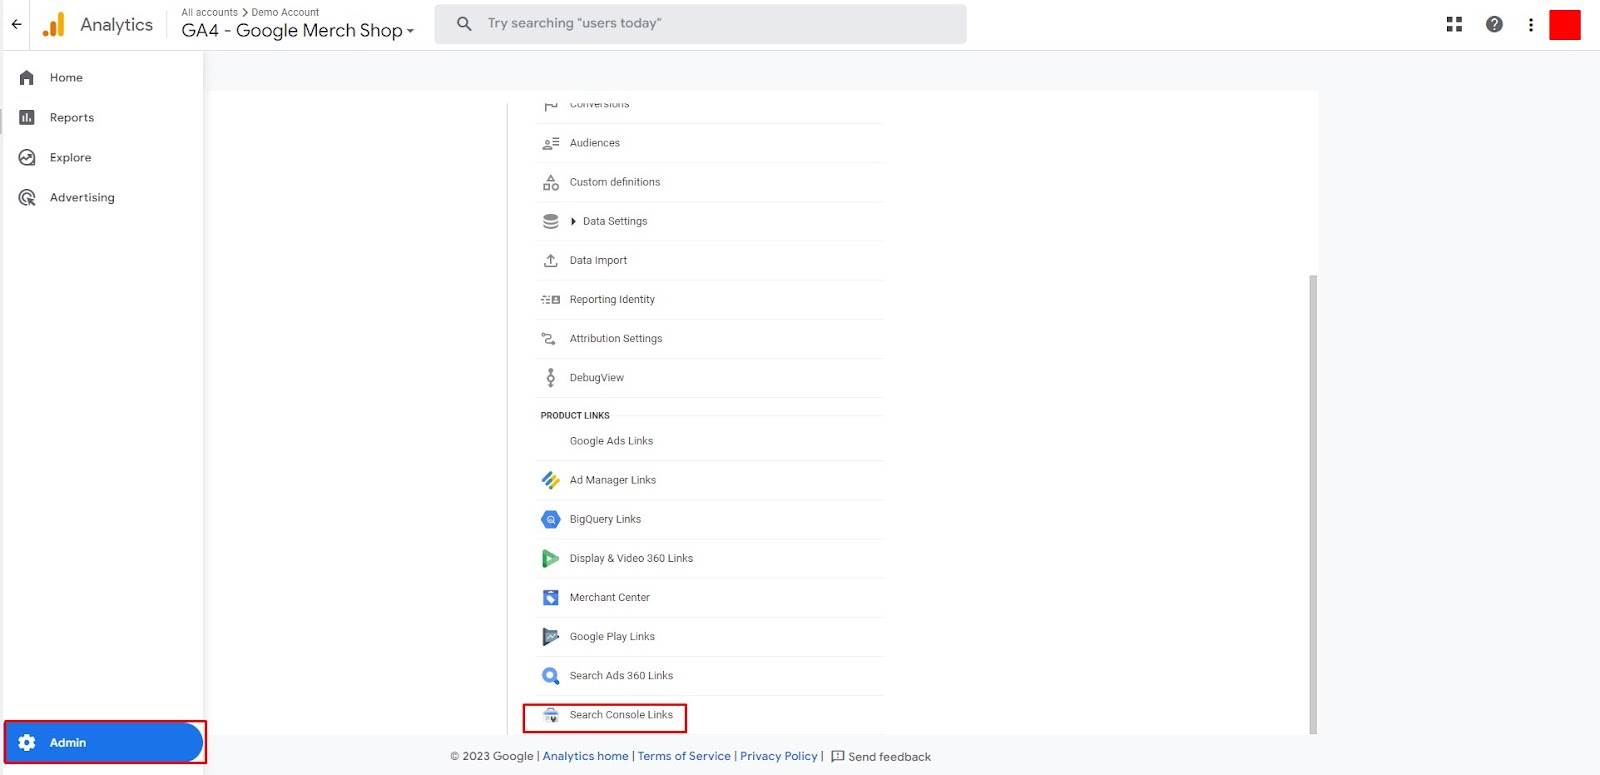
After the verification process, you have to connect your website with Google Analytics. Open your Analytics account and select the website (property) that you have already verified.
Then, go to the Admin at the bottom of the left panel and select Search Console Links under Product Links in the Property column.
Then, click Link and choose the account you want to link your property to.
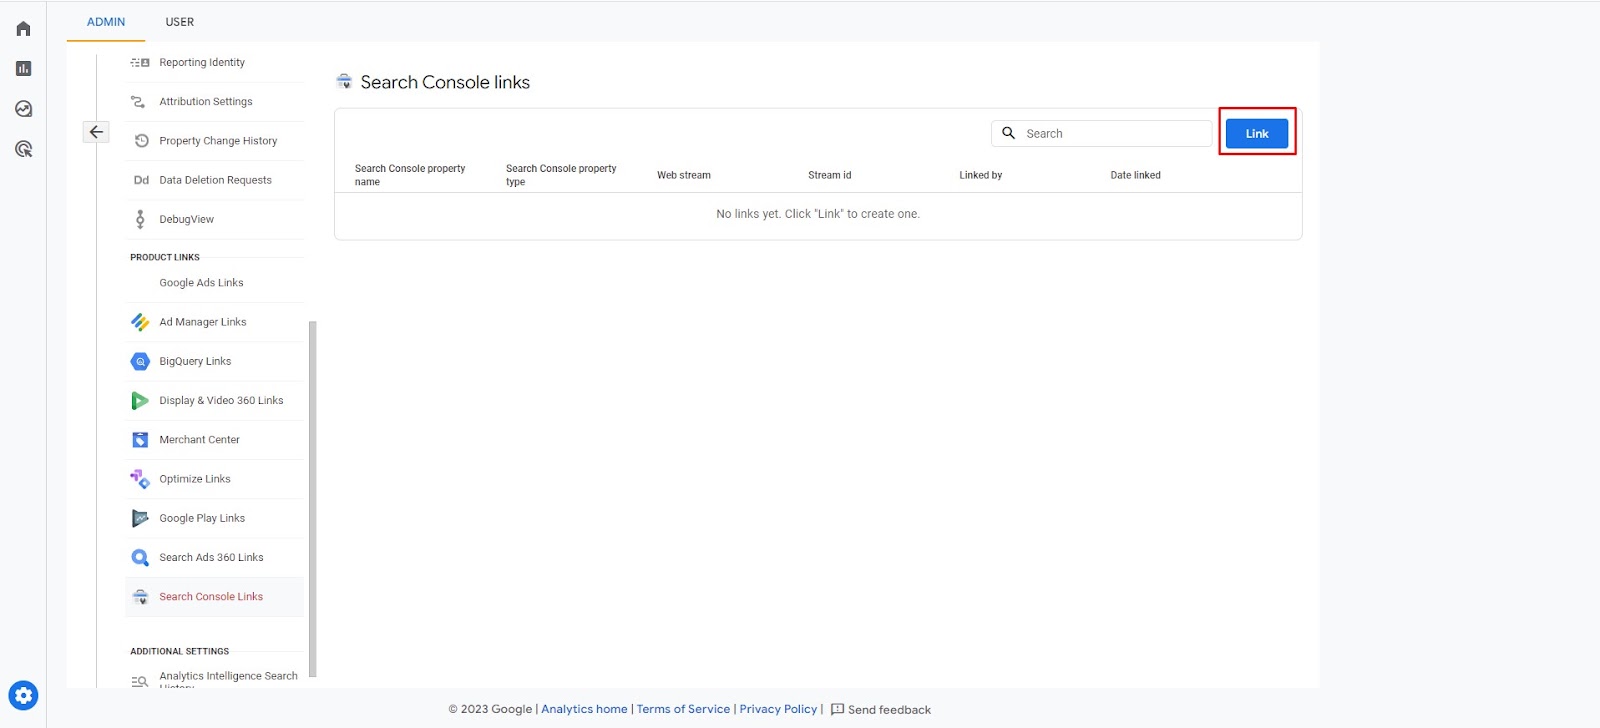
Confirm and click Next to choose your site’s web data stream. Finally, Review and submit your settings.
Relevant: Transferring a Single Website from Universal Analytics to GA4
Step 2: Publish Your Keyword Ranking Data
The process isn’t done yet. GA4 won’t show the search console reports even after you’ve linked the GSC to GA4.
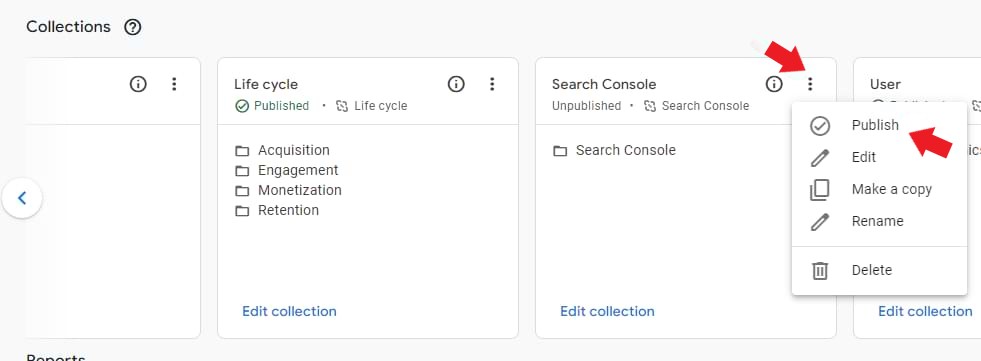
The search console reports are unpublished by default in GA4, and you need to publish them first.
To do so, go to the Library and publish the GSC reports.
After you’ve published the search console reports, navigate to the Queries report under Search Console. The dimension Organic Google search query lists organic search keywords.
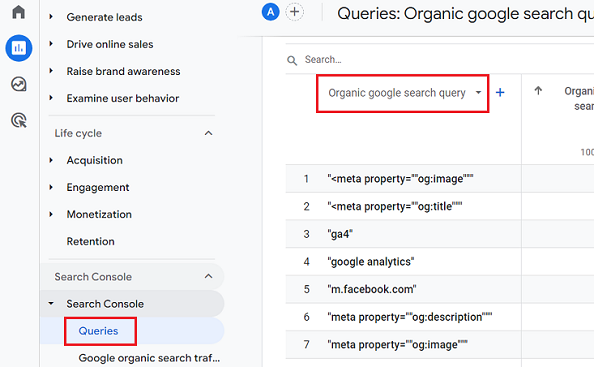
Note that the statistics only become available 48 hours after collection.
How to Track and Measure Keyword Performance in Google Analytics 4
This is the first step towards improving your SEO strategy over time. Here is the easiest way to track keywords performance in GA4.
Navigate to Acquisition → Search Console → Queries report.

This report will show you a list of all the keywords that have driven traffic to your website from organic searches.
Use the filters in the report to narrow down the data. For example, you can filter the data by date range, country, or device.

The metrics in the report will tell you how your keywords are performing. Some of the metrics that you can use include:
- Clicks: The number of times people clicked on your website from a search result.
- Impressions: The number of times your website was shown in a search result.
- CTR: The click-through rate is the percentage of people who clicked on your website from a search result.
- Average position: The average position of your website in search results.
You can use the data to identify new keywords to target, optimize your existing content for specific keywords, and track the effectiveness of your SEO changes.
To find the top organic keywords in GA4, first go to the search console query report.
Next to the graph, you’ll see the bar chart displaying the top 5 organic keywords that drive website traffic to your property.

Here are some additional tips for tracking and measuring keyword performance in Google Analytics 4:
- Use the Dimensions and Metrics Explorer to create custom reports. This will allow you to track the performance of your keywords in more detail.
- Use the Export feature to export your keyword data to a spreadsheet. This will allow you to analyze the data in more detail and share it with others.
- Use a third-party SEO tool like SE Ranking to track your keyword performance. These tools can provide you with additional insights into the performance of your keywords, such as their search volume and difficulty.
PRO TIP: How to track these 10 popular Google Analytics 4 metrics
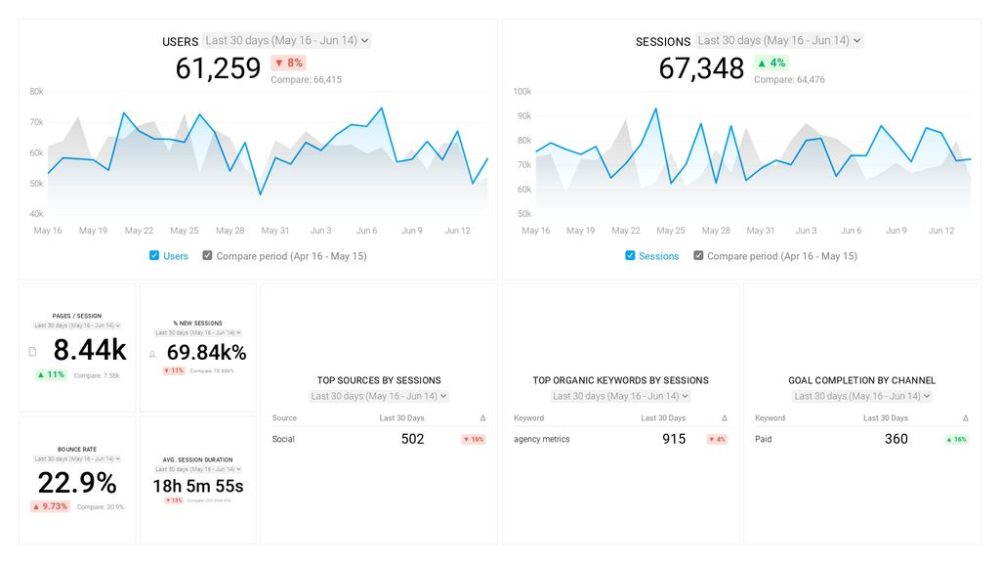
Sure, there are dozens (and dozens?) more Google Analytics 4 metrics you could track. But, starting with these 10 commonly tracked metrics will give you a pretty high-level view of how your marketing is working…
- Sessions: The number of sessions can tell you how many times people are returning to your website. Obviously, the higher the better.
- Sessions by organic keyword: Which organic keywords bring in the most traffic to your website? This may help you determine whether your SEO investments are paying off.
- Bounce rate: Do visitors leave shortly after landing on your website? Or do they stick around?
- Average session duration: How much time are people spending on your website? Users with a high average session duration are most likely relevant to your company.
- Goal completions: How many users responded to your call to action?
If you want to track these in Google Analytics, you might find the visualizations limiting. It’s also a bit time-consuming to combine all the metrics you need in one view.
To better understand how your website performs in terms of traffic growth and conversions, we’ve made this plug-and-play dashboard that contains all the essential metrics for understanding how successful you are at optimizing different aspects of your website.
You can easily set it up in just a few clicks – no coding required.
To set up the dashboard, follow these 3 simple steps:
Step 1: Get the template
Step 2: Connect your Google Analytics account with Databox.
Step 3: Watch your dashboard populate in seconds.
Google Analytics 4 Custom Metrics and Custom Dimensions for Organic Search Keywords
Custom dimensions and metrics allow you to create reports about your users and how they interact with your site. They’re particularly useful when the data you want to analyze isn’t available through the predefined dimensions and metrics.
Here’s how you can create a custom dimension in GA4.
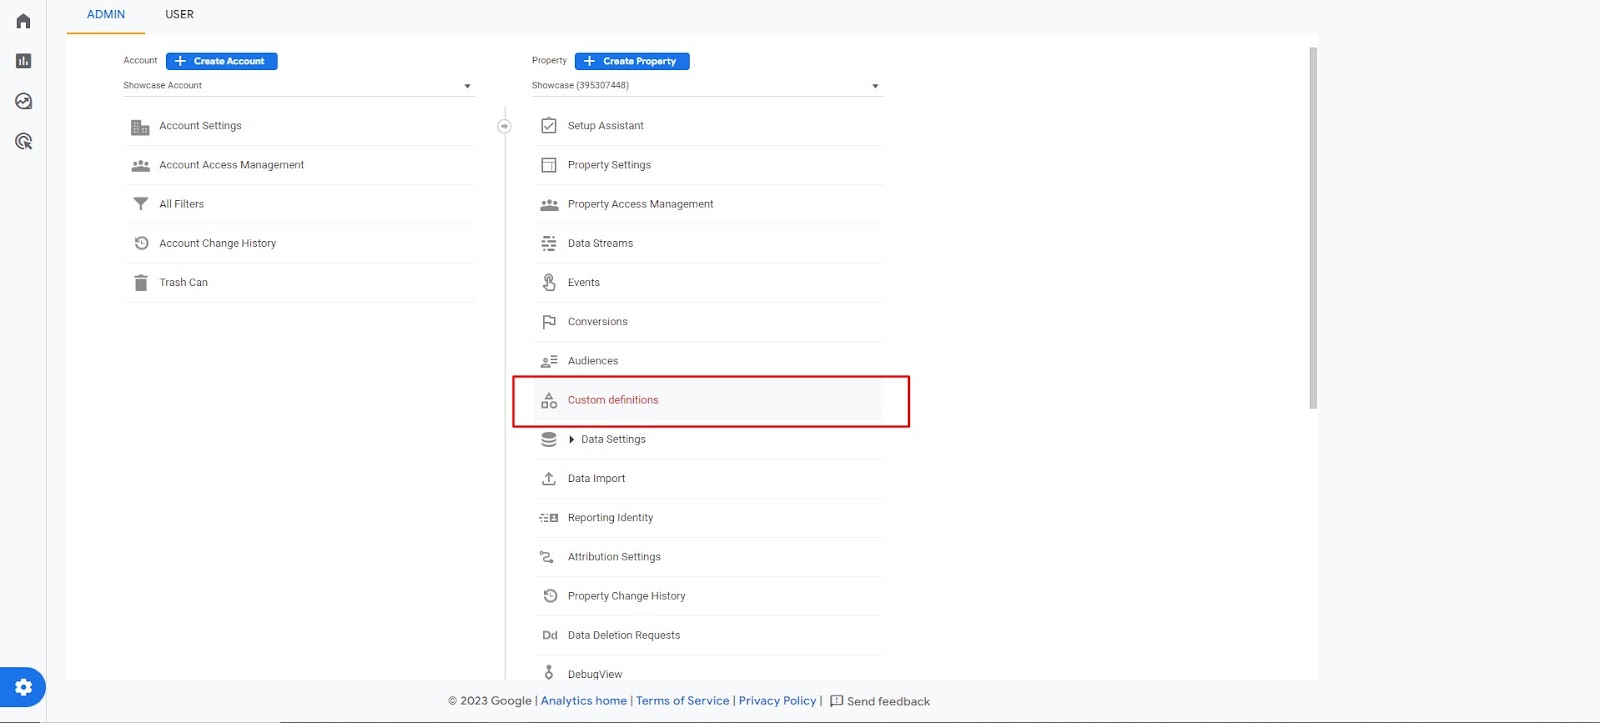
1. Click on Custom Definitions in the Property column of the Admin page and click on Create Custom Dimension.
2. Name your dimension — Keywords for example.
3. Define the scope of your custom dimension — the options are ‘Event’ or ‘User.’ For the purposes of tracking keywords, this should be ‘Event.’
4. In the ‘Description’ box, write a description of your custom dimension that will make it clear what you’re trying to track.
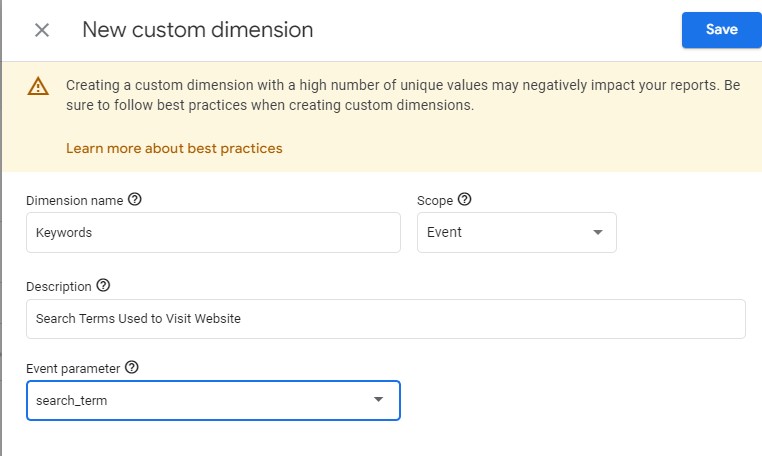
5. Finally, choose the ‘Event Parameter’ and then click ‘Save.’ Since we’re focusing on keywords and want to know what users searched for, we should pick ‘search_term.’
Google Search Console Limits in GA4
GSC and GA4 are two great tastes that go great together, but they’re not without their limits when it comes to integration.
- Single web data stream to one Search Console property: You can only link one web data stream from GA4 to one Search Console property. This means that if you have multiple websites, you will need to create a separate GA4 property for each one in order to link them to their respective Search Console properties.
- Single Search Console property to one GA4 web data stream: You can only link your Search Console property to one GA4 web data stream. This means that if you have multiple GA4 properties, you will need to decide which one you want to link to your Search Console property.
- No time series chart in Search Console reports: Search Console reports in GA4 do not support the time series chart. This means that you will not be able to see a historical view of your search traffic data in GA4.
- Exclusive focus on Google results: GSC reports only show data from Google, not from other search engines like Yandex, Yahoo, or Bing.
- 16-month data retention in GSC: By default, GSC keeps data only for the past 16 months. This means that in GA4 reports, you will only be able to see data for the past 16 months.
Most Important Google Analytics 4 Reports for SEO
Now let’s take a look at the most important Google Analytics reports you can use for SEO.
- Organic search report
- Landing page report
- Conversion goals report
- SEO report
- Assisted conversion goals report
- Site speed report
- Site search report
- Mobile traffic report
Organic search report
This Google Analytics 4 organic search report helps you gain deeper insights into your website traffic. Use it to see which sources, referrers, and social media websites drive the most traffic to your website. Monitor bounce rate, the quality of your mobile traffic, sessions, and more.
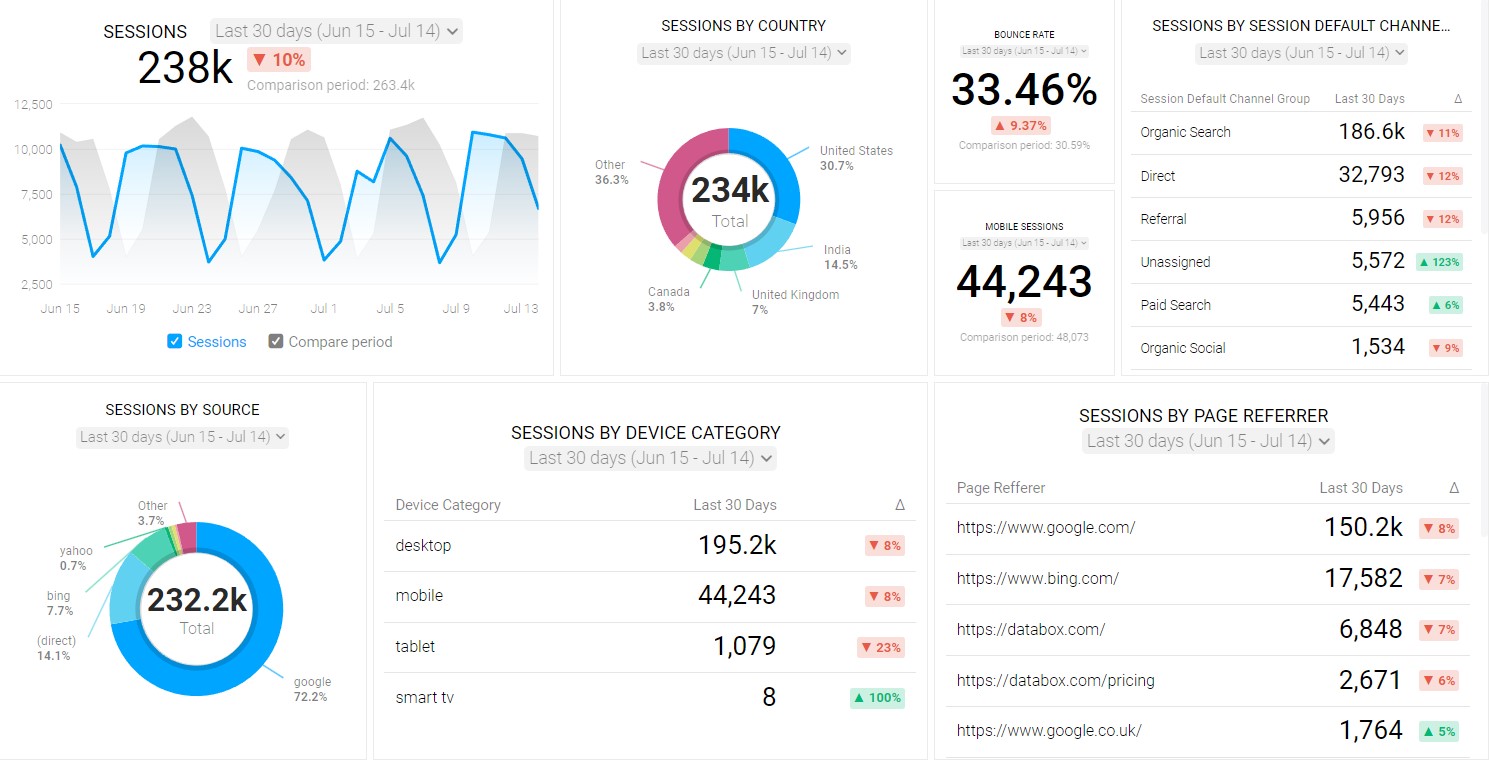
Landing page report
This landing page report can show you which pages on your website drive the most traffic and conversions. Use this report to identify your top pages, sessions by source, session conversion rate, and more.
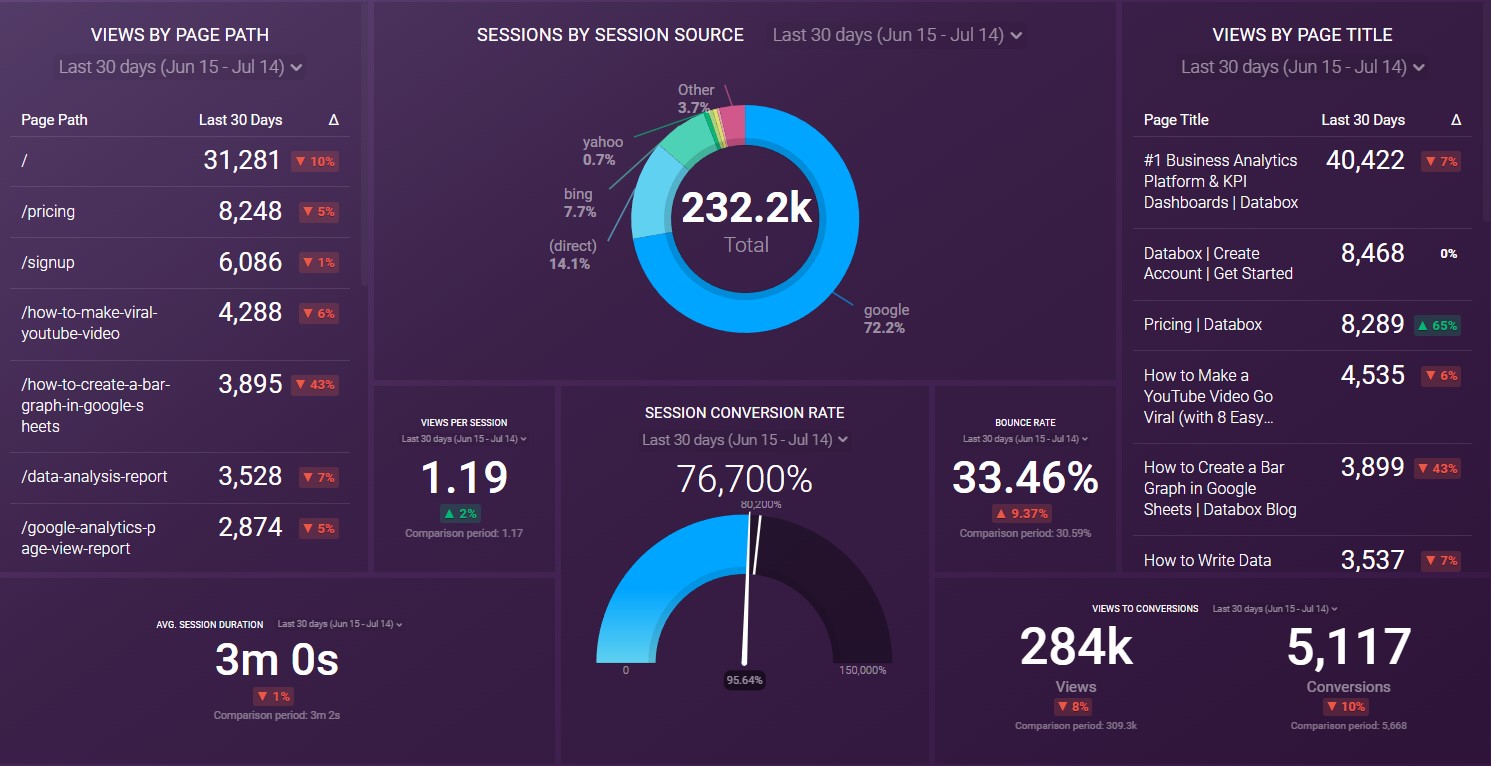
Conversion goals report
This report can help you understand how effectively your site is leading users toward your desired actions. It can help you monitor goal completion in GA4 as well as the overall conversion rate on your website. You can define specific goals for your site, such as completing a purchase or filling out a contact form, and then track how often these goals are completed.
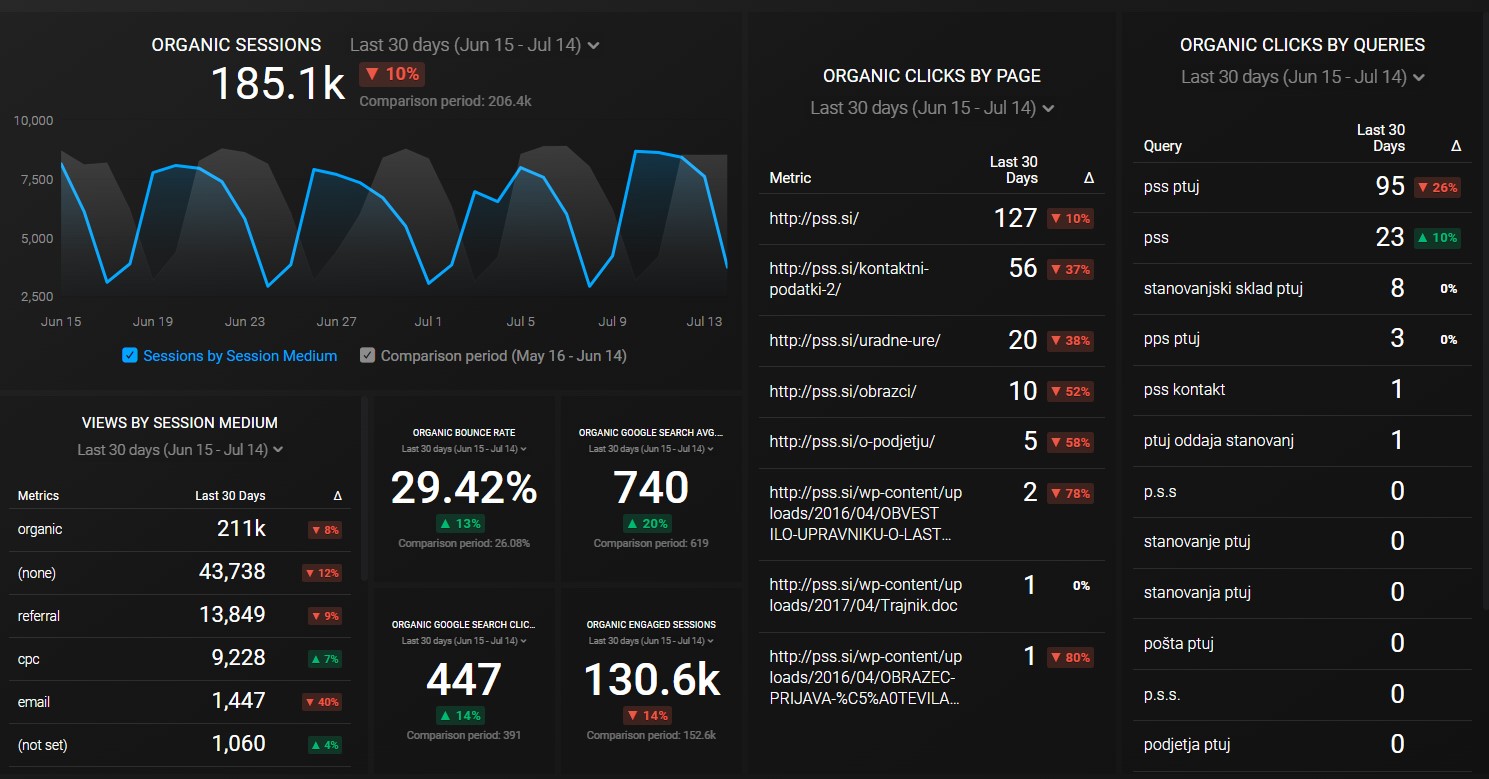
SEO report
The GA4 SEO report provides key insights into the search terms driving visitors to your site and the quality of these visitors. It offers metrics like total users, new users, sessions, bounce rate, session duration, and goal completions. The report is designed to help you understand your website’s performance in organic search and make data-driven decisions to improve your SEO strategy.
Assisted conversion goals report
The assisted conversion report or conversion path report shows how many conversions your site receives from certain sources. The difference here is that it focuses on assisted conversions which means a visitor came from a particular source and then took action after being directed by another channel, such as email or social media.
Using the assisted conversion report is a great way to measure the impact of social media and referral sources instead of just measuring the amount of traffic sent from these sources or the number of website visitors from those sources. This is what sets Google Analytics 4 apart from other web analytics tools – its ability to track conversions based on actual actions taken, not just page views alone.
Site speed report
The Site Speed report is a valuable tool that offers insights into the speed at which users can view and interact with your content. By measuring different facets of latency, such as page load time and browser parsing time, this report can help you pinpoint areas for performance enhancement. Improving site speed is vital for both user experience and SEO.
Site search report
The Site Search Report provides deeper insights into the extent to which users took advantage of your site’s search function. It provides details like which search terms they entered and how effective were those search results in creating higher engagement with your site.
Mobile traffic report
The Mobile Traffic report for GA4 provides insights into how users are accessing your site via mobile devices. It can show you the number of users, sessions, bounce rate, and session duration for mobile users. This report can help you understand how well your site is performing on mobile devices, which is increasingly important as more and more people use their mobile devices to access the web.
Track Keyword Performance in Databox
Tracking keyword performance in GA4 is not hard, but it’s not straightforward either. This is especially true if you’re used to the UA way of doing things, and some aspects of GA4 look counterintuitive.
If you’d rather skip the manual setup, you simply need to opt for Databox instead.
With Databox, you can easily pull in your Google Analytics 4 data (or data from over 70 other analytics tools), visualize your most important metrics, and access your reports on any device with just one click. It’s that easy!
To start pulling your keywords rankings performance from Google to Databox, all you need to do is to sign up for a free trial and connect your Google Analytics 4 account with our reporting tool.


