


Table of contents
Long gone are the days when someone could get away with not tracking the data for a new digital advertising campaign.
In today’s data-driven world, the success of any digital advertising campaign hinges on the ability to measure, analyze, and optimize performance.
It’s no longer enough to simply launch an ad and hope for the best – the key to staying competitive in this dynamic environment is benchmarking.
Digital advertising benchmarks offer valuable insights into what constitutes a successful campaign within specific industries, shedding light on key performance indicators, such as click-through rates, conversion rates, and ROI.
They point advertisers in the right direction, helping them set realistic goals, refine strategies, and ultimately achieve optimal results.
In this report, we examined digital advertising metrics such as clicks, CTR, CPC, spend, and more, across all the biggest advertising platforms like Google Ads, Facebook Ads, LinkedIn Ads, and Microsoft Ads.

Let’s get started:
- Google Ads Cost
- Google Ads Clicks
- Google Ads CTR
- Google Ads CPC
- Google Ads Conversions
- Facebook Amount Spent
- Facebook Clicks
- Facebook CTR
- Facebook CPC
- Facebook Purchases
- LinkedIn Spent
- LinkedIn Clicks
- LinkedIn CTR
- LinkedIn CPC
- LinkedIn Conversions
- Microsoft Advertising Spend
- Microsoft Advertising Clicks
- Microsoft Advertising CTR
- Microsoft Advertising CPC
- Microsoft Advertising Conversions
Google Ads Cost
Across all industries, the median cost of Google Ads for September 2023 was $1,749.78.

Let’s take a closer look at the Google Ads cost across different industries:
| Industry | Cost (Google Ads) |
| Apparel & Footwear | $3,583.61 |
| Automotive | $2,944.10 |
| Construction | $1,104.45 |
| Consulting & Professional Services | $1,475.46 |
| E-commerce & Marketplaces | $3,071.67 |
| Education | $2,316.64 |
| Food | $2,067.36 |
| Health Care | $1,487.50 |
| Health & Wellness | $1,404.11 |
| Information Technology & Services | $1,956.44 |
| Industrials & Manufacturing | $1,803.04 |
| Real Estate | $1,191.81 |
| SaaS | $2,036.86 |
| Technology | $2,023.61 |
| Travel & Leisure | $1,821.34 |
Apparel & Footwear and e-commerce & Marketplaces have a significantly higher cost than the median across all companies. This could be due to higher competition and customer engagement in online shopping.
Expert recommendation: Don’t allow a good campaign to go to waste by ignoring the dayparting feature in Google Ads. This feature allows you to schedule your ads to show up at a set time when you expect the ad to generate the most clicks and engagement from your target audience. This is especially important if you find that there are peak shopping hours or high online activity during a specific part of the day for your audience.
Google Ads Clicks
Across all industries, the median number of clicks on Google Ads for September 2023 was $1.18K.

Let’s take a closer look at the Google Ads clicks across different industries:
| Industry | Clicks (Google Ads) |
| Apparel & Footwear | 7.13K |
| Automotive | 3.55K |
| Construction | 405 |
| Consulting & Professional Services | 942 |
| E-commerce & Marketplaces | 5.79K |
| Education | 1.24K |
| Food | 3.37K |
| Health Care | 410.5 |
| Health & Wellness | 381 |
| Information Technology & Services | 1.44K |
| Industrials & Manufacturing | 1.52K |
| Real Estate | 1.37K |
| SaaS | 1.31K |
| Technology | 1.46K |
| Travel & Leisure | 3.53K |
Again, the Apparel and Footwear industry records the highest number of clicks in Google Ads. One of the potential reasons is that Apparel and footwear are products with consistently high consumer demand. Many people regularly shop for clothing and shoes, making these industries particularly attractive for advertisers.
Plus, shoppers are usually in a high-intent buying state when they are searching for these items, making it easier to attract them to the product landing page.
Expert recommendation: Before picking a keyword to bid on, thoroughly analyze organizational and market data trends beforehand. When it comes to both your organization and what the competition is doing, there shouldn’t be any stone left unturned. For example, if you find a potentially lucrative keyword to bid on, but you’re the only one doing it, there might be a reason why your competition has chosen to ignore it.
Google Ads CTR
Across all industries, the median Google Ads CTR for September 2023 was 4.84%.

Let’s take a closer look at the Google Ads CTR across different industries:
| Industry | CTR (Google Ads) |
| Apparel & Footwear | 1.8% |
| Automotive | 2.48% |
| Construction | 7.15% |
| Consulting & Professional Services | 4.3% |
| E-commerce & Marketplaces | 1.56% |
| Education | 7.28% |
| Food | 2.13% |
| Health Care | 7.45% |
| Health & Wellness | 7.17% |
| Information Technology & Services | 1.33% |
| Industrials & Manufacturing | 3.76% |
| Real Estate | 4.72% |
| SaaS | 3.92% |
| Technology | 3.99% |
| Travel & Leisure | 7.96% |
Travel and Leisure dominate the CTR game. This could be because people often actively seek information on travel destinations, accommodations, and leisure activities, which can lead to higher CTRs when they encounter relevant ads.
Moreover, the travel industry often experiences peak seasons when people plan and book trips, resulting in higher CTRs during these periods. Since our data is from September 2023, this could very well be the case due to summer vacations and holiday travel.
Expert recommendation: How intriguing is your headline? While you might think that the answer is “very,” oftentimes, business owners overestimate their headline copy, which is one of the most important elements in driving your CTR. To improve your ad headline and generate more clicks, you can focus on the old copywriting rule of 4Us – is it useful, urgent, unique, and ultra-specific? Your headline should check at least two of these boxes.
Google Ads CPC
Across all industries, the median Google Ads CPC for September 2023 was $1.35.

Let’s take a closer look at the Google Ads CPC across different industries:
| Industry | CPC (Google Ads) |
| Apparel & Footwear | $0.50 |
| Automotive | $0.85 |
| Construction | $1.73 |
| Consulting & Professional Services | $1.65 |
| E-commerce & Marketplaces | $0.40 |
| Education | $1.96 |
| Food | $0.81 |
| Health Care | $3.60 |
| Health & Wellness | $3.04 |
| Information Technology & Services | $0.50 |
| Industrials & Manufacturing | $1.01 |
| Real Estate | $0.91 |
| SaaS | $1.52 |
| Technology | $1.38 |
| Travel & Leisure | $0.67 |
The Healthcare industry records the highest CPC, and it can be due to its highly competitive nature, with many medical practices, hospitals, pharmaceutical companies, and healthcare providers fighting for the same audience and keywords.
This increased competition drives up the cost of advertising, as businesses are willing to pay more to secure prominent ad placements.
Expert recommendation: If your keywords are on the mark and you’re getting a good number of clicks to your website – but still face a high CPC – consider testing a few more landing page variations. Make sure your landing page creates a seamless user experience, is relevant and trustworthy, the messaging matches the ad, and the information is easily digestible.
Google Ads Conversions
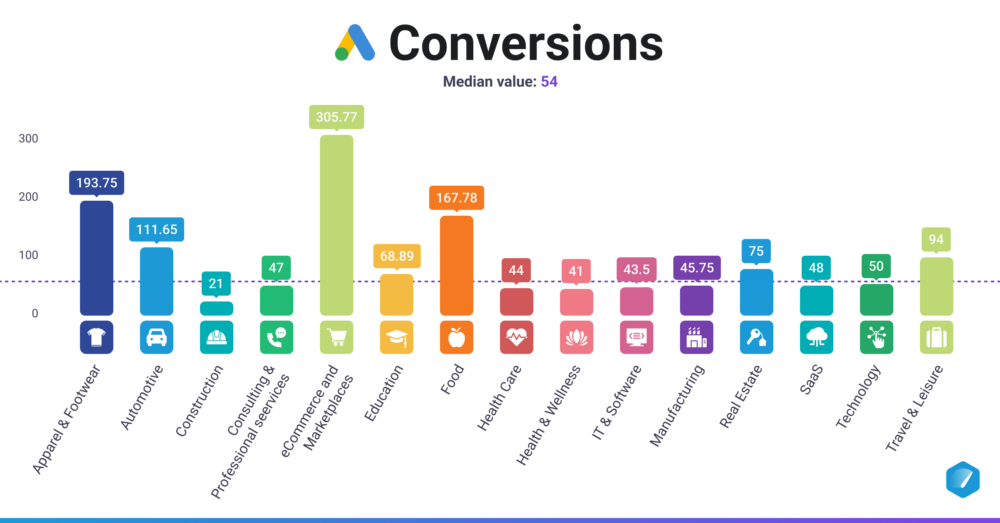
Across all industries, the median number of conversions on Google Ads for September 2023 was 54.
Let’s take a closer look at the Google Ads conversions across different industries:
| Industry | Conversions (Google Ads) |
| Apparel & Footwear | 193.75 |
| Automotive | 111.65 |
| Construction | 21 |
| Consulting & Professional Services | 47 |
| E-commerce & Marketplaces | 305.77 |
| Education | 68.89 |
| Food | 167.78 |
| Health Care | 44 |
| Health & Wellness | 41 |
| Information Technology & Services | 43.5 |
| Industrials & Manufacturing | 45.75 |
| Real Estate | 75 |
| SaaS | 48 |
| Technology | 50 |
| Travel & Leisure | 94 |
E-commerce and Marketplace have by far the highest conversion rates. One reason for this is that users who are searching for these products are high-intent and are often looking to make a purchase, which makes them more likely to convert.
Plus, due to huge competition, e-commerce businesses often target highly specific keywords related to their products. These long-tail keywords can attract users who are further along in the buying process and have a clearer idea of what they want.
E-commerce companies can also take advantage of seasonal trends and promotions to increase conversions. For example, holiday sales, Black Friday, and other special occasions can drive a surge in purchase behavior.
Expert recommendation: Give your campaigns enough time to breathe. What we mean by this is, that even though constant testing is crucial for performance optimization, make sure you’re not rushing it. Let your campaign run for a reasonable time before you decide to switch up the elements and start changing things.
Facebook Amount Spent
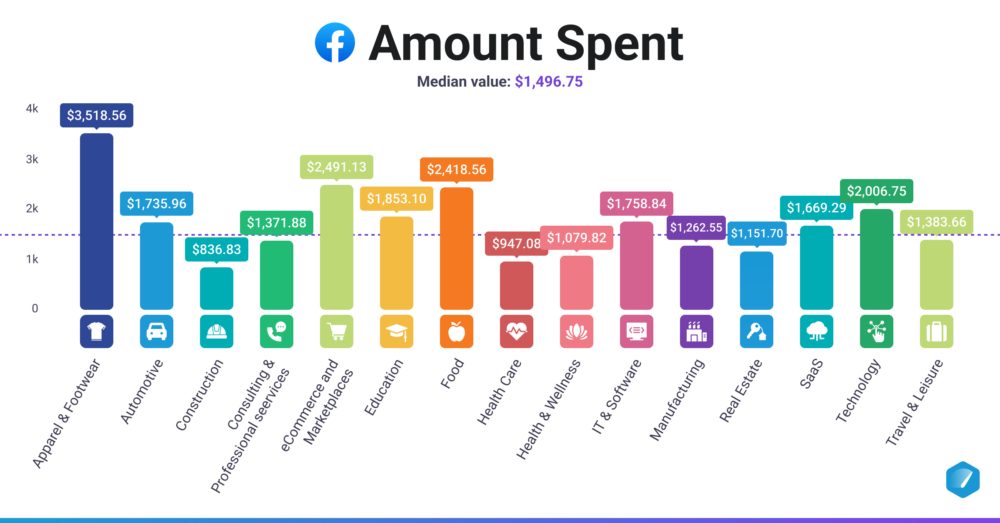
Across all industries, the median amount spent on Facebook Ads for September 2023 was $1,496.75.
Let’s take a closer look at the Facebook Ads amount spent across different industries:
| Industry | Amount Spent (FB) |
| Apparel & Footwear | $3,518.56 |
| Automotive | $1,735.96 |
| Construction | $836.83 |
| Consulting & Professional Services | $1,371.88 |
| E-commerce & Marketplaces | $2,491.13 |
| Education | $1,853.10 |
| Food | $2,418.56 |
| Health Care | $947.08 |
| Health & Wellness | $1,079.82 |
| Information Technology & Services | $1,758.84 |
| Industrials & Manufacturing | $1,262.55 |
| Real Estate | $1,151.70 |
| SaaS | $1,669.29 |
| Technology | $2,006.75 |
| Travel & Leisure | $1,383.66 |
Apparel & Footwear, E-commerce & Marketplaces, and Food have substantially higher amounts spent compared to other industries we examined.
These results could be due to their universal appeal, broad audiences, and ongoing offers/deals.
Expert recommendation: To make the most out of your Facebook Ads amount spent, make sure you diversify your campaigns properly. In other words, you should have different campaigns ready for acquisition, retargeting, etc. This way, you’re making more targeted actions, which can be of huge help if you’re on a tighter advertising budget.
Facebook Clicks
Across all industries, the median number of clicks on Facebook Ads for September 2023 was 3.03K.

Let’s take a closer look at the Facebook Ads clicks across different industries:
| Industry | Clicks (FB) |
| Apparel & Footwear | 15.7K |
| Automotive | 4.82K |
| Construction | 4.63K |
| Consulting & Professional Services | 3.25K |
| E-commerce & Marketplaces | 14.76K |
| Education | 3.03K |
| Food | 5.38K |
| Health Care | 846.5 |
| Health & Wellness | 950 |
| Information Technology & Services | 2.75K |
| Industrials & Manufacturing | 6.64K |
| Real Estate | 2.09K |
| SaaS | 2.67K |
| Technology | 3.15K |
| Travel & Leisure | 6.08K |
A potential reason for Apparel and footwear having the highest number of clicks is the highly visual products, which positively affect user experience. The ability to showcase images and videos of clothing and shoes can be compelling and engaging for users.
Many Apparel & Footwear brands also collaborate with influencers and celebrities to promote their products, which can lead to increased engagement on sponsored posts.
Expert recommendation: If you want a clean, understandable overview of what’s going on with your Facebook Ads campaigns (including all relevant metrics from clicks to CPC), you can download our Facebook Ads Campaign Performance dashboard. Instead of juggling through the not-so-intuitive Facebook Ads Manager interface and tracking your data, you can connect your most relevant metrics in one place and track them in real-time. This way, you’ll quickly be able to spot any burning issues and optimize underperforming elements.

Facebook CTR
Across all industries, the median CTR on Facebook Ads for September 2023 was 1.44%.

Let’s take a closer look at the Facebook Ads CTR across different industries:
| Industry | CTR (FB) |
| Apparel & Footwear | 1.63% |
| Automotive | 1.48% |
| Construction | 1.23% |
| Consulting & Professional Services | 1.38% |
| E-commerce & Marketplaces | 1.98% |
| Education | 1.11% |
| Food | 1.11% |
| Health Care | 1.34% |
| Health & Wellness | 1.3% |
| Information Technology & Services | 1.33% |
| Industrials & Manufacturing | 1.51% |
| Real Estate | 1.31% |
| SaaS | 1.31% |
| Technology | 1.33% |
| Travel & Leisure | 2.3% |
The reason for the Travel & Leisure industry’s high CTR in September is that the travel industry often runs promotions and offers based on seasonality, holidays, or special events.
Limited-time offers and discounts can create a sense of urgency, prompting users to click on ads to take advantage of these deals as the summer holidays are coming to an end.
Expert recommendation: Make sure you sprinkle enough social proof in your Facebook ad to get the user further down your funnel. Nowadays, with so many claims being thrown around in the digital advertising space, being credible and leveraging social proof can put you a few steps ahead of your competition and show your users that your offer is reliable. Then, add more examples of satisfied client testimonials on your landing page to finish off the job.
Facebook CPC
Across all industries, the median CPC on Facebook Ads for September 2023 was $0.49.

Let’s take a closer look at the Facebook Ads CPC across different industries:
| Industry | CPC (FB) |
| Apparel & Footwear | $0.40 |
| Automotive | $0.39 |
| Construction | $0.46 |
| Consulting & Professional Services | $0.47 |
| E-commerce & Marketplaces | $0.24 |
| Education | $0.67 |
| Food | $0.41 |
| Health Care | $0.92 |
| Health & Wellness | $0.94 |
| Information Technology & Services | $0.50 |
| Industrials & Manufacturing | $0.29 |
| Real Estate | $0.52 |
| SaaS | $0.54 |
| Technology | $0.50 |
| Travel & Leisure | $0.21 |
The Health & Wellness industry has the highest CPC, and it could be because it’s highly competitive, with many brands vying for the same audience. As a result, the bidding for ad placements becomes intense, driving up the CPC as advertisers are willing to pay more to reach potential customers.
Expert recommendation: One potential way to reduce your CPC is to stop selling your product via the ad – that’s what the sales page should do. Instead, you should focus on selling the click that leads the user down to the sales page. Build enough curiosity and intrigue that the user can’t help but check out what you have in store for them in the next part of your funnel.
Facebook Purchases
Across all industries, the median number of purchases on Facebook Ads for September 2023 was 24.

Let’s take a closer look at the Facebook Ads number of purchases across different industries:
| Industry | Purchases (FB) |
| Apparel & Footwear | 137 |
| Automotive | 28.5 |
| Construction | MISSING |
| Consulting & Professional Services | 13 |
| E-commerce & Marketplaces | 235 |
| Education | 10.5 |
| Food | 114.5 |
| Health Care | 0 |
| Health & Wellness | 0 |
| Information Technology & Services | 23 |
| Industrials & Manufacturing | 47 |
| Real Estate | MISSING |
| SaaS | 36.5 |
| Technology | 31 |
| Travel & Leisure | 13 |
The Apparel & Footwear industry dominates this metric as well, and it can be due to seasonal trends and promotions that are more common during months like September.
This can drive higher purchase intent, and advertisers can take advantage of these trends to create timely and relevant campaigns.
Expert recommendation: Purchases usually aren’t made on the first impression and this is why remarketing is so crucial in Facebook advertising. Just make sure you set up your remarketing parameters properly – for example, targeting people who have watched 75% of your VSL or have clicked on your ad to go to the landing page.
LinkedIn Spent
Across all industries, the median LinkedIn Ads spent for September 2023 was $1,335.48.

Let’s take a closer look at LinkedIn Ads spent across different industries:
| Industry | Spent (LinkedIn) |
| Apparel & Footwear | MISSING |
| Automotive | MISSING |
| Construction | $932.88 |
| Consulting & Professional Services | $1,120.50 |
| E-commerce & Marketplaces | MISSING |
| Education | $1,390.01 |
| Food | MISSING |
| Health Care | $2,160.47 |
| Health & Wellness | MISSING |
| Information Technology & Services | $2,107.27 |
| Industrials & Manufacturing | $326.67 |
| Real Estate | $934.03 |
| SaaS | $1,862.90 |
| Technology | $1,921.56 |
| Travel & Leisure | MISSING |
Healthcare and Informational Technology and Services spend the most amount of money on LinkedIn Ads, and the reason for that can be that LinkedIn it is particularly well-suited for reaching a B2B audience. Both the Healthcare and Information Technology & Services industries often have specialized and professional target audiences, including healthcare professionals, IT decision-makers, and other professionals.
These industries also tend to deal with high-value customers. Healthcare services can be expensive, and IT solutions in the technology sector often involve significant investments, which makes bigger spending understandable.
Expert recommendation: To make the most out of your ad spent, make sure your LinkedIn company page is properly optimized. The best advice here is to treat your company page like a standalone landing page. Include all the relevant elements, from your unique value proposition to social proof. These are the things your customers will be paying attention to the most when you start advertising on LinkedIn.
LinkedIn Clicks
Across all industries, the median number of clicks on LinkedIn Ads for September 2023 was 379.

Let’s take a closer look at LinkedIn Ads clicks across different industries:
| Industry | Clicks (LinkedIn) |
| Apparel & Footwear | MISSING |
| Automotive | MISSING |
| Construction | 256 |
| Consulting & Professional Services | 311 |
| E-commerce & Marketplaces | MISSING |
| Education | 419.5 |
| Food | MISSING |
| Health Care | 290 |
| Health & Wellness | MISSING |
| Information Technology & Services | 504 |
| Industrials & Manufacturing | 194 |
| Real Estate | 189.5 |
| SaaS | 506 |
| Technology | 491 |
| Travel & Leisure | MISSING |
With many SaaS companies operating in the B2B space, it’s not that surprising that this industry records the highest number of clicks.
LinkedIn is known for its B2B marketing capabilities, allowing SaaS companies to reach the right businesses and professionals with their ads and get them to click through to the next page.
Expert recommendation: One great way to get more clicks on your LinkedIn ad is to optimize your messaging strategies based on your prospect’s stage of awareness. You’ll need to test and refine this as you go, based on the results you’re seeing for different stages. If your prospects are in the problem-aware stage, you’ll need different messaging than if they were in the product-aware stage.
LinkedIn CTR
Across all industries, the median CTR on LinkedIn Ads for September 2023 was 0.78%.

Let’s take a closer look at the LinkedIn Ads CTR across different industries:
| Industry | CTR (LinkedIn) |
| Apparel & Footwear | MISSING |
| Automotive | MISSING |
| Construction | 0.65% |
| Consulting & Professional Services | 0.91% |
| E-commerce & Marketplaces | MISSING |
| Education | 0.85% |
| Food | MISSING |
| Health Care | 0.79% |
| Health & Wellness | MISSING |
| Information Technology & Services | 0.75% |
| Industrials & Manufacturing | 1.31% |
| Real Estate | MISSING |
| SaaS | 0.76% |
| Technology | 0.72% |
| Travel & Leisure | MISSING |
The Industrial and Manufacturing sector is also often B2B-centric, which could explain the highest CTR recorded in our Benchmark data. The ads in this industry may resonate more with LinkedIn users looking for industry-specific solutions or partnerships.
Expert recommendation: No matter if you’re running video ads, text ads, or image ads on LinkedIn, you need to improve your hook in order to maximize your CTR. The last thing you want is that when a user looks at your ad and thinks, “Oh, I’ve seen this before, nothing new.” Follow some of the copywriting best practices and create a proper pattern-interrupt that persuades prospects to learn more about your offer.
LinkedIn CPC
Across all industries, the median CPC on LinkedIn Ads for September 2023 was $2.87.

Let’s take a closer look at the LinkedIn Ads CPC across different industries:
| Industry | CPC (LinkedIn) |
| Apparel & Footwear | MISSING |
| Automotive | MISSING |
| Construction | $2.12 |
| Consulting & Professional Services | $2.09 |
| E-commerce & Marketplaces | MISSING |
| Education | $2.20 |
| Food | MISSING |
| Health Care | $8.85 |
| Health & Wellness | MISSING |
| Information Technology & Services | $3.50 |
| Industrials & Manufacturing | $1.60 |
| Real Estate | MISSING |
| SaaS | $3.37 |
| Technology | $3.78 |
| Travel & Leisure | MISSING |
Healthcare has by far the highest CPC on LinkedIn. Healthcare professionals and decision-makers, such as doctors, nurses, and hospital administrators, are a sought-after audience on LinkedIn. These professionals tend to have higher CPCs because advertisers are willing to pay more to reach them.
Some advertisers in the healthcare industry also may be willing to bid higher for ad placements, which can drive up CPC. Aggressive bidding strategies can be common in highly competitive fields such as Healthcare.
Expert recommendation: Are you paying enough attention to your LinkedIn Ads quality score? Advertisers should prioritize aiming for higher quality scores as they directly reflect user experience and let LinkedIn know whether the audience finds your ads engaging. No platform wants to showcase ads that seem to be annoying to the audience and could potentially drive them off the platform.
LinkedIn Conversions
Across all industries, the median number of conversions on LinkedIn Ads for September 2023 was 9.

Let’s take a closer look at the LinkedIn Ads conversions across different industries:
| Industry | Conversions (LinkedIn) |
| Apparel & Footwear | MISSING |
| Automotive | MISSING |
| Construction | MISSING |
| Consulting & Professional Services | 9 |
| E-commerce & Marketplaces | MISSING |
| Education | MISSING |
| Food | MISSING |
| Health Care | MISSING |
| Health & Wellness | MISSING |
| Information Technology & Services | 14 |
| Industrials & Manufacturing | MISSING |
| Real Estate | MISSING |
| SaaS | 12 |
| Technology | 21 |
| Travel & Leisure | MISSING |
The Technology industry records the highest number of conversions based on our latest Benchmark data, and the reason could be that technology professionals often seek out thought leadership content and industry insights.
LinkedIn provides a platform for sharing whitepapers, webinars, and articles, allowing tech companies to showcase their expertise and attract leads who are interested in learning more.
Expert recommendation: The LinkedIn Ads Manager isn’t exactly the most intuitive interface for digital advertisers… especially if you’re just starting out on the platform. More often than not, you need to run through different reports, compile all your key data, and then transfer it to a spreadsheet to make sense of it. But there’s a much easier way to do it – simply download our LinkedIn Ads Overview Dashboard and streamline this entire process. In just a few minutes, you can connect your LinkedIn account, add your key metrics, and transform them into understandable visuals.

Microsoft Advertising Spend
Across all industries, the median Microsoft Ads spend for September 2023 was $879.11.

Let’s take a closer look at Microsoft Ads spend metric across different industries:
| Industry | Spend (Microsoft Advertising) |
| Apparel & Footwear | MISSING |
| Automotive | MISSING |
| Construction | $121.85 |
| Consulting & Professional Services | $2,355.96 |
| E-commerce & Marketplaces | MISSING |
| Education | MISSING |
| Food | MISSING |
| Health Care | MISSING |
| Health & Wellness | $43.24 |
| Information Technology & Services | $2,168.02 |
| Industrials & Manufacturing | MISSING |
| Real Estate | MISSING |
| SaaS | $2,659.53 |
| Technology | $2,613.13 |
| Travel & Leisure | MISSING |
Based on our Benchmark data, the Health & Wellness industry spends the least amount of money on Microsoft Ads.
This can be because the Health & Wellness industry might target a specific audience that is more active on other platforms. The primary audience for health-related products or services may tend to use other search engines or social media platforms more frequently, while the industry allocates its advertising budget accordingly.
Even though missing Microsoft Ads data for many industries, our data reveals something interesting for a few of them: SaaS, Technology, and Information Technology and Services spent more on Microsoft Ads in September 2023, than on Google Ads, Facebook Ads, and Linkedin Ads. They also got more Clicks on Microsoft Ads than on Google Ads and Linkedin Ads.
Expert recommendation: Don’t give up on Microsoft Ads before you give them a proper try. For many keywords, Bing is a lot more cost-effective than compared to Google Ads, which allows you to capture a wider audience at half the price. Sure, you might not get as much traffic, but the quality of it can be good enough to keep you on the platform.
Microsoft Advertising Clicks
Across all industries, the median number of clicks on Microsoft Ads for September 2023 was 561.

Let’s take a closer look at Microsoft Ads clicks across different industries:
| Industry | Clicks (Microsoft Advertising) |
| Apparel & Footwear | MISSING |
| Automotive | MISSING |
| Construction | 137.5 |
| Consulting & Professional Services | 1.47K |
| E-commerce & Marketplaces | MISSING |
| Education | MISSING |
| Food | MISSING |
| Health Care | MISSING |
| Health & Wellness | 70 |
| Information Technology & Services | 2.37K |
| Industrials & Manufacturing | MISSING |
| Real Estate | MISSING |
| SaaS | 2.53K |
| Technology | 2.61K |
| Travel & Leisure | MISSING |
Within the industries that we have data for the Technology sector recorded the highest number of clicks on Microsoft Ads per our latest data, while the Construction industry is on the other side of the spectrum.
The reason for this poor performance could be that the Construction industry typically has a more specialized and niche audience. It may not appeal to as broad a demographic as the technology industry, resulting in fewer potential clicks on Bing.
Expert recommendation: While clicks are one of the most relevant metrics you’ll need to track in your campaign, make sure you consider them in context with other PPC metrics. Sometimes, you might even notice that you’re getting fewer clicks, but your conversion rate is amazing. This could mean that you’re messaging is on point and that you’re segmenting the buyers from those who aren’t still serious about their purchase.
Microsoft Advertising CTR
According to data from our survey, the median CTR on Microsoft Ads for September 2023 was 1.81%.

Let’s take a closer look at the Microsoft Ads CTR across different industries:
| Industry | CTR (Microsoft Advertising) |
| Apparel & Footwear | MISSING |
| Automotive | MISSING |
| Construction | 1.89% |
| Consulting & Professional Services | MISSING |
| E-commerce & Marketplaces | MISSING |
| Education | MISSING |
| Food | MISSING |
| Health Care | MISSING |
| Health & Wellness | 1.5% |
| Information Technology & Services | 1.25% |
| Industrials & Manufacturing | MISSING |
| Real Estate | MISSING |
| SaaS | 1.76% |
| Technology | 1.05% |
| Travel & Leisure | MISSING |
All of the industries we examined have a higher CTR than 1% on Microsoft Ads.
In less competitive niches like Information Technology and Construction, advertisers on Microsoft Ads might see higher CTR because there are fewer advertisers bidding for the same keywords.
Expert recommendation: To make more sense of your CTR data and get a holistic look at your Microsoft Ads performance across the entire campaign, you can use our Microsoft Advertising Overview Dashboard. Instead of spending hours drilling into your data and extracting relevant insights, you can now do it within minutes by connecting all of your key Microsoft Ads metrics in one place.

Microsoft Advertising CPC
According to data, the median CPC on Microsoft Ads for September 2023 was $1.03.

Let’s take a closer look at the Microsoft Ads CPC across different industries:
| Industry | CTR (Microsoft Advertising) |
| Apparel & Footwear | MISSING |
| Automotive | MISSING |
| Construction | $1.47 |
| Consulting & Professional Services | $0.84 |
| E-commerce & Marketplaces | MISSING |
| Education | MISSING |
| Food | MISSING |
| Health Care | MISSING |
| Health & Wellness | $0.64 |
| Information Technology & Services | $1.17 |
| Industrials & Manufacturing | MISSING |
| Real Estate | MISSING |
| SaaS | $1.30 |
| Technology | $1.72 |
| Travel & Leisure | MISSING |
The level of competition in an industry is a major determinant of CPC. In some industries, like Technology, there is fierce competition for keywords, leading to higher CPC. In contrast, the Consulting & Professional Services industry may have fewer competitors, resulting in lower CPC.
Expert recommendation: A lower CPC isn’t a sign that you can kick back and relax. Make sure you monitor your CPC thoroughly so there aren’t any unexpected spikes that can quickly dry up your ad budget before you have a chance to respond. Ideally, it would be best if you were examining your CPC at least a few times a week.
Microsoft Advertising Conversions
The median number of conversions on Microsoft Ads for September 2023 was 26.

Let’s take a closer look at Microsoft Ads conversions across different industries:
| Industry | Conversions (Microsoft Advertising) |
| Apparel & Footwear | MISSING |
| Automotive | MISSING |
| Construction | MISSING |
| Consulting & Professional Services | MISSING |
| E-commerce & Marketplaces | MISSING |
| Education | MISSING |
| Food | MISSING |
| Health Care | MISSING |
| Health & Wellness | MISSING |
| Information Technology & Services | 32 |
| Industrials & Manufacturing | MISSING |
| Real Estate | MISSING |
| SaaS | 26 |
| Technology | 42 |
| Travel & Leisure | MISSING |
As it stands, the Technology sector had the highest number of conversions on Microsoft Ads in September 2023, but there’s still a lot of data missing from other industries to paint a more comprehensive performance picture.
Expert recommendation: One method you can use to boost your conversion rate on Microsoft Ads is to avoid generic funnel targeting. By this, we mean you shouldn’t be focused on targeting broader keywords that don’t directly relate to your product or service (at least not at first). While you might drive more traffic to your website, it won’t be of the same quality as with more specific keywords.
FAQ
Databox offers a comprehensive suite of dashboards and benchmarking tools. By connecting your advertising platforms (like Google Ads and Facebook Ads) to Databox, you can visualize your campaign performance across various metrics. These visualizations help you understand your campaign’s strengths and weaknesses, enabling you to make data-driven adjustments quickly. You can also track performance against industry standards, ensuring your strategy stays competitive.
Yes, Databox tracks performance across various digital advertising platforms, including Google Ads, Facebook Ads, LinkedIn Ads, and Microsoft Ads. You can integrate your ad accounts with Databox to pull in data and automatically compare your performance with industry standards and your competitors.


