")
Table of contents
Your company has more data than ever. Your dashboards are full. And your teams are still making decisions on gut instinct, misaligned metrics, and siloed spreadsheets.
TL;DR
- Most organizations have more data than ever, but lack the confidence and structure to use it; the gap is about confidence and interpretation, not technical skill
- The seven gaps blocking data literacy are: metric misalignment, restricted data access, executive behavior modeling, generic training, cross-functional silos, missing accountability ownership, and no measurement framework.
- According to DataCamp’s 2026 State of Data and AI Literacy Report, 88% of enterprise leaders say data literacy is essential, yet 60% report a skills gap in their organization
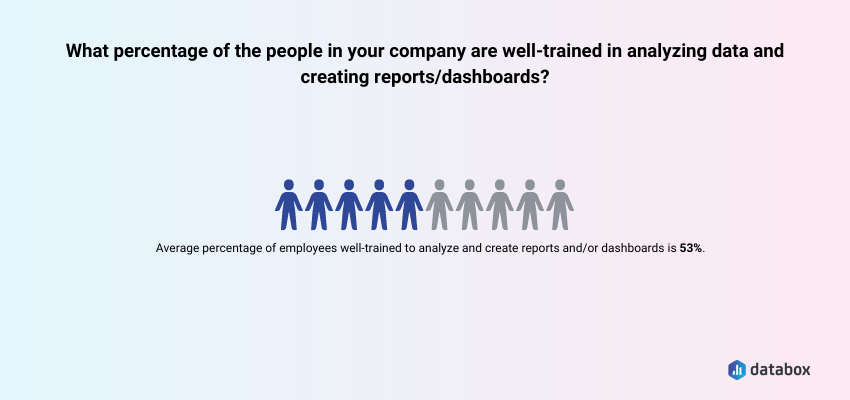
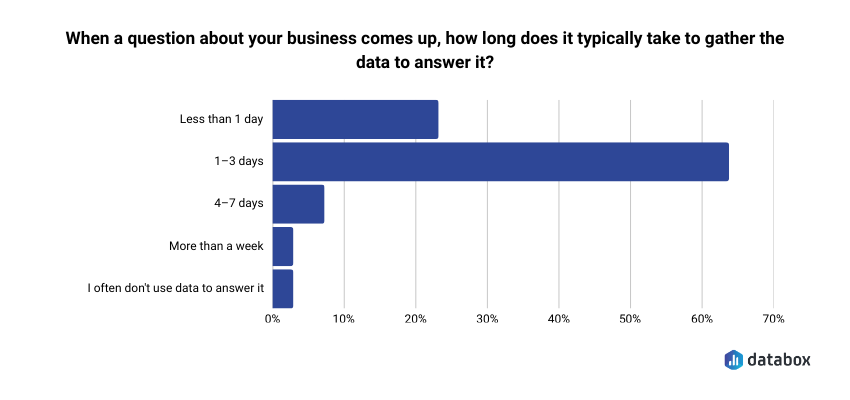
- Databox’s own research found that only about half of employees are well-trained in analyzing data and creating reports, and 64.29% of teams say it takes 1–3 days to answer a basic business question.
- Closing each gap requires a named strategy: shared metric glossaries ratified at the executive level, self-service dashboards, visible leadership modeling, role-specific training pathways, integrated data sources, per-function data champions, and behavioral measurement
- Genie, Databox’s AI analyst, accelerates data literacy by analyzing data, identifying trends, and explaining findings in plain language — giving non-technical users their first confident interaction with live data
- Data literacy is a leadership decision: without executive ownership and visible modeling, every gap in this article will persist regardless of the tools or training invested
Introduction
Most data literacy guides prescribe solutions before diagnosing the actual gaps. Below, you’ll find the seven specific gaps that exist inside most organizations: the hidden distance between having data and using it confidently, across every team, at every level. By the end, you’ll have a named, structured framework for identifying which gaps exist in your organization and a concrete strategy for closing each one. No technical expertise required to act on any of it.
What Is a Data Literacy Gap (and Why Most Executives Underestimate It)
Data literacy is the ability to interpret what data is telling you and communicate it clearly to others. It differs from data science in one specific way: one requires technical depth, the other requires confidence and context.
Most companies now have plenty of dashboards. But, having a dashboard is not the same as knowing what to do with it. Access without ability creates the illusion of data-driven decision-making while leaving the actual decisions unchanged.
The numbers make the gap concrete. According to DataCamp’s 2026 State of Data and AI Literacy Report, 88% of enterprise leaders say basic data literacy is essential for day-to-day work, yet 60% simultaneously report a data skills gap across their organization. Internally, Databox’s State of Business Reporting survey found that respondents estimate only about half the people in their organization are well-trained in analyzing data and creating reports.
Half the team is working with data they don’t fully know how to use. That’s the gap. And the gap persists not because training programs are scarce, but because of silos, culture, and a confidence failure that starts at the top. That distinction separates what actually works from what most organizations are currently trying.
Gap #1: Teams Are Speaking Different Data Languages
When “conversion” means something different to marketing than it does to sales, every cross-functional meeting becomes a negotiation over whose numbers are right rather than what to do about them. Metric misalignment is the most common and most invisible data literacy gap.
What the gap looks like in practice: A revenue review where finance shows one number, sales shows another, and marketing shows a third, and twenty minutes are spent reconciling definitions instead of making decisions.
Why it persists: There is no authoritative, shared source of metric definitions. Each team builds its own logic inside its own tools. Nobody is wrong within their own context, but the organization cannot move forward as a unit.
Strategy to close it: Build a shared metric glossary (sometimes called a data dictionary) and standardize definitions at the executive level. Executives must ratify the definitions, not delegate this to analysts, or the glossary will never be adopted.
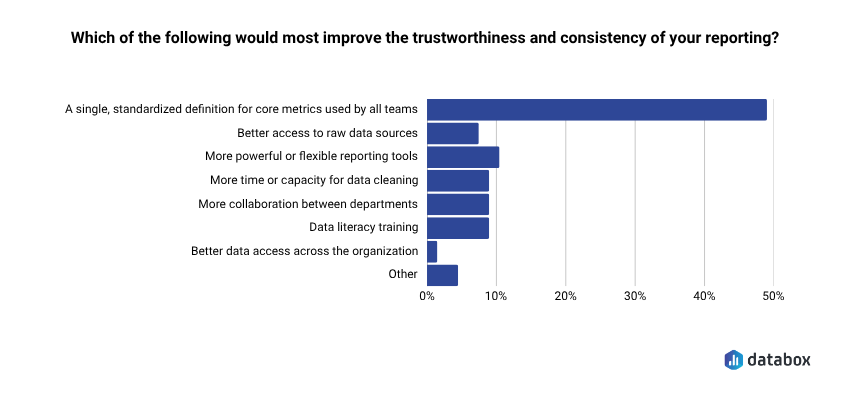
Databox’s Time to Insight survey found that 48.48% of respondents say a single standardized definition for core metrics would most improve the trustworthiness and consistency of their reporting. One shared definition eliminates a recurring source of meeting friction and restores time previously spent arguing over whose spreadsheet is correct.
A data dictionary only works if the people who set organizational direction own it. Delegate it to an analyst, and it will be ignored within a quarter.
In Databox, Datasets make this structural rather than aspirational: a single definition of “conversion” or “qualified lead” gets built once from raw data and reused across every dashboard and report that references it. The glossary stops being a governance artifact and becomes how the data behaves.
Gap #2: Data Is Accessible to Some, But Not to All
When data access is limited to analysts, data teams, or senior leadership, data-informed decision-making becomes a bottleneck rather than a capability. Everyone else waits in a queue.
What the gap looks like in practice: A marketing manager who needs campaign performance data submits a request to the analytics team. Databox’s Time to Insight survey found that 64.29% of respondents say it typically takes 1–3 days to gather data to answer a business question. By the time the answer arrives, the decision window has already closed.
Why it persists: Data access has historically required technical skills: SQL, BI tools, query logic, that most business users don’t have. But access alone doesn’t close the gap. Even when dashboards are available, interpreting what the numbers mean and deciding what to do about them stays with a small group. The rest of the organization waits.
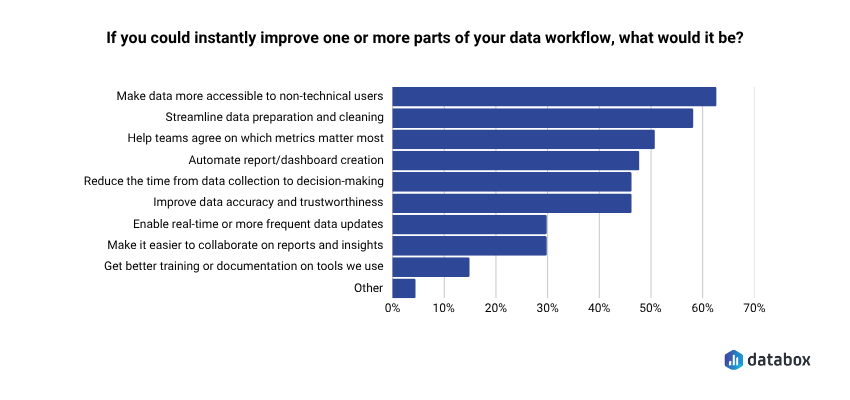
Databox’s own research, Time to Insight, found that 62.12% of respondents say their top priority is making data more accessible to non-technical users, yet most organizations have not structurally solved for it.
Strategy to close it: Build self-service dashboards with role-relevant views so every function can access the data relevant to their decisions without a request queue. The goal is not to make everyone an analyst. The goal is to make analysis unnecessary for routine questions.
When teams can ask simple questions in plain language and get answers they actually understand, the psychological barrier to engaging with data starts to fall.
Gap #3: Executives Are Modeling Gut-Based Decisions
The most damaging silo sits at the top. If executives announce data literacy initiatives but continue making high-profile decisions on instinct, every team below them draws the same conclusion: data competence is not actually how you get ahead here.
What the gap looks like in practice: A leadership team holds a quarterly business review where decisions are made based on anecdote and experience. The data is in the room, but no one references it.
Why it persists: Executives are often the least likely to be challenged on their use (or non-use) of data. The initiative gets pushed downward while behavior at the top stays unchanged.
Strategy to close it: Executives must visibly use data in meetings, reviews, and strategy sessions. Embedding data checkpoints into existing leadership rhythms: QBRs, board updates, one-on-ones, makes data reference the expected norm, not the exception.
Data literacy programs fail when executives announce initiatives but continue making intuition-based decisions. Teams follow that behavior and recognize that data competencies don’t influence career advancement.
A CEO who opens every weekly leadership meeting by reviewing three shared KPIs before the agenda begins sends a clear signal: data review is non-negotiable. When leadership models the behavior, the organization follows.
The harder version of this gap is that gut-based decisions often persist because the alternative feels too slow. By the time a team has built the spreadsheet, validated the numbers, and modeled three scenarios, the decision has already been made. Tools that shorten the distance between a question and a defensible answer make data-backed decisions operationally realistic instead of aspirational. Forecasts in Databox are an example: leaders can model scenarios, compare best/worst/likely outcomes, and stress-test assumptions against live data from 130+ sources, without rebuilding a spreadsheet. The behavior change still has to come from the top, but the friction that pushes leaders toward gut calls gets lower.
Gap #4: Training Is Generic, Not Role-Specific
A data literacy course that teaches everyone the same thing teaches no one what they actually need. Generic training cannot close specific gaps because each function uses data differently, asks different questions, and makes different kinds of decisions.
What the gap looks like in practice: A company-wide “data literacy bootcamp” covers Excel basics and dashboard navigation. Marketing attends. Finance attends. Operations attends. No one applies it because none of it connects to their actual work.
Why it persists: Generic programs are easier to procure, easier to deploy, and easier to check off an HR compliance list. The ROI stays invisible because the behavior change never happens.
Strategy to close it: Map training directly to the decisions each function owns.
- Marketing needs attribution literacy — understanding which channels drive which outcomes.
- Finance needs forecasting literacy — interpreting variance and scenario models.
- Operations needs operational metrics literacy — reading throughput, cycle time, and capacity utilization.
Role-specific examples make abstract skills immediately applicable. Successful data literacy initiatives establish role-specific learning pathways connected to measurable business outcomes. Generic programs that employees struggle to apply rarely drive lasting change.
DataCamp’s 2026 research adds a business case that executives should take seriously: organizations with mature, structured data literacy programs are nearly twice as likely to report significant AI ROI. Generic training produces neither literacy nor AI readiness.
Gap #5: Silos Stop Data From Flowing Cross-Functionally
The biggest structural barrier to a data-literate organization is not skill, but isolation. When teams work in separate tools, with separate metrics, toward separate goals, there is no common data reality to be literate in.
What the gap looks like in practice: Sales lives in Salesforce. Marketing lives in HubSpot. Finance lives in spreadsheets. No one has a unified view of the customer, the pipeline, or the business. Cross-functional decisions require manual data assembly, which almost never happens.
Why it persists: Tool fragmentation is a technical problem, but silo mentality is a cultural one. Even when integrations are possible, teams protect their data as a form of departmental autonomy.
Strategy to close it: Three structural silo-breakers work together:
- Cross-functional data reviews on a shared cadence: Bring teams together around the same numbers at regular intervals.
- Shared dashboards that surface metrics relevant to multiple functions simultaneously: Make cross-functional visibility the default, not the exception.
- Integrated data sources that eliminate the need for manual reconciliation: Connect the tools so data flows without intervention.
The silo mentality, where teams don’t readily share information, is arguably the biggest barrier to building a data-literate culture. Closing the gap requires both technical integration and cultural commitment. And the payoff is measurable: Databox’s research on the impact of data transparency on business found that 93.44% of respondents say data transparency has a positive impact on team alignment and collaboration.
Gap #6: No One Owns Data Literacy Accountability
When data literacy is everyone’s responsibility, it becomes no one’s priority. Without named owners per function, initiatives stall at the announcement stage.
What the gap looks like in practice: A data literacy initiative is launched. A training program is purchased. Participation is uneven. Six months later, nothing has changed and no one is sure whose job it was to follow through.
Why it persists: Accountability structures are built around business functions: revenue, product, operations, not around enabling capabilities like data fluency. No one gets measured on whether their team is getting better at using data.
Strategy to close it: Assign a data champion per function. A data champion role is not a full-time position, it is a named responsibility within an existing role. The champion’s job is to surface insights relevant to their team, field data questions from peers, and serve as the connection point between their function and any central data or analytics team.
Define the role explicitly. A vague mandate produces nothing. A specific one, with a named person, a monthly cadence, and a clear scope, changes behavior.
Gap #7: There Is No Way to Measure Whether Literacy Is Actually Improving
Without a measurement framework, data literacy initiatives run on faith. Leaders invest time, budget, and attention and have no way to know if anything is working.
What the gap looks like in practice: A company runs a literacy program for a year. Survey scores improve slightly. Meeting behavior, decision quality, and self-service data usage are unchanged. No one knows whether to continue, expand, or scrap the program.
Why it persists: Literacy gets treated as a training outcome (did they complete the course?) rather than a behavioral outcome (are they using data differently)?
Strategy to close it: Drop course completion as a proxy for progress. Define three to four behavioral signals of literacy improvement that can be tracked without a survey:
- Percentage of team meetings where at least one decision is explicitly data-referenced: tracks whether data is actually part of the conversation
- Reduction in ad hoc data requests submitted to the analytics team month-over-month: indicates growing self-service capability
- Self-service dashboard usage rate by function: measures views, queries, and exports across teams
- Frequency of cross-functional data questions raised in shared forums or reviews: shows whether teams are engaging with data across silos
Measure whether people are behaving differently. Everything else is noise.
How Databox Genie Accelerates Data Literacy – Starting With the First Question
Most data literacy programs fail before they build any momentum, for one reason: they ask people to develop confidence with data they can’t yet access or understand on their own.
Genie inverts that sequence.
Genie is an AI analyst built directly into Databox that analyzes your data, identifies trends and patterns, and explains what’s happening in plain language, so anyone on the team, from a sales rep to a VP, can ask a question and get a real answer in seconds. A marketing director who previously waited two days to understand why campaign performance dropped can now type “Why did our conversion rate fall last month?” and get a contextual answer pulled directly from live connected data. Genie doesn’t just surface the number; it explains what’s driving it.
That matters for literacy specifically because repeated confident interactions with data are how literacy actually develops. A team that gets clear, plain-language answers from its own data every week starts to build intuition. They learn what questions to ask. They learn what the numbers mean. Over time, the assisted interaction becomes an internalized understanding.
Genie directly addresses Gap #2 (the access bottleneck) and creates conditions for closing other gaps:
- Standardized KPIs inside Databox mean every team works from the same definitions: a direct structural solution to Gap #1
- Genie frees analysts from fielding routine questions so they can focus on deeper, higher-value work
- Databox connects data across 130+ sources, enabling teams to move from fragmented silos to integrated views
Simon Kotlerman, VP of GTM at Veezo, describes the practical value plainly: knowing why a metric dropped and what’s driving it, without waiting for an analyst to tell you. “Genie feels like having a smart teammate who’s always watching the data.”
Genie is not a replacement for executive commitment, governance, or role-specific training. But it removes the entry-level obstacle that keeps most teams on the sidelines, and gives them somewhere to start.
Building Data Confidence Is a Leadership Decision, Not an IT Project
The seven gaps in this article are not technology problems – they are leadership problems. Every gap persists because no one at the executive level has claimed ownership of closing it. The strategies above only work when driven from the top.
Data literacy is not something you build by purchasing a training platform. You build it by deciding, at the leadership level, that the way your organization uses data needs to change, and then making that change visible every week. In every meeting. In every review.
The initiative cannot be delegated. It must be modeled.
When you’re ready to give every team a way to interpret your data directly, without a queue, a query, or a handoff, Genie is the place to start.
Frequently Asked Questions
What is data literacy and why does it matter for organizations?
Data literacy is the ability to interpret what data is telling you and communicate it clearly to others, confidently enough to support decisions. It matters because organizations that cannot use their data consistently across teams make slower, less-informed decisions, experience more cross-functional conflict, and leave the value of their analytics investment unrealized. According to DataCamp’s 2026 State of Data and AI Literacy Report, 88% of enterprise leaders say data literacy is essential to daily work, yet 60% report a skills gap in their organization.
What is the difference between data access and data literacy?
Data access means your teams can see the data — dashboards exist, reports are available, tools are in place. Data literacy means your teams know what to do with what they see — they can interpret it, question it, and use it to make a decision with confidence. Most organizations have improved access significantly in recent years but have not closed the literacy gap, which is why data is abundant and confident data use remains rare.
How do you assess your team’s current data literacy level?
Start with behavioral signals rather than surveys. Track how often decisions in meetings are explicitly referenced to data, how frequently non-analysts submit data requests versus pulling data themselves, and how consistently different teams use the same metric definitions. These observable behaviors reveal literacy gaps more reliably than self-reported confidence scores.
Who should own data literacy initiatives in an organization?
Executives must own the initiative at the strategic level — announcing it, modeling the behavior, and holding teams accountable. At the functional level, assign a data champion per department who serves as the connection point between their team and central data resources. Without named ownership at both levels, data literacy becomes everyone’s responsibility and no one’s priority.
What’s the fastest way to improve data literacy across a team?
Give every team direct, confident interactions with their own data. Self-service tools that let non-technical users ask questions in plain language — and get answers they can actually interpret — create immediate confidence gains. Combine this with standardized metric definitions and visible executive modeling, and behavior starts to shift within weeks rather than quarters.