
4.5 out of 5 star
2021 Leader on the
G2 Grid for Data Visualization
4.8 out of 5 stars
The Only Custom Dashboard Software That’s Free & Easy to Set Up
Databox is a custom dashboard software that allows you to visualize, analyze, and report on business and project performance in one place.
Try it Free for 14 DaysBook a Demo


How to Build a Custom Dashboard
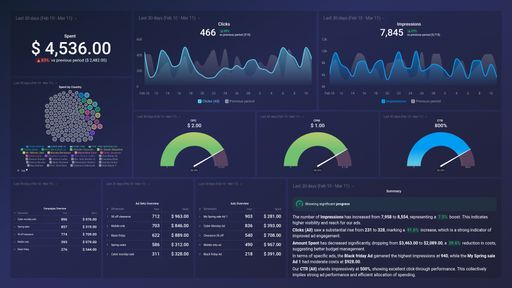
Databox integrates with 75+ of the most popular software tools that companies use to track performance. We call these data sources. Connecting your first data source is easy––just choose the tool you’d like to pull data from, select the metrics you’d like to include in your dashboard, and you’re ready to visualize your data and customize as needed.
Drag & Drop metrics right into your dashboard and watch as they automatically populate with your data and chosen visualization type. Resize and rearrange your datablocks, add metrics from other data sources, and track all of your marketing metrics from any source in one place.

No more manual reporting. Once you build a dashboard, you can schedule automated snapshots of your dashboard to be emailed to members of your team on the day and time of your choosing, automate notifications in Slack, or simply grab a shareable link to share with your team.
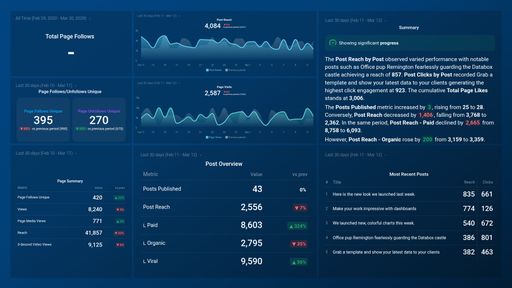
Databox integrates with 75+ of the most popular software tools that companies use to track performance. We call these data sources. Connecting your first data source is easy––just choose the tool you’d like to pull data from, select the metrics you’d like to include in your dashboard, and you’re ready to visualize your data and customize as needed.
Drag & Drop metrics right into your dashboard and watch as they automatically populate with your data and chosen visualization type. Resize and rearrange your datablocks, add metrics from other data sources, and track all of your marketing metrics from any source in one place.
No more manual reporting. Once you build a dashboard, you can schedule automated snapshots of your dashboard to be emailed to members of your team on the day and time of your choosing, automate notifications in Slack, or simply grab a shareable link to share with your team.

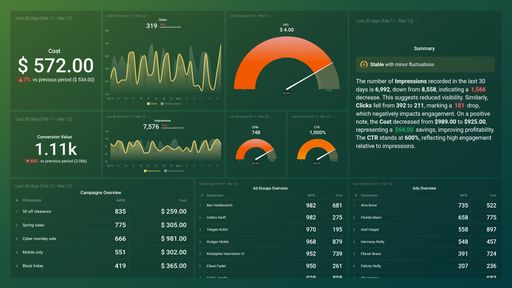
Customize How You See Your Data
Decide which visuals work best for you with the click of a mouse! Bar graph to track the ups and downs of your metric? Trend line to see the general progression? Pie chart for a visual representation of percentage? Table for side-by-side comparison? The drag & drop functionality makes it easy to build and change your dashboard anytime. Take it a step further by choosing your color story, then add your logo with our whitelabeling option for the ultimate customized dashboard.
Try it Free for 14 Days
Create Your Own Metrics & Measure What Matters Most
No more pinging back and forth between your tools and spreadsheet formulas. With Databox, you can create your own metrics or build out custom calculations that are yours to use across any dashboard you choose. Once you’ve connected your data source, pulling the data is an automated breeze.
Try it Free for 14 Days
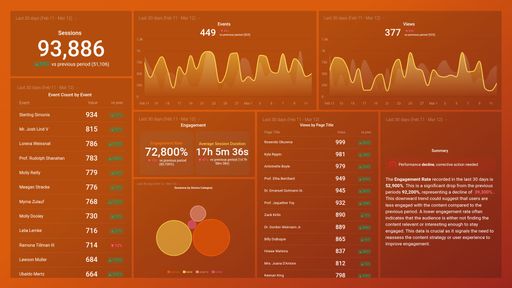
Build a Home Screen Dashboard
Customize your Databox “home screen” so that you get all of your most important health metrics at a glance. Watch the progress towards your most critical goals, get quick updates on the metrics that move the needle most, and set alerts to be notified when numbers start slipping (or when it’s time to celebrate).
Try it Free for 14 Days
Go Beyond the Shared Spreadsheet
Each team is unique—screenshots, shared spreadsheets, or one-and-done slide deck reports simply can’t capture actionable data for every single team. With Databox, you can create and send customized reports specific to each teams’ needs. Loop specific dashboards together and schedule a one-time or recurring send in Slack or via email.
Try it Free for 14 DaysWhat our customers say about us...
“Without Databox, it’s quite tricky to combine different marketing channels together and make sense out of them, to be able to show a campaign overview to the rest of the team.”
Anastasia HamelMarketing Manager at Deeplite

“I can calculate things. I can not only put the data in one place but now I can put together a specific piece of data, calculate it, and get new data that we never reached before. That’s an insight important to our clients and us.”
Gabriel MarguglioCEO at Nextiny

“My old process was really messy. I had to use third-party connectors, and editing it and making it look really good visually takes a ton of time. I didn’t want to deal with all that.”
Robbie RichardsCEO & Founder at Virayo

Build Your Custom Dashboard with Our Library of One-Click integrations
The easiest way to connect your data with Databox is through any of our 75+ one-click integrations.
Explore 75+ Dashboard Integrations
Use Thousands of Pre-Built Metrics or Create Your Own
Databox integrations come loaded with a library of thousands of pre-built metrics––this means all you have to do is drag-and-drop them into your dashboard and your data and chosen visualization type will populate automatically.. Take it step further by creating custom calculations that give you even more information about the data you’re tracking.
Revenue
Revenue from Web Ecommerce or In-app Transactions during specified Date Range. Depending on your implementation, this can include Tax and Shipping.
Average Order Value
Average Value of transactions during specified Date Range.
All Deals Amount
Amount of Deals (Open and Closed) during the specified Date Range.
Opened Email by Subject
Number of Opened Emails (Unique) during the specified Date Range split up by Subject. This is a measure of how many Recipients Viewed your Email.
Lifetime Value (Monthly)
Average Lifetime Value, as calculated at the end of the given period during the specified Date Range.
Open Tickets
Total number of Open Tickets. No historical data is available from before the initial connection.
Explore Hundreds of Pre-Built Dashboard Templates You Can Customize
With 200+ pre-built dashboard templates that can be setup in minutes, we’ve got you covered. Track your performance from tools like Google Analytics, Hubspot CRM, Help Scout, Mailchimp, and many more. Download the free template, connect your data sources, and get instant visualizations of your key metrics in minutes.
What Else Can You Do With Databox?
Make your performance more predictable with Databox’s array of top-tier features that help businesses build custom dashboards, track performance, and report results with ease.

Dashboard Designer
No more fumbling around trying to visualize data in spreadsheets or slides. With our DIY Dashboard Designer, anyone can pull the metrics they need, visualize KPIs in a variety of ways, and build meaningful dashboards–no code or design skills necessary.

Calculated Metrics
With Data Calculations, you can combine data from multiple sources and easily calculate new metrics, KPIs, conversion rates, ROI, and much more — all without coding or spreadsheets.

Goal Tracker
Goals aren’t hit in a spreadsheet. With Databox, you can visualize your goals against current performance so you can make adjustments when they matter most.

Looped Dashboards
With amazing reporting features like Looped Dashboards, you can connect multiple dashboard reports together in one centralized report and easily share it with others.

Custom Metric Builder
Sometimes the preconfigured metrics from the tools you use aren’t enough. Use dimensions and filters to build custom metrics that allow you to pull more granular performance insights. With Query Builder, anyone can build the specific metrics they need without any engineering work.

TV Dashboards
Whether you’re viewing performance from your desktop, phone, TV, or even your wrist – Databox makes your data accessible no matter where you’re viewing it.
Start Building Your Custom Dashboard
No more logging into dozens of different tools to understand performance — now you and your team can easily connect your data, build and share reports, monitor trends, and discover insights.
Try it Free for 14 DaysFrequently Asked Questions
What is the best software for dashboards?
While many business tools include analytics features, Databox allows you to connect all of your favorite tools in one place, like Google Analytics, Hubspot Marketing, Stripe, and Google Sheets. Find out more about our native and third party integrations.
How can I create a dashboard for free?
Databox is a free custom dashboard software.To connect your first integration in Databox, find it in Data Sources, then just log in to connect. Drag & Drop metrics right into your dashboard and watch as they automatically populate with your data and chosen visualization type. Resize and rearrange your datablocks, add metrics from other data sources, and track all of your marketing metrics from any source in one place.
Do you offer special Agency features?
We do! Features for agencies include: client management, client performance monitoring, templated reports, annotation capabilities, and alerts & notifications. Find out more about agency features here.
What software is used to create dashboards?
Databox is a small business dashboard software. With hundreds of one-click native integrations with the industry’s top social media platforms and marketing tech, it’s simple to connect your most-loved data sources to Databox.
How do I build a custom scorecard or report?
Databox Scorecards send you updates on your key performance indicators (KPIs) through email, mobile push notification, and/or Slack every day, week, or month. We also support scheduled Snapshots, embedding your databoards, Looped databoards, and offer white-labeling.


Make better decisions,
together, faster
Compare
Databox Inc.
HQ: Boston, MA, USA
Modern BI for teams that needs answers now
Databox Inc.
HQ: Boston, MA, USA

Modern BI for teams that needs answers now


Compare