Table of contents
When I took over the forecasting feature at Databox, one thing was clear: users weren’t adopting it the way we’d hoped.
To change that, we made several improvements based on user feedback. We added support for seasonality and holidays. Introduced a confidence score to help teams understand how reliable their projections were. And made it possible to save forecasts for future comparison.
Each update made the feature more powerful, but even with all those changes, adoption barely moved.
So, we had to ask ourselves: Were we solving the right problem in the first place?
To find out, we conducted a round of Jobs To Be Done (JTBD) interviews with people across different roles, like executives, RevOps leaders, marketers, finance managers, analysts, and agencies.
Our goal was to understand what forecasting looked like in their day-to-day work.
What were they trying to figure out when they built a forecast? What decisions did they need to make? And what was stopping them from using forecasting tools like ours?
In the rest of this post, I’ll share what we learned and how it led us to rebuild forecasts into a tool teams actually want to use for planning.
The problem with forecasting as we knew it
Through those interviews, we started seeing the same patterns come up again and again. No matter the role or company size, the struggles were surprisingly consistent:
Forecasts stop at prediction
Most forecasting tools, including ours, only show what feature results might look like if past trends continue. They don’t explain why results are trending in a certain direction or what could be done to change the outcome.
No way to test assumptions
Teams wanted to add correlated metrics to their forecasts so they could test assumptions, explore outcomes, and see which path would get them to their goals.
Limited forecasting methods
Some teams needed advanced models with regressors. Others preferred simple trend-based forecasts. Many wanted to override the system with their own numbers. But most tools only offered one method, which didn’t always fit their data.
Assumptions were hidden
For annual planning, quarterly reviews, or campaign targets, most teams were still building scenarios in spreadsheets. While flexible, this approach buried important assumptions (like correlation factors) inside formulas.
The goal: forecasting that drives planning
We didn’t want forecasting in Databox to stop at predictions.
We wanted to build something that actually helps teams plan: test ideas, explore different scenarios, uncover dependencies, set goals, and make more informed decisions on what to prioritize next.
Introducing Forecast Modeling.
Here’s what’s new:
From prediction to explanation
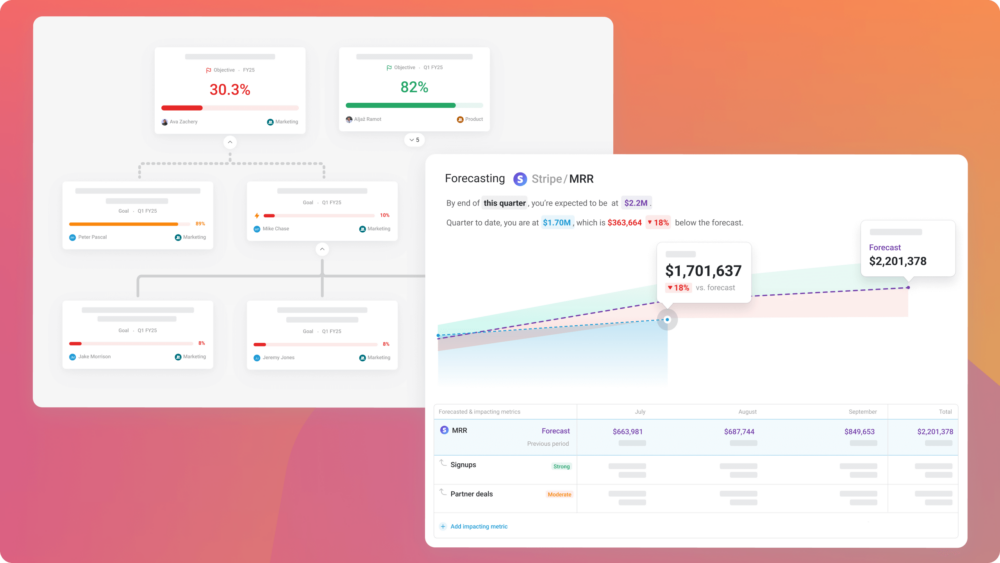
Add impacting metrics to your forecasts and see how they correlate, so you can understand what’s driving performance and what you can do to improve it.
From static forecasts to what-if modeling
Adjust inputs and run scenarios to compare outcomes instantly, without playing with formulas in spreadsheets.
From one-size-fits-all to flexible methods
Choose the forecasting method that fits your data best. Use Databox’s advanced model, regression, smoothing, or full manual control.
From hidden assumptions to transparent modeling
See every forecasted value and correlation factor in one table. With every input and assumption visible in one place, it’s easier to explain, adjust, and keep your team on the same page.
Built for people who actually plan
Right now, most planning still happens in spreadsheets. Teams export data from their tools, move it into a spreadsheet, and build formulas from scratch before they can even start modeling outcomes.
Forecast Modeling was built to change that.
It’s designed for the people who actually drive planning in their orgs: marketing leaders, finance managers, RevOps teams, and executives who need to move fast, adjust often, and back decisions with data.
It gives them the flexibility and power of spreadsheets, without the friction. Forecasts are easy to build, quick to adjust, and directly connected to the performance metrics they already track in Databox.
This isn’t a tool for data analysts or data scientists who want to build complex models from scratch. It’s designed for people who need simplicity, but also the power and flexibility to plan with confidence, without writing code or maintaining massive spreadsheets.
What are users excited about
During validation interviews, users described exactly how they plan to use Forecast Modeling to simplify their planning. Here’s what they said:
Finding what really drives results
A Digital Marketing Manager told me that lead generation is her primary goal. In the past, she forecasted leads based on clicks from different platforms and rough assumptions about conversion rates. With Forecast Modeling, she can connect those inputs directly, test different assumptions, and quickly see which platform has the biggest impact.
Planning with confidence across different periods
A RevOps Director shared how his team sets monthly and quarterly targets by comparing results to both the previous month and the same period last year. Until now, that meant digging through spreadsheets and building formulas for every new cycle. With Forecast Modeling, he could run those comparisons automatically, adjust assumptions, and spend more time planning instead of number-crunching.
Replacing spreadsheets with scenarios
A Sales Manager at a B2B company said he always prepares pessimistic scenarios to account for risks like rising fuel costs or staff shortages. Previously, that meant tweaking Excel formulas manually. Now, with Forecast Modeling, he can build and save those scenarios directly in Databox, making them easier to share with his team.
Turning forecasts into goals and OKRs
That same sales manager explained how frustrating it is that forecasts and goals live in separate places. His team would forecast revenue in Excel, but track goals in Databox, making it hard to stay aligned. With Forecast Modeling, he can turn any forecast into a goal, track progress automatically, and set plans that are grounded in data.
Looking ahead
Forecast Modeling is just the beginning. It lays the foundation for a more flexible, dynamic approach to planning in Databox.
As a product manager, I know a feature only succeeds if it solves real problems. That is why we started with research, validated with a prototype, and shaped the experience around direct feedback. The first reactions have been very positive. Users are excited to try it!
Still, nothing replaces real-world usage. I’m excited to get this into your hands, and even more excited to hear your feedback!
If you want a sneak peek, you can watch the video here. And if you would like to be notified as soon as Forecast Modeling is available, you can join the waitlist below.


