


Table of contents
TL;DR
- Every ad platform over-counts conversions by design — Meta, Google, and LinkedIn each claim credit for the same customer using overlapping attribution windows.
- The fix is a four-tier trust hierarchy: CRM closed-won data first, server-side event data second, GA4 third, platform dashboards last.
- Build a weekly reconciliation check (platform sum vs. CRM actuals), standardize UTM taxonomy across all campaigns, and surface CRM-verified CPA and pipeline in a single dashboard no ad platform controls.
- Good enough attribution means UTM coverage above 90%, CRM source fields on 95%+ of closed-won deals, and platform data used for optimization only — never for budget justification.
Google Ads claims 47 conversions. Meta claims 52. LinkedIn claims 31. Your CRM shows 38 closed customers.
Someone is lying – and it’s not your CRM.
If you’ve ever pulled platform reports into a single spreadsheet and watched the numbers explode past anything resembling reality, you already know the feeling. The sum of what every platform claims credit for routinely exceeds your actual customer count by 50%, sometimes 100% or more. You’re not miscounting. You’re watching every ad platform grade its own homework.
When platforms grade their own homework, everyone gets an A+.
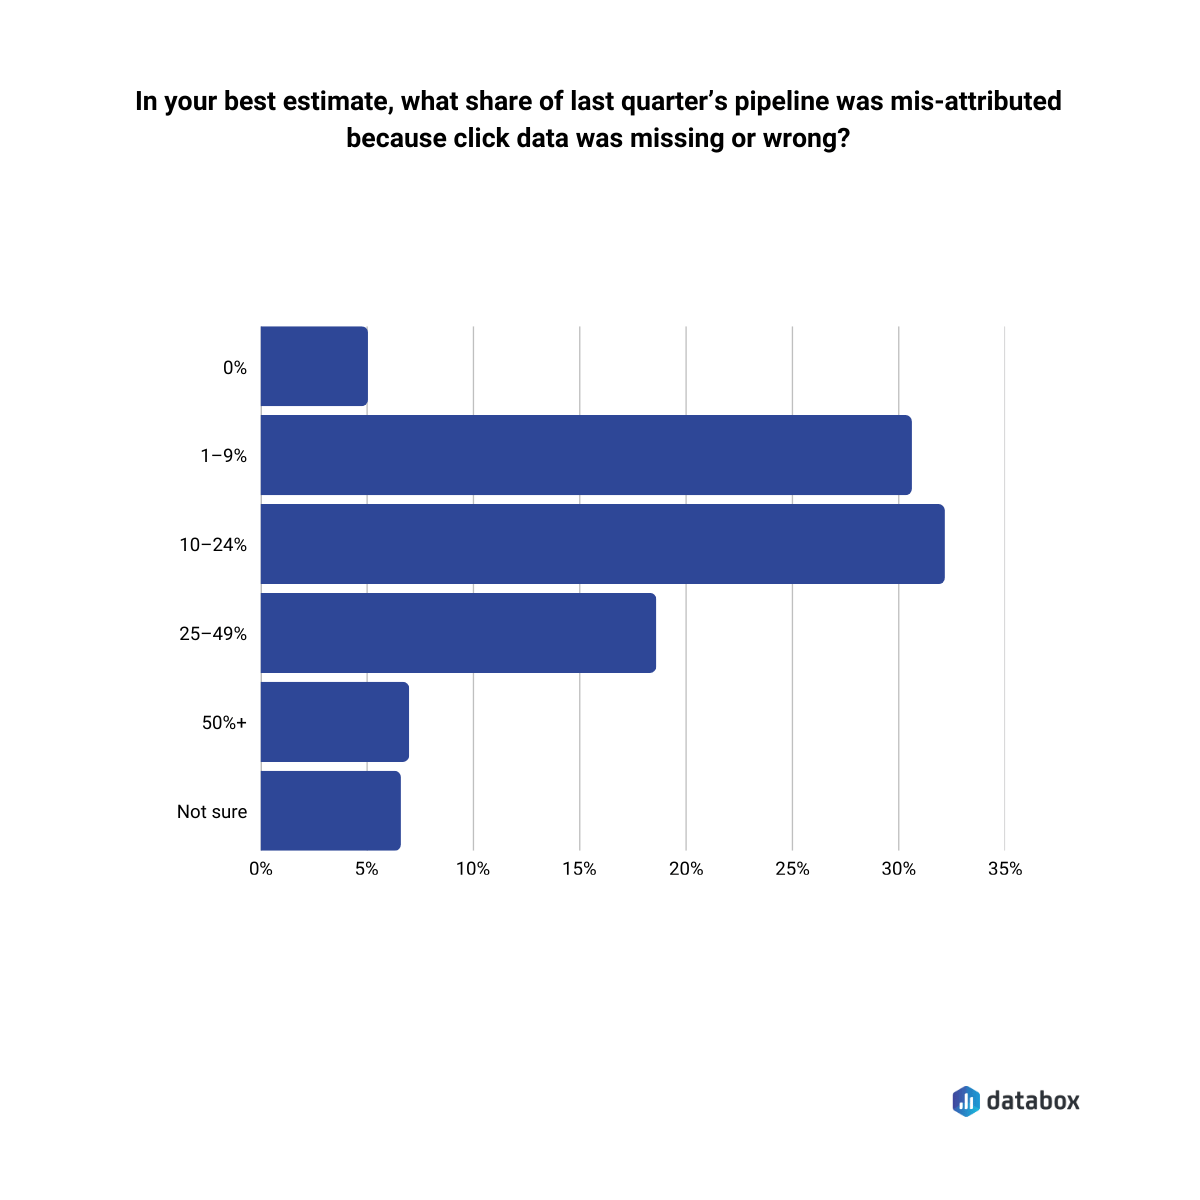
The over-counting is not a broken pixel or a misconfigured UTM. The over-counting is intentional—built into the incentive structure of every ad platform that sells you impressions and measures its own performance. According to Databox research on attribution, one in four GTM leaders said at least a quarter of last quarter’s pipeline was misattributed due to missing or incorrect click data. Nearly 7% reported error rates of 50% or more.
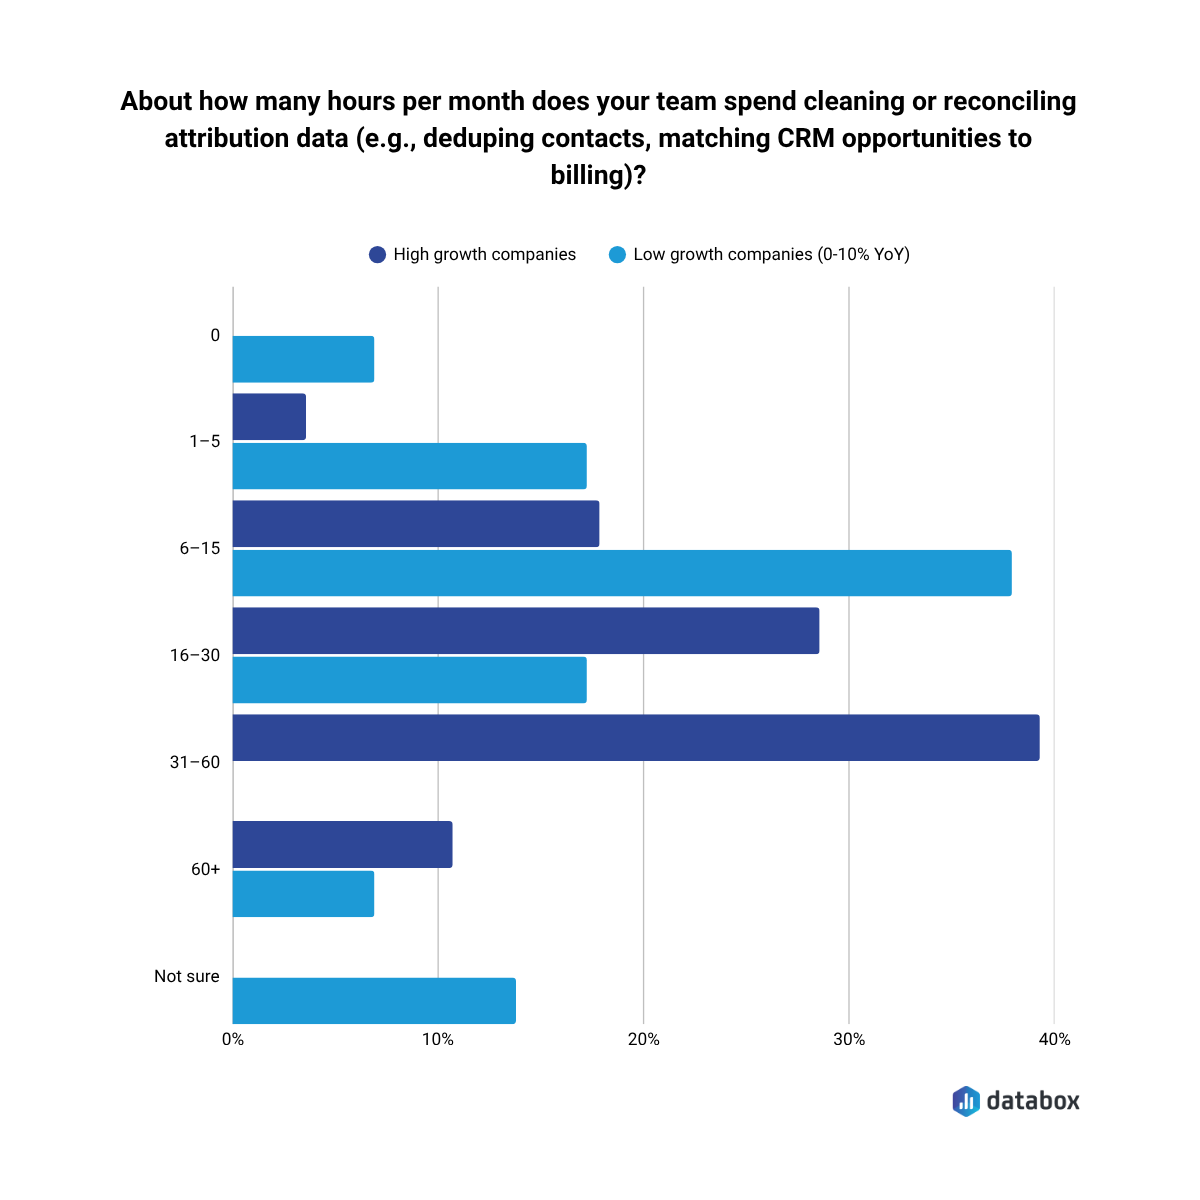
In the same research, 32.43% reported spending 16–30 hours per month just cleaning and reconciling attribution data, before any analysis happens.
By the end of this article, you’ll understand why the numbers are structurally wrong, which data to trust and in what order, and how to build an attribution view that supports real budget decisions—not one that validates whatever each platform wants you to believe.
Why Every Platform “Wins” the Same Conversion
Attribution over-counting is a revenue model problem, not a data quality problem.
Every ad platform measures its own performance against the widest possible window it can defensibly claim. The result: summing all platform-reported conversions routinely produces 150–250% of actual closed customers. Three platforms, one customer, three conversions counted.
The mechanical cause is attribution window conflicts. Meta defaults to a 7-day click / 1-day view window. Google defaults to a 30-day click window. LinkedIn uses its own rules.
A prospect clicks a LinkedIn ad on Day 1. Clicks a Google Search ad on Day 12. Converts on Day 14. All three platforms count the conversion. None of them are technically wrong by their own rules.
View-through attribution is the most abused lever in the system.
On January 12, 2026, Meta permanently removed two attribution windows from its Ads Insights API: the 7-day view and 28-day view. The change was announced in October 2025. Most advertisers missed it.
The practical result: if you run awareness campaigns or target prospects with longer consideration cycles, a portion of your previously attributed Meta conversions stopped being counted overnight — not because performance dropped, but because the measurement window shrank. Industry analysis puts the conversion drop at 15–30% for accounts that relied on those longer view windows.
Then in March 2026, Meta reclassified what counts as a “click.” Likes, shares, and saves no longer trigger the 7-day click attribution window — only link clicks do. That’s a second, quieter conversion drop that most teams haven’t diagnosed yet.
If your Meta numbers look worse than Q4 2025 without an obvious performance reason, you’re likely looking at a measurement shift, not a channel decline. Before cutting Meta budget, run the CRM reconciliation check: how many closed customers does your CRM attribute to Meta over the same period? That number hasn’t changed. Only Meta’s count of it has.
A prospect sees (does not click) a Meta display ad, then searches your company on Google, then converts. Meta counts it. The mechanic is not fraudulent, but platforms default to having it enabled, and the numbers inflate in ways that benefit the platform, not your understanding of what actually happened.
The structural incentive is worth naming directly: these platforms have billions of dollars in quarterly revenue tied to demonstrating ROAS. Their measurement systems are not neutral observers. The same companies that sell you the impressions built the systems that measure whether those impressions worked. When the entity measuring performance is the same entity selling the product being measured, the measurement will favor the seller, every time.
Platform data is not useless. But it is unreliable as the sole measure of marketing’s contribution to revenue. The platforms were built to justify continued ad spend, while your job is to figure out what actually worked.
What Breaks When You Can’t Trust the Numbers
The attribution gap does not stay inside your spreadsheets. It cascades into every budget conversation, every channel decision, every forecast you hand to leadership.
Your VP of Marketing asks which channel to scale. You show them platform-reported ROAS, and LinkedIn looks like it’s outperforming Meta 3:1. But the CRM tells a different story: Meta-sourced leads close at twice the rate. The platform numbers pointed you toward the wrong channel.
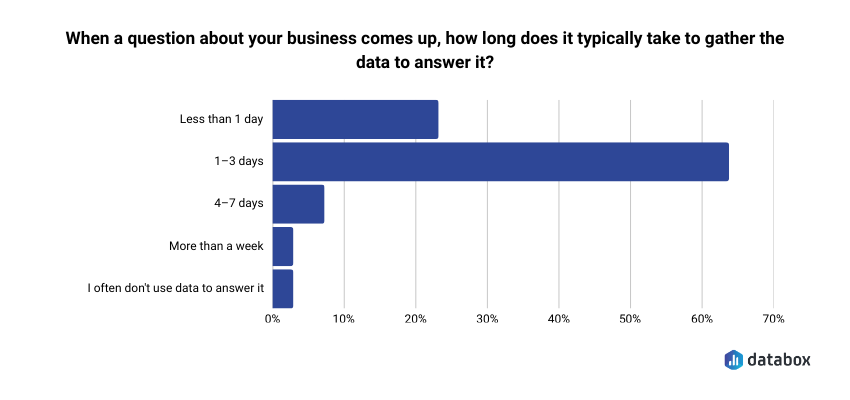
Your CFO asks what marketing contributed to pipeline last quarter. You can give them platform numbers (which add up to more customers than you actually have) or CRM numbers (which require manual reconciliation you haven’t done). Neither answer builds confidence. And the reconciliation work is not trivial: in Databox’s Time to Insight survey, 64.29% of respondents said it typically takes 1–3 days to gather data to answer a single business question—long enough that in most weekly reviews, the decision window has already closed.
Your demand gen lead wants to cut underperforming campaigns. But “underperforming” according to which system? Google’s conversion count? HubSpot’s lead source field? The numbers don’t match, so the decision stalls.
The cost of broken attribution is not bad data. The cost is bad decisions, or no decisions at all.
Which Number Do You Trust? A Hierarchy for Attribution Data
When data sources conflict (and they always will) the answer is not to average them or pick the one that looks best. A deterministic trust hierarchy exists. Follow it.
Tier 1: CRM Closed-Won Data
CRM data is not modeled. Not estimated. Not subject to attribution window interpretation. Closed-won opportunity records, mapped to their original lead source via UTM-populated form fields or CRM source tagging, represent ground truth.
The CRM is the only data source that records a human being giving money to your company.
Every other data source should be evaluated against the CRM. If your CRM shows 38 closed customers and Google claims 47, the CRM is right. Always.
Tier 2: Server-Side Event Data
Server-side tracking (Meta Conversions API, Google Enhanced Conversions, server-side GTM) fires from your own infrastructure, not from a browser-dependent pixel.
Server-side tracking is more reliable than client-side tracking because ad blockers, cookie deprecation, and iOS ATT restrictions do not affect it. Server-side data is not ground truth, it still routes through platform identity matching, but it is the most reliable signal below CRM data.
“Since the iOS14 update and he war between Facebook and Apple about data and privacy, it has been quite a challenge to track accurately the performance of Facebook/Instagram advertising campaigns. We found a solution by setting attribution channels with Google Analytics as well as using a tool like Hyros for our e-commerce customers. This way, we could measure more efficiently how the marketing campaigns performed and which channels brought the most leads, users, sales, ROAS and ROI.”
Tier 3: GA4 Cross-Channel View
GA4 has no financial incentive to favor any channel – it’s is channel-agnostic. That makes it more trustworthy than any individual platform’s reporting when evaluating cross-channel performance.
Its limitations (cookie-dependent client-side tracking, underreporting under privacy conditions) are well-documented and consistent, which means GA4 can serve directionally even when absolute numbers are unreliable.
Tier 4: Platform-Reported Conversions
Google Ads, Meta Ads Manager, LinkedIn Campaign Manager. All useful for in-platform optimization signals: bid strategy, audience performance, creative testing.
Do not use platform-reported conversions as the measure of marketing’s contribution to revenue. Platform dashboards were not built for that purpose – they were built to justify continued ad spend.
The Weekly Reconciliation Check
A concrete, repeatable workflow surfaces most attribution integrity problems before they compound into bad budget decisions:
Once a week, pull total conversions from all active ad platforms. Compare the sum to new leads or closed-won deals in CRM for the same period. If the platform sum exceeds CRM actuals by more than 10–15%, flag it as a tracking quality issue—not a budgeting success.
Running the check weekly prevents the slow drift where platform numbers become the default reality and CRM data becomes an afterthought.
What a Decision-Ready Dashboard Actually Looks Like
Before walking through how to build the system, look at what the end state delivers.
A decision-ready attribution dashboard shows you four things in a single view:
CPA by channel (CRM-verified)
Cost per closed customer by channel, calculated using CRM closed-won data—not platform conversions. When Google says a lead cost $47 but your CRM shows the actual cost-per-customer from Google is $312, the dashboard shows $312.
MQLs and SQLs by source
Total qualified leads from each paid channel, pulled from your CRM’s lifecycle stage fields—not platform-reported “conversions” that may or may not reflect actual pipeline.
Pipeline and revenue by source
Total pipeline value and closed-won revenue attributed by lead source from CRM. The number your CFO actually wants.
Cost per MQL/SQL by channel
The metric that tells you whether LinkedIn at $180/MQL is actually outperforming Google at $95/MQL once you factor in conversion rates down the funnel.
A marketing team using this view discovered LinkedIn was driving 2x the CRM-verified pipeline of Meta at equal spend. They reallocated budget. Pipeline increased materially quarter over quarter. The insight was not perfect attribution—it was directionally correct attribution acted on consistently.
The platforms will keep grading their own homework, while the dashboard grades them against reality.
How to Build It
A functional attribution system does not require a data engineering team or a six-figure analytics stack. It requires four things done in the right order: clean inputs, a reliable event layer, a CRM as the anchor, and a single dashboard that no ad platform controls.
Standardize Your UTM Taxonomy
Every paid campaign across every platform should use a consistent UTM structure:
- utm_source: platform (google, meta, linkedin)
- utm_medium: paid-social, paid-search, display
- utm_campaign: campaign name
- utm_content: creative ID or variant
Standardize the taxonomy now, enforce it with a naming convention doc, and audit it quarterly. Without consistent UTMs, CRM lead source data is garbage. The entire hierarchy below it fails.
Implement Server-Side Tracking
Deploy Meta Conversions API and Google Enhanced Conversions. Both are free to implement (cost is development time, typically 1–3 days with a developer or via server-side GTM).
Server-side tracking recovers a meaningful portion of the signal lost to iOS ATT and cookie deprecation. It reduces the gap between platform-reported and CRM-verified conversions, not because it makes platform data more accurate in an absolute sense, but because it reduces modeled fill-in, which is where the inflation is worst.
“Privacy first has impacted our productivity and spending since at least 2017. Since that time, 20–25% of people have used browsers that don’t support third-party cookies. As a result, the investments we make in adtech and martech tools are — at most — 75–80% effective. We fixed this by building a server-side protocol for collecting, storing, and distributing data online.”
Close the Loop in Your CRM
Every closed-won opportunity must have a mapped original source. Populate it from the UTM on the first form fill, the channel on the first touchpoint, or manual entry for high-touch pipeline.
HubSpot’s “Original Source” field and Salesforce’s “Lead Source” field are the minimum viable implementations.
Without CRM-level source tagging, Tier 1 data does not exist. Only platform data with extra steps exists.
Build the Unified Dashboard
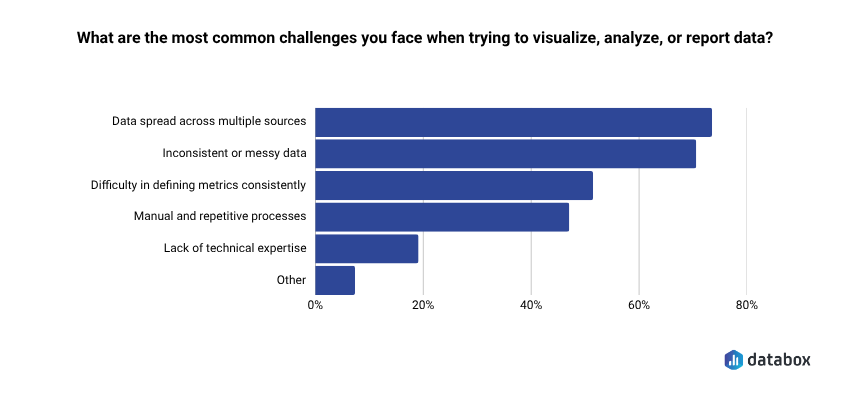
The final step is surfacing the right KPIs in a single view that no ad platform controls. That challenge is more common than most teams expect: 73.13% of respondents in Databox’s Time to Insight survey identified data spread across multiple sources as their top reporting challenge, which is precisely the problem a unified attribution dashboard solves.
Databox connects your CRM (HubSpot or Salesforce), your ad platforms (Google Ads, Meta, LinkedIn), and your pipeline data into a single dashboard—without requiring a data engineer or custom SQL. You can even get the full power over your data with datasets, which allows you to join tables, even between CRMs (as long as you have a common ID like email). You can calculate metrics like cost per MQL by dividing total Google Ads spend by MQL volume from HubSpot, then track the trend on a 12-week rolling scorecard.
Grab our pre-built paid ads dashboard templates
Track your Paid Ads metrics and KPIs and analyze your Paid Ads performance
If you’re also working on reducing wasted ad spend before you rebuild your attribution layer, this guide on cutting paid ad waste without losing pipeline covers the budget side of the same problem.
“One big challenge many SaaS businesses face is setting up business intelligence reporting that combines data from multiple sources. For example, at Preceden we use a cloud Postgres database for application data, Google Analytics and Mixpanel for analytics, Stripe and PayPal for payments, and Google Ads for advertising. To analyze marketing performance effectively we need to combine data from all these sources. We have a fairly complicated setup to address this: we use Stitch to centralize the data in a data warehouse, dbt to clean it up, and Mode Analytics to set up reporting. Tools like Databox make reporting much simpler by taking care of all this for you in one extremely powerful tool.”
The specific capability that matters: you can build the CRM-verified view—the one that tells the truth—rather than toggling between three platform dashboards that were never designed to agree.
What “Good Enough” Attribution Actually Looks Like
The most paralyzing belief in marketing attribution is that it must be perfect before it can be used.
Attribution cannot be perfect. The goal is not precision, but direction.
A system that reliably tells you Channel A drives 3x the verified revenue of Channel B is worth more than a theoretically perfect model you have not built yet. The 10–15% CRM reconciliation threshold is not perfection. The threshold is signal integrity.
What “good enough” looks like in practice:
- UTM coverage on >90% of paid traffic (not 100%, it is not realistic)
- CRM source fields populated on >95% of closed-won deals
- Weekly reconciliation check running consistently
- One dashboard showing CRM-verified CPA and pipeline by channel
- Platform data used for optimization, not for budget justification
The platforms will keep grading their own homework. Your job is to build the system that grades them against reality.
Begin with the CRM. Build the reconciliation check. Surface the numbers that matter in a dashboard you control.
That is how you build an attribution view your CFO will actually trust.
Frequently Asked Questions
What is ad attribution and why does it matter for budget decisions?
Ad attribution is the process of assigning credit for a conversion—a lead, a sale, a closed deal—to the marketing touchpoints that contributed to it. Attribution matters for budget decisions because it tells you which channels generate revenue and which generate noise. Without a reliable attribution system, you allocate budget based on what platforms claim, not what your CRM confirms. The gap between those two numbers routinely runs 50–150% in over-attributed environments.
Why do multiple ad platforms claim credit for the same conversion?
Each platform applies its own attribution window and conversion logic independently. When a buyer interacts with ads on LinkedIn, Google, and Meta over a 20-day period, all three platforms can legitimately claim the conversion under their own rules. Meta’s 7-day click window, Google’s 30-day click window, and LinkedIn’s default settings overlap by design—not by accident. None of the platforms are technically wrong. The conflict is structural, not the result of a misconfiguration.
What is view-through attribution and should I disable it?
View-through attribution gives conversion credit to an ad a user saw but did not click, if that user later converts within a set window. Meta’s default includes a 1-day view window on top of its 7-day click window. The mechanic is not fraudulent, but it consistently inflates platform-reported conversions because it counts intent signals (the impression) that the platform itself created, with no way to verify causal influence. Whether to disable it depends on your sales cycle and channel mix—but you should at minimum understand when it contributes to your numbers, because it almost always does.
Which attribution model is best for B2B SaaS?
No single model is universally correct, but position-based (U-shaped) attribution is the strongest default for most B2B SaaS companies with defined lead generation and conversion events. It weights first touch and last touch equally (40% each) while distributing remaining credit across middle touchpoints, which reflects the reality of a multi-stage buying journey without requiring a full data science build. For enterprise sales cycles with buying committees, linear attribution serves as a more neutral baseline. The model matters less than applying it consistently and anchoring final decisions to CRM-verified data.
How do I know if my attribution data is accurate enough to act on?
Run the weekly reconciliation check: sum all platform-reported conversions for the period and compare against CRM closed-won or new leads for the same window. If the platform total exceeds CRM actuals by more than 10–15%, you have an attribution integrity problem that needs investigation before budget decisions. Beyond that threshold check, look for UTM coverage above 90% of paid traffic and CRM source fields populated on more than 95% of closed-won deals. Meeting those thresholds does not mean your attribution is perfect—it means the signal is reliable enough to act on directionally.
What is the difference between client-side and server-side tracking?
Client-side tracking fires from the user’s browser via a pixel or tag. Ad blockers, iOS ATT restrictions, and cookie deprecation affect client-side tracking, which means it misses a growing share of conversions and increasingly relies on modeled fill-in to compensate. Server-side tracking fires from your own infrastructure (via Meta Conversions API, Google Enhanced Conversions, or server-side GTM) and browser-level restrictions do not affect it. For any team running paid campaigns at meaningful spend, server-side tracking is no longer optional—it is the minimum viable event layer for keeping platform-reported and CRM-verified numbers within a comparable range.


