


Table of contents
It’s that time of year. The painful ritual of creating an annual sales plan is upon us.
This time of year is a mix of reflection after another year about to close out, excitement about the possibilities that lie latent in a new year, and tremendous frustration from spending hours putting together next year’s plan.
This frustration could be acceptable if the planning process led to better results, but for the vast majority of organizations, it doesn’t.
The typical approach to annual planning is merely a remnant of the traditional growth playbook that never seems to change, regardless of results. In the end, the planning process ends up sucking time, resources, and attention from everyone involved.

Over the last decade, our team at Imagine Business Development has worked with hundreds of growth companies and studied the planning approach of thousands. We’ve seen, firsthand, that while most companies take an ineffective approach to planning, there are a few that have an entirely different experience with planning. For them, the process is invigorating and contributes to their competitive advantage.
We’ve taken these learnings and applied them to the approach we use with our clients. The results are dramatic, enabling us to make better, faster decisions, to adjust and iterate more effectively and to lower the costs associated with growth. I should also mention the approach has had a significant impact on reducing or eliminating individual and organizational stress and confusion.
What follows is an in-depth review of how we develop sales and growth plans. I’ll also be demonstrating how we do this on a live webinar we’re hosting on December 12th, at 2 pm ET (if you’re reading this after December 12th, you’ll be able to access this program OnDemand).
4 Factors That Predict Sustainable Growth
Make no mistake, the planning process is crucial. It was one of America’s great leaders, Dwight D. Eisenhower, who said, “In preparing for battle I have always found that plans are useless, but planning is indispensable.” While I hate to equate growing business with the battles of war, this philosophy certainly applies.
When planning is done right, it’s quite powerful and empowering. Solid plans lay the foundation for four elements of predictable, sustainable, and scalable results:
- Alignment. For alignment to take hold, there needs to be a single source of truth. Far too often, a company’s tactics leave things open to individual’s interpretation, creating multiple “versions of the truth.” When you’re aiming for robust and fast growth, even the smallest fissures in alignment place a drag on performance.
- Clarity. In the book Made to Stick, authors Dan & Chip Heath talk about the concept of “commander’s intent.” Inspired by the US Army, the term refers to the overall objective of an initiative. In a military operation, there are thousands of details to be shared and orchestrated between dozens of divisions and platoons. The concept of the “Commander’s Intent” was devised to ensure that no matter what a soldier is tasked with, they would always have a crystal clear understanding of the desired outcome. The Commander’s Intent could be as simple as “Get Platoon 345 onto Hilltop 24 and neutralize all threats”. Nothing confusing or ambiguous about that. If you’re a soldier, whether you’re in platoon 345 or not, you know the objective of this mission. Simple.
- Establish a clear hypothesis. Humans, especially adults, don’t learn unless there is an expectation first. This is why, for example, young children will ultimately touch a hot stove before they learn it burns you, regardless of how many times you warn them (and some children, like me, require three times). The objectives and initiatives laid out in your annual plan create that hypothesis that’s used to make adjustments.
- Faster iteration cycles. Planning can be a lot of fun for people because it’s a controlled process. My brother likes to say that the only thing that matters is what happens on day two. For him, day one means the plan is complete. It was the great philosopher Mike Tyson who said, “Everyone has a plan until they get punched in the face.” Day two is all about what happens once you start getting punched in the face. The company that grows the fastest or most profitably, or the salesperson who closes the most business isn’t the one who has the best plan. It’s the one that iterates the fastest.
Why Planning (Often) Fails
Through work we’ve accomplished, I’ve identified five reasons that so many plans fail:
The Annual Plan is, well, an Annual Plan
Do you know what’s going to happen in November 2018? Yeah, neither do I. Two weeks ago, I was working with one of my client’s and his team on structuring their annual plan. The CEO was complaining that they needed more certainty so he could determine if he was going to hire in the fourth quarter. I responded that we should consider Q4 hiring needs at the end of Q2.
I hate annual plans with an annual timeframe. Instead, I’m a big fan of annual plans that can be modified every quarter. Yes, I know that you can barely get through this exercise once a year and you’re sure as hell not going to do it four times. Read the rest of this article where I’ll share how this approach will take less time, create less disruption and drive far better results.
Confusing Goal Setting With Planning
A very common (and bad) planning methodology starts out in one of two ways:
- What would we like our growth rate to be next year? (Or, how much revenue do we want to shoot for next year?)
- Let’s look at what we did last year (or the last few years) and inch up the targets from there.
Don’t get me wrong, I love and value goal setting. The problem is that neither the world or the market care what you want to do or even what you need to do. You need to figure out what you can do.
I see this problem all of the time with funded companies. The executives will say something like this to me, “We need to be at $xx million in the next 12 months, or we won’t be able to raise our next round,” or “If we don’t hit this number by the next board meeting, we’ll be in trouble.”
Goals are an essential part of a good plan, but they should not be the drivers. Instead, reality should be.
PRO TIP: How to Set SMART Goals for Your Sales Team’s Performance
To decide which goals meet the SMART criteria, sales managers need to look at sales analytics for their teams and monitor sales KPIs, for example:
- Average Time to Close Deal
- New Deals Amount
- Number of Customers
- Average Revenue per New Customer
Based on these metrics, and in light of other revenue-based and activity-based goals, you can identify and set desired goals for future performance, but how to get this information?
Now you can benefit from the experience of our sales experts, who have put together a great Databox template showing an overview of your sales team’s performance. It’s simple to implement and start using as a standalone dashboard or in sales reports!

You can easily set it up in just a few clicks – no coding required.
To set up this Sales Analytics Overview Dashboard, follow these 3 simple steps:
Step 1: Get the template
Step 2: Connect your HubSpot account with Databox.
Step 3: Watch your dashboard populate in seconds.
Using Your Gut Instead of Data
The first question I ask when I assess a company’s plan is, “How was this target set?” The answers I get are all over the place, but what they are all filled with assumptions backed by assumptions.
At its core, revenue planning is a highly disciplined math exercise. If you don’t have disciplined math, backed by reality-based data, you won’t have a valid plan.
Use the insights gotten from these free sales dashboard examples to inform the plan you draw for your business.
Failure to Invest Properly
Building a go-to-market program is the equivalent of creating a machine that produces cash flow. It’s no different than investing in an industrial machine that produces a volume of product, or in the dev team and technology stack that will allow a SaaS company to scale the product.
I’m amazed by the discipline and realism executives put towards determining what needs to be invested on backend items that are necessary to deliver the product, and then use absolutely no discipline when assessing the investment they need to make in the “machine” that produces sales.
When I analyze companies that aren’t hitting their growth targets, the failure to invest enough towards customer acquisition cost (CAC) is a core underlying cause of the failure more than a company spending too much, by a factor of about 100x.
In the planning process, you need to determine either:
- What you need to allocate and invest to achieve your objective, or…
- The results you can expect from what you are willing to spend.
Putting Execution Ahead of The Model
Growth-focused people are naturally biased towards action. They typically lack patience and want to jump into the tactics. So they figure out the goal and get right into the initiatives and tactics.
Basically, they skip the math and the assessment that’s required to bring reality into the plan. As a result, the plan creates the feeling of greater clarity and certainty, but because it’s built on so many flawed assumptions, it fails to deliver on the key objectives I described in the section on the importance of plans.
Parts of an Effective Annual Sales Plan
Plans are unique to every company. While there is no one “right” plan, there are some key components that should be core parts of every strong plan:
- The Math
– The Economic Model
– The Sales Model
– Key Metrics - Outline of Initiatives and Actions
- The Execution Roadmap
- Monitoring, Tracking, and Adjusting
Building the Economic & Sales Models
Your go-to-market plan is, in its essence, an exercise in math. As HubSpot CEO Brian Halligan has shared, the difference between the startup phase in business and the scale-up phase is, “Do you know your math?”
I can say, unequivocally, that the biggest surprise I’ve experienced while advising growth companies and their service providers is how little attention they pay to the math. Let me put this as simply and clearly as I can.
If you don’t know your math, you cannot sustain predictable or scalable growth. Worse, you won’t know about the threats impacting your business until it’s too late.
I’ll admit that this section of the plan is challenging and not a lot of fun, but it is critical to removing the black curtain that makes achieving your objective so difficult and disruptive. There are two models you must create.
The Sales Model
If Alice in Wonderland was here, she would say, “If you don’t know where you’re going, any road will get you there.”
There is a myriad of ways to design your sales model, and ultimately, the right one for you will need to be customized to the unique attributes associated with your business. Here’s the baseline model we use.
To start, you need to answer these questions:
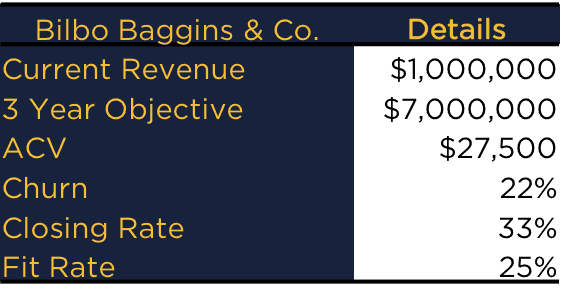
- What is your current revenue?
- What is your target revenue 3 years from now? (While you can use whatever time frame you want, we like using 3 years because it’s long enough to big things to happen, it enables you to grow through you annual objectives, and it’s not so far in the future that it has little meaning.)
- What’s your current ACV or the average revenue you get from a customer/client in a year? (Many companies that have different customer or product segments that have a wide variance in ACV. In these cases, using an average isn’t going to be helpful. In these cases we would, in essence, create a sales model for each segment.)
- What’s your churn rate? (You can calculate your churn rate by determining the percentage of revenue your retain from one year to the next and subtracting that from 100%.)
- What is your closing rate? (There are many definitions of close rate, so for this exercise determine how many prospects or sales opportunities need to get to the final stage of your customer acquisition process for one to become an customer.)
- What is your fit rate? (Calculate by determining how many sales qualified leads (or equivalent) you need to get one to the last stage of your customer acquisition process.)
When you have the answers to those questions, you’re ready for the fun to begin (yeah I know, I already admitted that nothing about this is “fun”). You can create a spreadsheet to do the calculations or feel free to download the calculator we’ve designed to do the hard work for you and allow you to run multiple scenarios.
To illustrate how this works, I’ll run a client model we recently built (the name of the company has been changed and although the story doesn’t matter, the numbers and process do).
Bilbo Baggins & Co. is a two-year-old technology advisory and services company looking for high growth. They completed their Series A round three months ago, raising $4 million. Having just hired a new head of sales, they were looking to get everything in place to drive a highly successful demand generation and sales effort.
They’d just crossed the $1MM annual run rate line, with a goal to hit $7 million in the next 3 years, with a stretch goal of $10 million. Here are the rest of their “vitals”:
Now we need to figure out how much new revenue they must create to meet their objective:

They need to generate almost $8.2 million of new business to net $6 million in revenue growth because of their churn rate. So, how many new clients, opportunities and sales qualified leads would they need to make that happen?
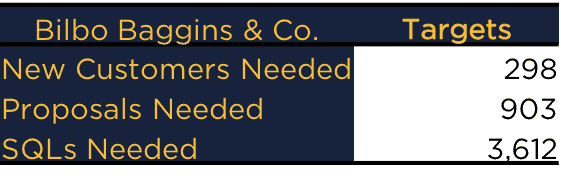
I probably don’t have to tell you that they were a bit taken aback when they saw this number. While they knew the growth targets were aggressive, they did not anticipate the need to create more than 1,200 sales qualified leads per year.
It quickly became clear that this approach would not work. They wouldn’t have the sales or marketing talent to support that type of volume or the funds to invest in demand generation to yield the volume of leads that would be necessary.
This highlighted the need to adjust the growth model. To that end, we identified three key inflection points:
- A 22% churn rate was too high. They needed to implement initiatives (and make investments) in customer success.
- The closing and fit rates needed to be improved.
With the model setup, we were able to run multiple scenarios to determine both the target results and what would need to be done to make those targets realistic. Ultimately we agreed to pursue goal of 235 new customers, realizing there would be significant work that needed to be done to improve the areas we identified. We also knew we had a little wiggle room because the long-term plan was to increase ACV. We were comfortable moving forward with this assumption because we knew it wouldn’t be another year before we stress tested the model. At the longest, it would be 90 days.
The Economic Model
With clarity and reason for the targets we were shooting for, the next step was to determine the economic model that would enable all of this to happen.
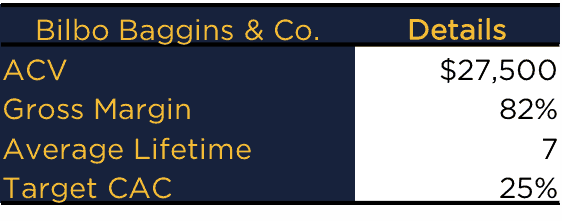
As with the sales model, you’ll need answers to these questions:
- Your ACV
- Your gross margin
- The average lifetime of a customer. (Note that your answer to this question should align with your churn rate. If you have a 25% annual churn rate, average lifetime should be 4 years.)
- How you’ll break your customer target down by each year.
- What you’re willing to invest towards customer acquisition costs. (You determine this as a percentage of the lifetime value of a customer.)
For Bilbo Baggins & Co., here’s how it broke down:
Given their aggressive growth target and the desire to be conservative in the early stage of the launch, we broke new customer acquisition targets as 39 in year one, 78 in year two, and 118 in year three.
Time to go back to the model and run some calculations:
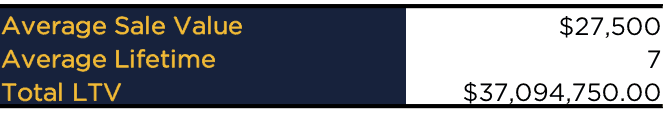
If Bilbo Baggins & Co. can deliver on their objectives, there’s a pretty big pot of gold waiting for them. Now pause for a moment and think about the “money-making machine” they want to build. Think of it this way. What would you invest in a machine that would produce $37 million?
Answering that question is our next step:
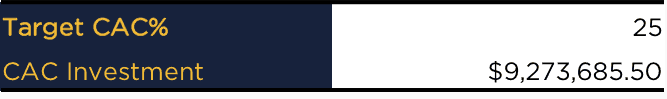
Upon seeing (and admittedly challenging) this analysis, the CEO commented that they needed to change their funding plan and what they were allocating towards customer acquisition. Now, I’ll admit when I share this type of analysis, I’m often taken aback by the investment required. When you think about it, investing $9 million to generate $37 million isn’t a bad deal.
Plus, there was some additional good news. No one was going to be writing a check for $9 million that day, nor was $9 million being put at risk. As I’ve shared, we’re big fans of iteration at Imagine, so we also ran the analysis for year one:
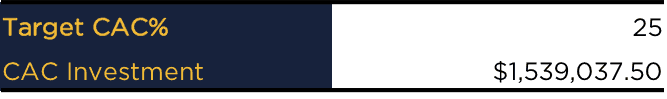
The CEO and head of sales both admitted that they had not realized or planned for this type of commitment to business development. They also agreed that if they had gone with their initial theory, they would have underinvested in the effort and focused on the wrong things (as we learned from the sales model). The VP of Sales even commented that he now knew why the last startup he worked for failed to hit the targets.
Not everyone reading this post is a Series A startup looking to scale growth rapidly. The process and the math are still the same, regardless of your size or growth objectives. Before you can predictability create growth, you have to be clear on what needs to happen to achieve your targets.
Key Metrics
The next piece of the plan is to identify the key performance indicators that align with the models developed. These focused on some items including:
- Lead volume (use this sales leads dashboard to track your lead volume in real-time)
- Lead velocity
- Leads managed per rep
- Fit rate
- Close rate
- Cost per SQL (which in this case was targeted to be $5,209.93)
When developing your key metrics, there are two items to keep front and center:
- Be sure you’re monitoring leading indicators rather than lagging ones in your sales dashboard software. The purpose of metrics in an annual plan is to give your insight into what is going to happen, rather than what has already happened.
- Be sure you’re focused on what I call efforts and not activities or outcomes. Efforts are activities that one has control over that have a causal relationship to achieving your objectives.
Establishing How You Will Hit Your Goals
The focus of this section of your plan moves to how you’re going to make it happen. With the model clear you can now confidently determine how many leads need to be generated, what your conversion rates need to be, and how leads need to be managed. You can also assess your staffing needs and establish action triggers based on specific outcomes.
Two essential questions must be answered in this section of your plan:
- The first, and probably the most essential planning question you can ever focus looks like this: Imagine we’re a year into the future, and we’ve failed to achieve our targets. What happened that caused us to fail?
- The second is: Now imagine we’re a year in the future and we’ve achieved our objective. How did we do it?
With clear answers to these two questions, your job now is to outline the tactics that support the answers to the second question and address the answers of the first.
Executing the Plan
The best way to describe execution in a single word is… it’s a bitch. It’s a challenging, complex paradox, best described as:
Be sure to give your efforts enough time to work and make sure you don’t wait too long to adjust.
The philosophy sounds great, except how do I know what enough time is without it being too much? Simple answer: you can’t.
This is why we created the idea of Acceleration Cycles. For most companies, we recommend 90-Day Acceleration Cycles. If you’re in hypergrowth mode, we recommend 30-Day Acceleration Cycles.
An Acceleration Cycle is the equivalent of the typical annual plan. This means if you’re running 90-Day Acceleration Cycles, you’ll create four distinct annual plans every calendar year. Now think about this for a moment. How much faster would you grow if you experienced four cycles in a year (or 12), instead of one?

An Acceleration Cycle starts with execution. It’s no different than what you most likely do after a plan is complete. In the course of a cycle, we recommend at least one adjustment period. If you’re running a 90-day cycle, we typically have two periods (at the end of each month), and if you’re running monthly cycles, we recommend a period every week.
An adjustment period is simply a quick check-in on progress. It’s a review of your assumptions, checks on progress, confirmation of what is progressing and identifying where things are off so that you can make adjustments to hit (or if necessary, change) your targets. An adjustment period is not the time to take a deep dive or to “rethink” things, that’s what happens at the end of an Acceleration Cycle.
Think of Acceleration Cycles as a sailor would view a journey. Each cycle represents a waypoint towards your ultimate destination. Each adjustment period is the check-in the captain and crew would make to ensure they get to each waypoint.
This approach provides several advantages, the biggest of which is creating clarity and certainty for those responsible for executing strategies while maintaining the flexibility and agility to stay ahead. When cycles are too long (like annual planning) the need to change is out of sync with your methodology. This leads to confusion and the feel that everything is always changing. If the cycles are too quick, then there’s no opportunity to get traction.
Each cycle ends by completing the entire process outlined here. While on first blush this may seem like a Herculean task, it’s quite the opposite. Your Acceleration Cycle length is designed to be long enough for meaningful progress to occur, but not so long that everything has changed.
By increasing the cadence of your “annual” planning to 4 – 12x per year, it stops being a disruptive project and becomes an iterative process that reinforces alignment and increases the speed of your execution.
Monitoring & Tracking
The glue that holds the entire process together, and is core to creating predictability, are the last part of our process. When developing your approach to monitoring and tracking, there are three aspects you must define:
- The Comfort Zone
- Dashboards
- Reporting Cadence
The Comfort Zone
Most companies pay attention to too many things, rather than not enough. The trouble with any growth effort is that if you want to find a reason that something isn’t working, it’s easy to do. The creates tremendous pressure and confusion on those responsible for implementing a strategy or plan.
A common complaint I hear from executives about their team in general, or with individual members is that they don’t show enough initiative and wait to be told what to do (this, by the way, is a typical complaint I hear from people managing millennials). The cause, however, is driven more often by leadership than by lazy or passive employees. The problem is that with so much change, people struggle to commit psychologically, or go “all-in,” because they assume everything is going to change.
That’s why we created the idea of the comfort zone. When adopting the comfort zone, you create two operating conditions: in-norm, and out-of-norm. In-norm is the comfort zone and represents a performance or progress band that indicates things are performing within the zone of expectations. When things are in the comfort zone, it means full speed ahead and no need to question or adjust (remember, you’ll be reassessing everything at the end of an acceleration cycle).
When things are outside the comfort zone, then attention needs to be paid, and adjustments need to be made. Realize that out-of-norm does not just mean things are underperforming; it also happens when you’re outperforming expectations above a certain level. When the goal is predictable and sustainable revenue, the failure to assess and adjust when things are unusually good can be just as dangerous as when they are bad.
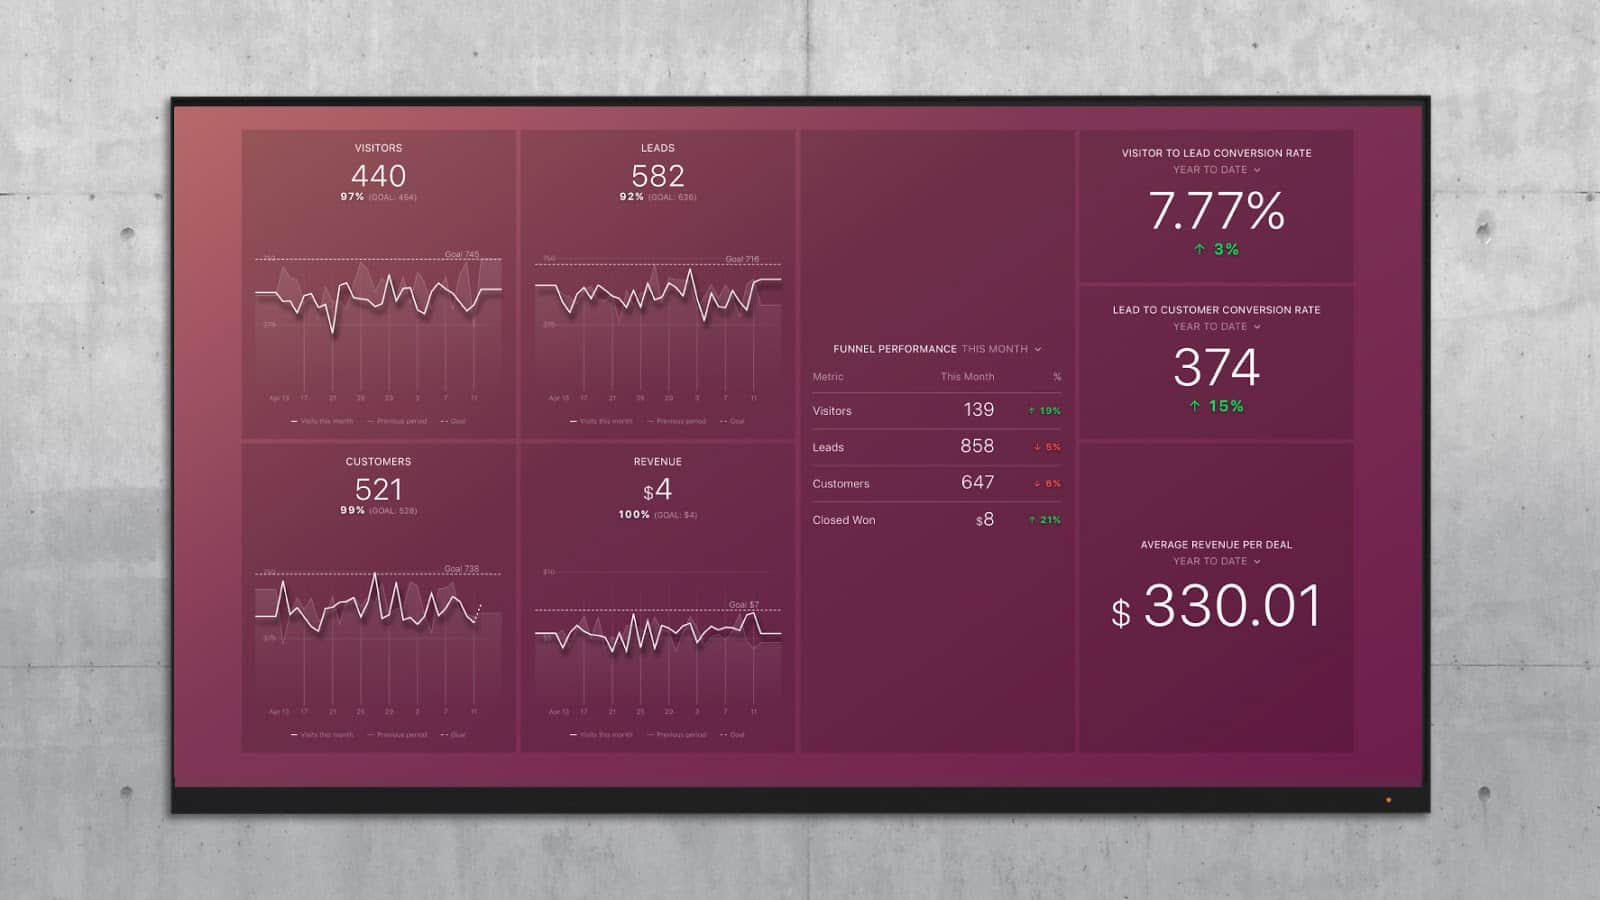
The Dashboards
The sales performance dashboards you develop and use will depend on the key metrics you’re using and the initiatives and actions you’re implementing in your acceleration cycle. The purpose of the various dashboards you use is to serve as a flash-type report. They should be designed to communicate whether things are in the comfort zone or not. When a dashboard shows something out of the comfort zone, that is when you dig deeper to assess and adjust.
As with most metrics, the fewer dashboards you use, the more effective. Here are some of the standard dashboards we regularly recommend:
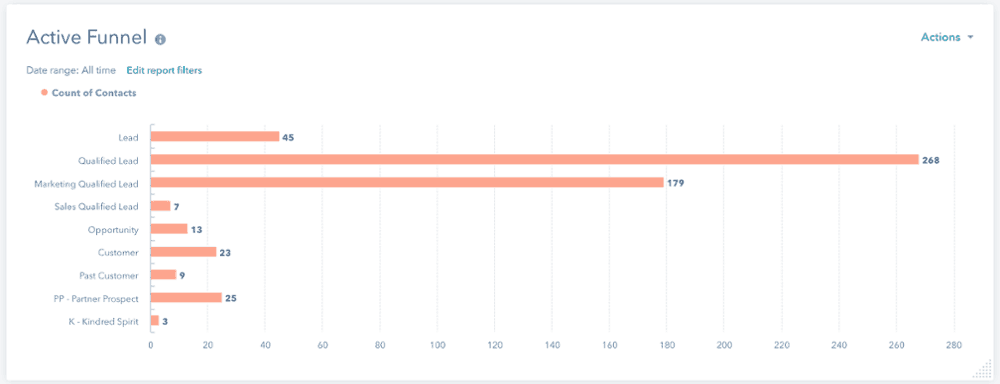
The Active Funnel
The Active Funnel Dashboard gives you a snapshot of what your funnel looks like at a point in time. You can build this one yourself within HubSpot. See also these free sales funnel dashboard examples.
The Sales & Marketing Waterfall Dashboard
The waterfall provides quick insights into the key sales and marketing metrics that you’re tracking.
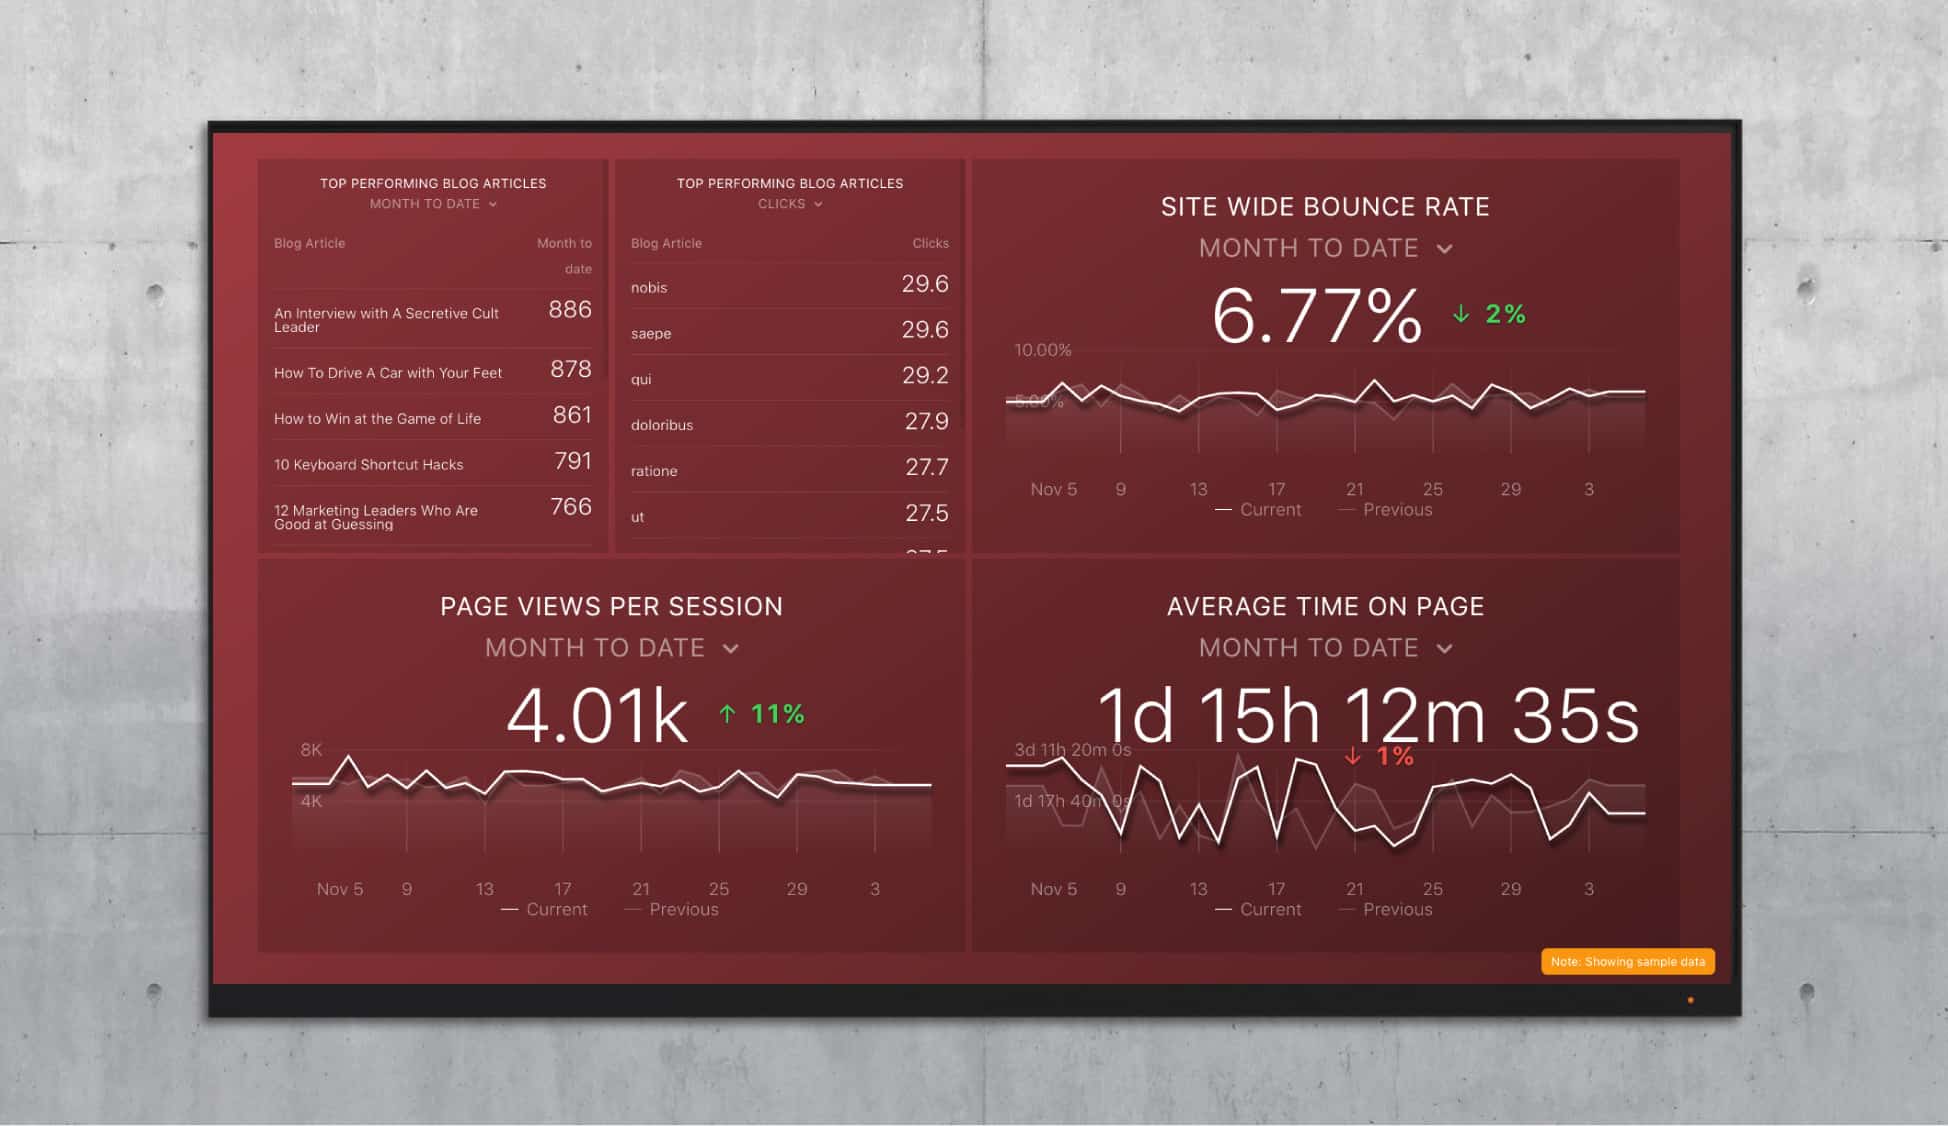
Content is typically an important part of a demand generation program; this dashboard gives you a quick view of how it’s performing:
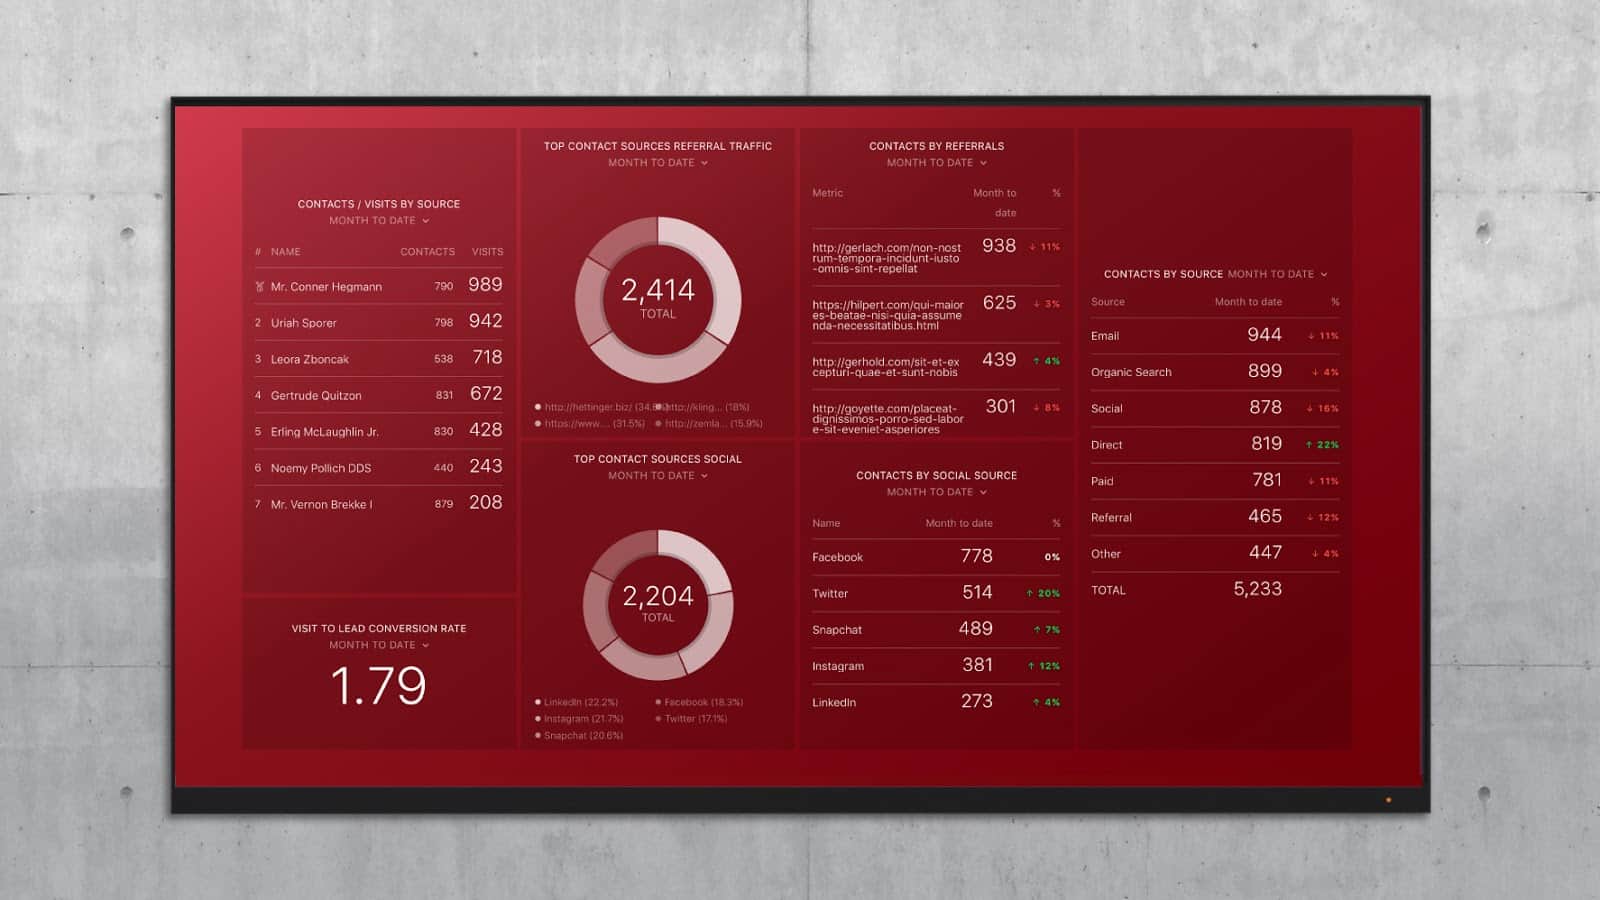
A dashboard geared to monitor the progress of your lead generation efforts is a must-have.
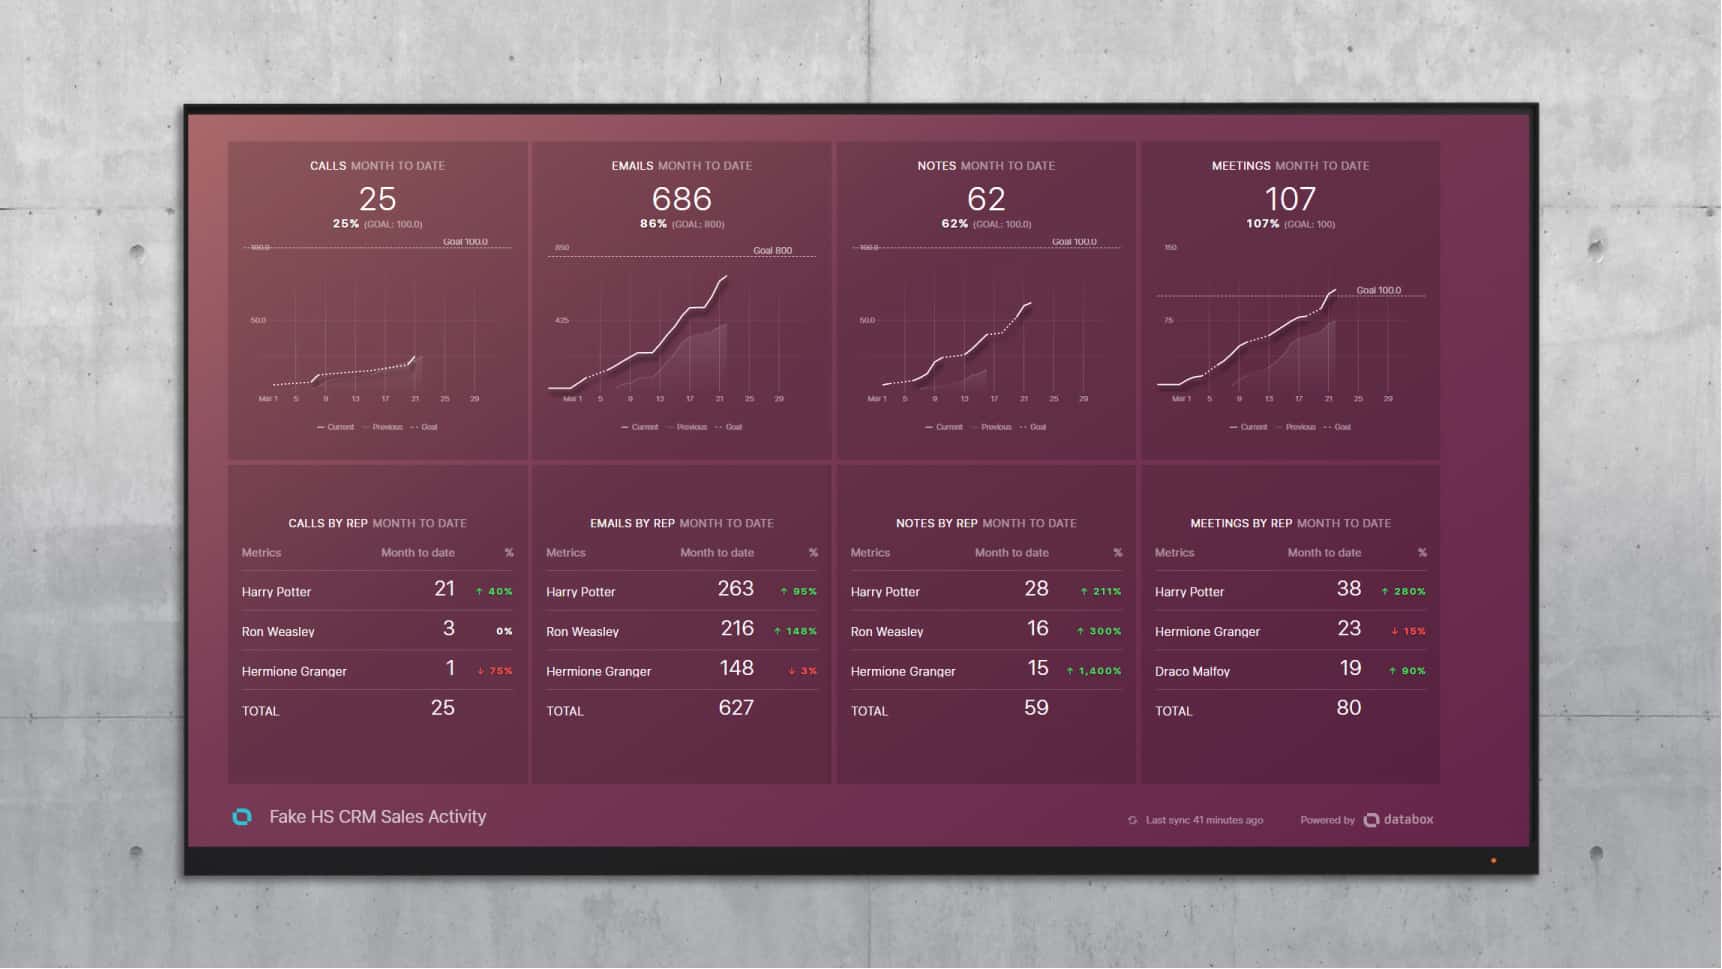
The ability to quickly check-in on the activity of the sales team is crucial for sales managers and marketing executives alike. This can be done using this sales team activity dashboard.
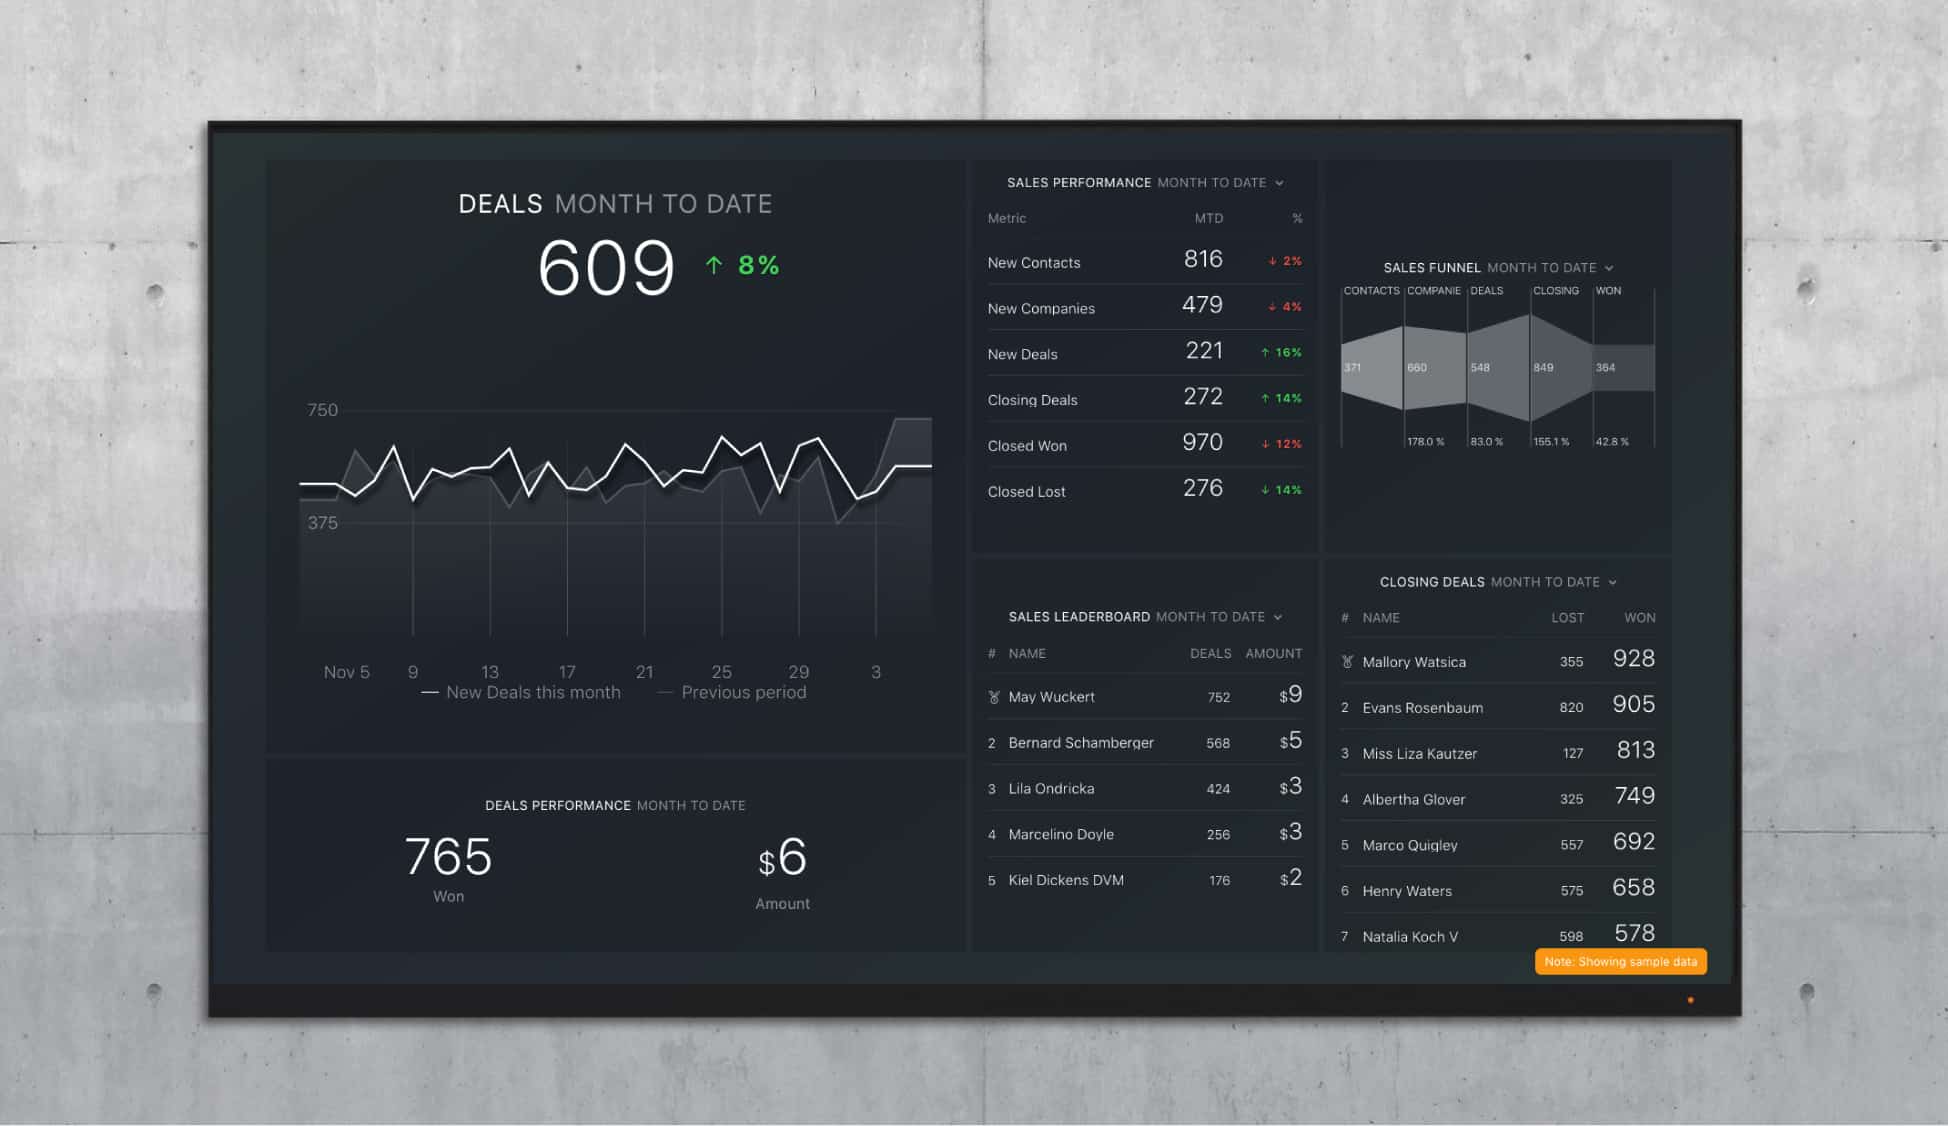
A sales pipeline dashboard focused on pipeline and deal progress is another core need:
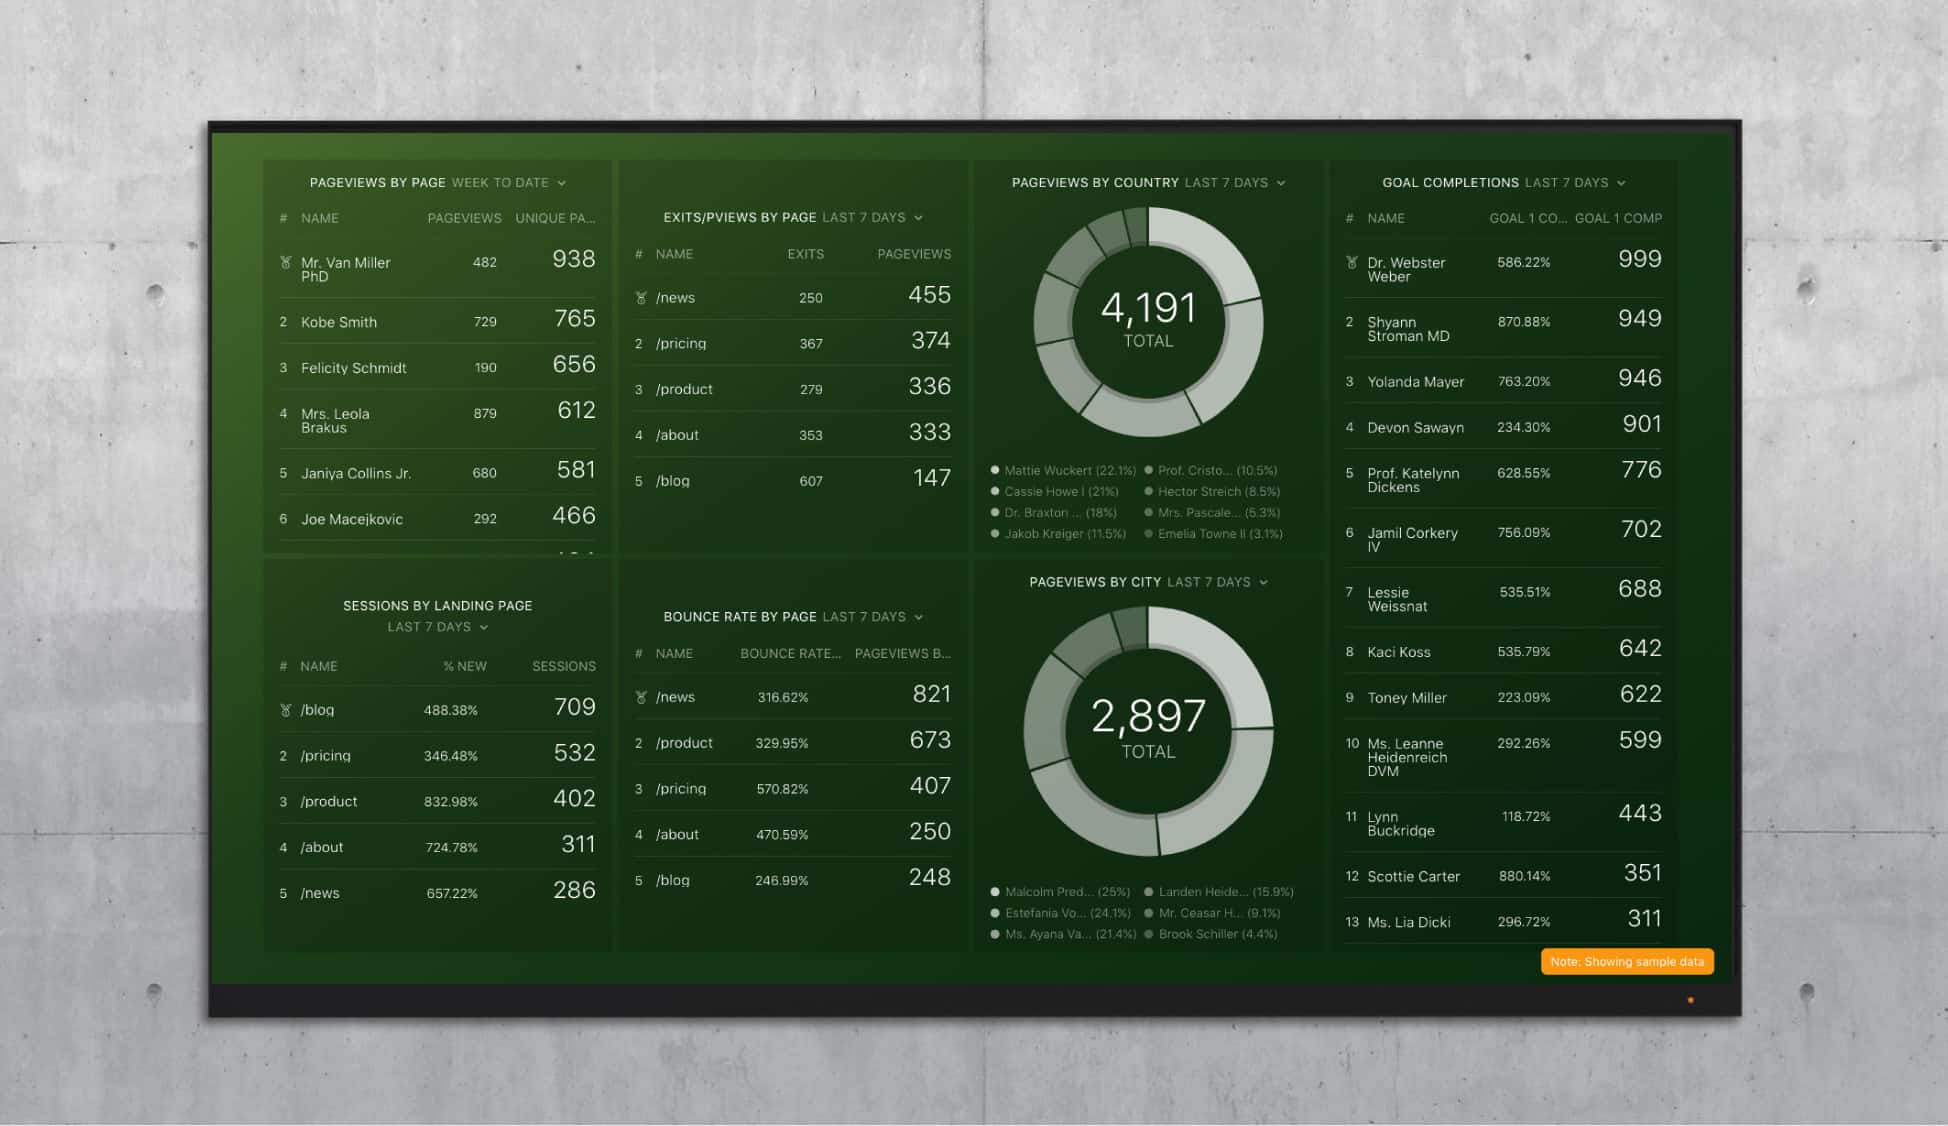
The web is crucially important to demand generation and is a common dashboard as well:
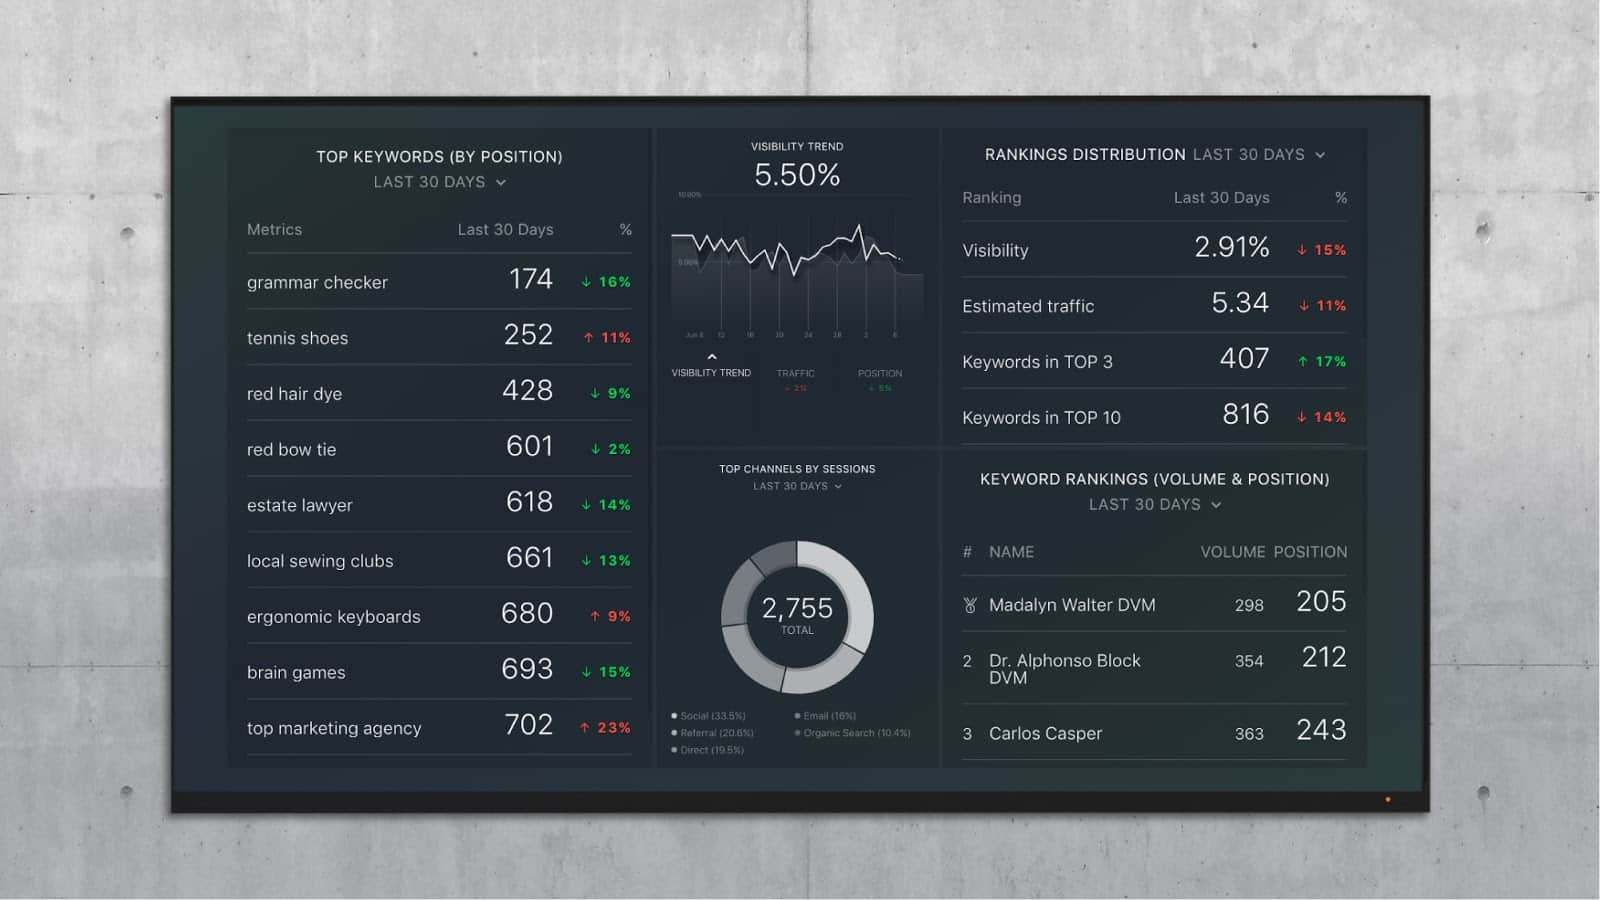
Essential tactics, like SEO, round out our commonly recommended dashboards.
Editor’s note: Discover the power of Databox by checking out our data snack on sales forecasting. Do you know how much revenue is in your pipeline this month? And what about the amount of revenue your team will close this month? You can answer these questions by doing a sales forecast. Here’s how you can visualize your sales forecast data from HubSpot CRM with Databox.
Reporting Cadence
The last piece to focus on is the timing of reporting. Here’s the cadence we recommend:
- Monthly Reporting: This report focuses on trends and progress. We’re focused on the main themes and progress of tests, experiments and initiatives. We’re going back to creating monthly reports, but the process will be much easier with the reporting we now have. These dashboards tell a story about what we’ve learned in the last month, how we’ll apply that learning going forward, and ensure clarity on the hypothesis, tests, and initiative for the next month.
- Weekly Reporting: This is more about KPI check-ins. We want to answer, “What do we see here that’s out of the norm?” I’ll also admit the focus is about 75% on early indicators that there may be a problem, with about 25% of what are we seeing that may indicate there’s an opportunity. We look at opportunities at the end of month, usually.
- Real Time/OnDemand: This leaves a whole series of dashboards and reports geared to monitor areas and actions that move the business forward.

Running a growth-focused business is complex. With the constant change and intensive environment we’re all operating in today, the challenge is significant.
The ability to create a strong foundation of alignment, to manage the inherent complexity we’re exposed to, and to accelerate organizational learning is crucial for any company. The approach outlined here creates that discipline and allows teams to stay ahead of the game while improving the predictability of outcomes.


