


Table of contents
If you want to collect better data, you need to ask better questions.
On the surface, this sounds simple. However, most people treat data like a Magic 8 ball. When in reality, they should be approaching data like a scientist.
In practice, this means starting with your hypothesis and coming up with the questions that will help you validate or invalidate it. The answers you find are the foundation for more compelling business intelligence reports.
Asking better questions also requires access to clear, trustworthy answers. Teams now use AI data analysts, like Databox MCP, to ask plain-English questions about performance and get responses based on their actual metrics, definitions, and historical data. Instead of manually pulling reports to validate a hypothesis, you can ask why conversion rates dropped last month or which channels influenced pipeline growth, and receive an explanation grounded in your own numbers. This makes it easier to test assumptions quickly and refine the next set of analysis questions with real context behind them.
In this post, we’re taking a closer look at 7 data analysis questions.
- Tools Businesses Use for Monitoring and Reporting on Business Performance
- 13 Data Analysis Questions You Can Use to Improve Your Business Reporting Process
- Improve Data Analysis with Databox

Tools Businesses Use for Monitoring and Reporting on Business Performance
In a recent survey we ran, 93.10% of our respondents said their company culture is data-driven.

For additional context, 44.83% of our respondents are working in B2C services or products, 41.38% are working in B2B services and products. And, 13.79% work for agencies.
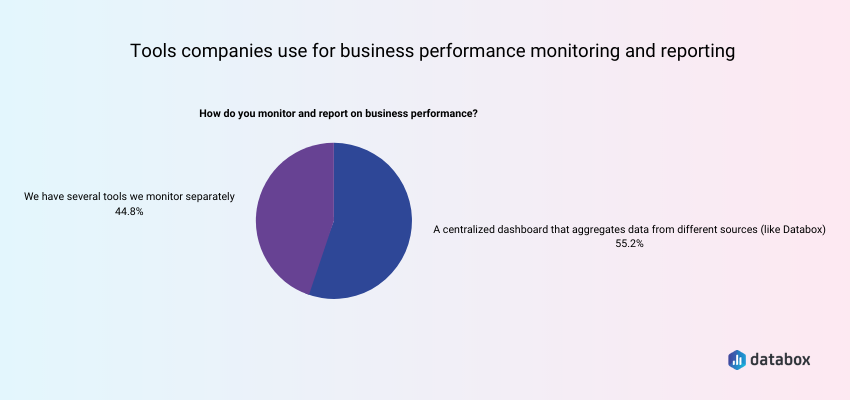
However, just because you say your company is data-driven doesn’t mean much. We wanted to find out exactly what kinds of tools and processes they are using to measure business performance.
In fact, more than half of our respondents have a centralized dashboard that aggregates data from different sources like Databox for monitoring and reporting on business performance. Still, more than a third of companies we polled for the recent state of business reporting research stated that they use between 11 and 25 tools for monitoring and reporting performance data, which is, indeed, a lot.
13 Data Analysis Questions You Can Use to Improve Your Business Reporting Process
One of the biggest mistakes we see both B2B and B2C businesses make is over-indexing on the tools they are using, and under-investing in the data they actually need to collect.
This usually happens when a company hoards all of the data that is easiest to collect. However, the easiest data to collect is rarely the most impactful for a business. Not to mention, if your dashboard or business intelligence reports are full of vanity metrics, most people will stop looking at them.
A better solution is to start by asking the right questions. When you ask the right questions, like the one outlined in this chart and section, it will lead you to the metrics that you most need.

Now, let’s see how each of these questions can be helpful in your data analysis process.
- What exactly do I want to find out?
- Where will my data come from?
- How can I ensure data quality?
- Which benchmarks will I use?
- Will I need to clean up my data?
- Which KPIs will I use?
- What kind of software will help?
- Which statistical analysis techniques do I want to apply?
- Who are the final users of my analysis results?
- What is the goal of the analysis?
- How should I visualize my data?
- How does this data compare to past performance?
- How often should I check my data?
1. What exactly do I want to find out?
One of the best questions to start with is to get clear on your business goal(s) and then ask yourself what data you need to make this clear.
“When analyzing data, we’ve found that asking the question “What do we want to find out?” can be incredibly helpful,” says Adam Rossi of TotalShield. “This question allows our team to narrow down exactly what they’re looking for and what the goal of the data analysis is. Is there an outcome that would signify success? An outcome that would signify failure?
We tend to start fairly broad, then “zoom in” as we go. Since using this question to begin our analysis, we’ve become more focused in our data reporting, and we’ve also been able to more effectively use our data to solve our business pain points.”
Claire Westbrook of LSAT Prep Hero adds, “The best way to ensure that your business reporting delivers meaningful data is to first establish a clear business strategy and then use key performance indicators (KPIs) to track how your company is performing against that strategy. We did a few key things to improve our analysis strategy using business reporting. First, we made sure to have a clear understanding of the goal of the report and what information is most important to achieving that goal.
Second, we focused on key areas of analysis that will provide the most insight into the data.
Lastly, we structured our report in a way that is easy to understand and makes it easy for others to find the information they need. By streamlining the data in our business reporting, we’re able to clearly see if we’re on track to meet our KPIs.”
One of the best ways to understand your goals, as well as your team’s progress towards them is by visualizing them. And that’s where Databox can help. See how goal tracking in Databox can make your performance more predictable.
2. Where will my data come from?
Once you know what data/metrics you need, you need to get clear on how you are going to dig up this information.
“We try to diversify our data sources through quantitative and qualitative methods,” says Albert Vaisman of Soxy. “This strategy allows us to broaden our perspective when drafting a business report. I have improved my analysis strategy through the use of visuals. Data can sometimes get too overwhelming if presented in a raw format. I use visualization tools such as graphs and pie charts to summarize how the business has performed over the last quarter.”
Related: Data Blending: 4 Use Case Examples to Improve Your Marketing Reporting Process
3. How can I ensure data quality?
It is not enough to just have the data. Your team also needs to be able to trust it, if you actually want people to make data-driven decisions. Data quality is hugely important, and comes in the form of both accuracy and diversification of sources.
For instance, Daniel Neale of Kitty Cat Tips says, “We also try to use as many data sources as possible, including first-hand interviews and focus groups. Once we have collected the required data, we carefully examine it to extract the best possible results for our business. We have improved our analysis strategy by using data visualization. Data can become challenging to identify when presented simply through numbers. But when you use visuals like histograms and bar charts, you make it easier for people to identify new trends and patterns. Hence creating meaningful visuals is an exceptional way to improve your analysis strategy.”
David Clark of Basement Guides adds, “Reporting can be complex when it comes to business. We have still managed to instill great cultural values within our employees. Our functional strategy of simplifying the collected data has been working exceptionally. Complex terms of business reporting may prove to be detrimental if the data collected is hard to understand. This is because the sales department requires every piece of information in the simplest form. Employees are actively trained not to waste their time waiting for data collection at our company. Instead, we make do with the given resources and simplify the available information. Team members are advised to bring whatever feedback they can find, using the SWOT analysis strategy, may it be from customer reviews or any other quantitative information. It helps find weaknesses within the product or service before it is released and showcases its strengths.”
Related: Google Analytics Data: 10 Warning Signs Your Data Isn’t Reliable
4. Which benchmarks will I use?
While the data you collect internally always takes the spotlight, it is always useful to get some industry data to which you can compare your results. Being able to compare data from integrations you are tracking to other similar companies in the industry is a great way to see how well your business is doing and which areas might need a bit more help or a change in strategy. So choosing benchmarks to which you want to compare your data is a great step towards more accurate business reporting.
Editor’s note: Databox’s Benchmark Groups allows you to benchmark your company’s performance against groups of similar companies anonymously and at no cost.
Instantly and Anonymously Benchmark Your Company’s Performance Against Others Just Like You
If you ever asked yourself:
- How does our marketing stack up against our competitors?
- Are our salespeople as productive as reps from similar companies?
- Are our profit margins as high as our peers?
Databox Benchmark Groups can finally help you answer these questions and discover how your company measures up against similar companies based on your KPIs.
When you join Benchmark Groups, you will:
- Get instant, up-to-date data on how your company stacks up against similar companies based on the metrics most important to you. Explore benchmarks for dozens of metrics, built on anonymized data from thousands of companies and get a full 360° view of your company’s KPIs across sales, marketing, finance, and more.
- Understand where your business excels and where you may be falling behind so you can shift to what will make the biggest impact. Leverage industry insights to set more effective, competitive business strategies. Explore where exactly you have room for growth within your business based on objective market data.
- Keep your clients happy by using data to back up your expertise. Show your clients where you’re helping them overperform against similar companies. Use the data to show prospects where they really are… and the potential of where they could be.
- Get a valuable asset for improving yearly and quarterly planning. Get valuable insights into areas that need more work. Gain more context for strategic planning.
The best part?
- Benchmark Groups are free to access.
- The data is 100% anonymized. No other company will be able to see your performance, and you won’t be able to see the performance of individual companies either.
When it comes to showing you how your performance compares to others, here is what it might look like for the metric Average Session Duration:

And here is an example of an open group you could join:

And this is just a fraction of what you’ll get. With Databox Benchmarks, you will need only one spot to see how all of your teams stack up — marketing, sales, customer service, product development, finance, and more.
- Choose criteria so that the Benchmark is calculated using only companies like yours
- Narrow the benchmark sample using criteria that describe your company
- Display benchmarks right on your Databox dashboards
Sounds like something you want to try out? Join a Databox Benchmark Group today!
5. Will I need to clean up my data?
Your sources of information and data could all be great, but at times, you might have some bad ones. Keep in mind that all sources within a business are motivated to provide data, so identifying which information to use and from which source has to be one of the top questions to ask about data analytics.
Now, why does this matter? Well, you are collecting and analyzing this data with a goal, in most cases, to make your business more profitable. So, if your data is incorrect, that means that what you will be looking at is not a realistic view of your business.
That means that you need to incorporate the step of “cleaning” your data sets. That way, you can discard wrong, duplicated, or outdated information.
6. Which KPIs will I use?
You also need to think about how the data you are collecting ties back to your overall business KPIs. This is another way to ensure that the data you are collecting is actionable instead of vanity metrics.
For example, Sandi Mazzeo of 301 Digital Media says, “One of the most important data analysis questions a company should ask in order to improve business reporting processes is: “What KPIs matter to your business?” Often, we find that businesses and clients focus on vanity KPIs like impressions, without an eye on the ultimate business objectives. Developing a focus on the KPIs that matter to a business’s overall success is really the best way to improve business reporting processes and, by extension, business performance.”
7. What kind of software will help?
Chances are, you are not going to find all of the data that you need in just Google Analytics or HubSpot. So, making a list of the metrics you are tracking and what software you need to find this information is a great starting point.
Then, once you have the data, how you present it matters. That’s where dashboard software like Databox can be helpful.
“Good presentation is vital to ensure decision-makers are presented with the information that they require to make informed decisions,” says Leanna Serras of FragranceX. “Dashboards are a great way for conveying real-time data insights at a glance. Data reports should compare current performance to previous performance and highlight anomalies. A common mistake is to confuse audiences with excessive and irrelevant data. The best approach for presenting data is to focus on a few key areas.
We have found great success in monitoring our website performance with a simple dashboard powered by data from Google Analytics. This enables us to see our page views, time on page, and bounce rates. It also breaks down our traffic by source including organic, direct, and social media which helps us measure the effectiveness of our marketing campaigns.”
Alex Williams of Find this Best agrees, “Data visualization has proven to be the best way to ensure that my business reporting delivers meaningful data. I believe presenting data with stunning visuals not only piques the reader’s interest but also makes it easier to process the information. In this day and age of being bombarded with visuals in daily routine, audiences are more likely to understand visually appealing data.
Adding relevant visuals to my business reports helps my investors and employees easily identify patterns and comprehend difficult information. I’ve improved my business analysis by adopting the BPM (business process mapping) strategy. With this strategy, my team and I can map out business processes with the help of visuals. We include flow charts, diagrams, and mind maps to understand our weak points and develop practical solutions.”
Editor’s note: Make comprehensive and easy-to-read quarterly reports for your investors with automated reporting software. This will allow you to automate the process of collecting and sending data and send it to recipients whenever you are ready.
Pro Tip: How to Stay on Top of the Financial Health of Your Business
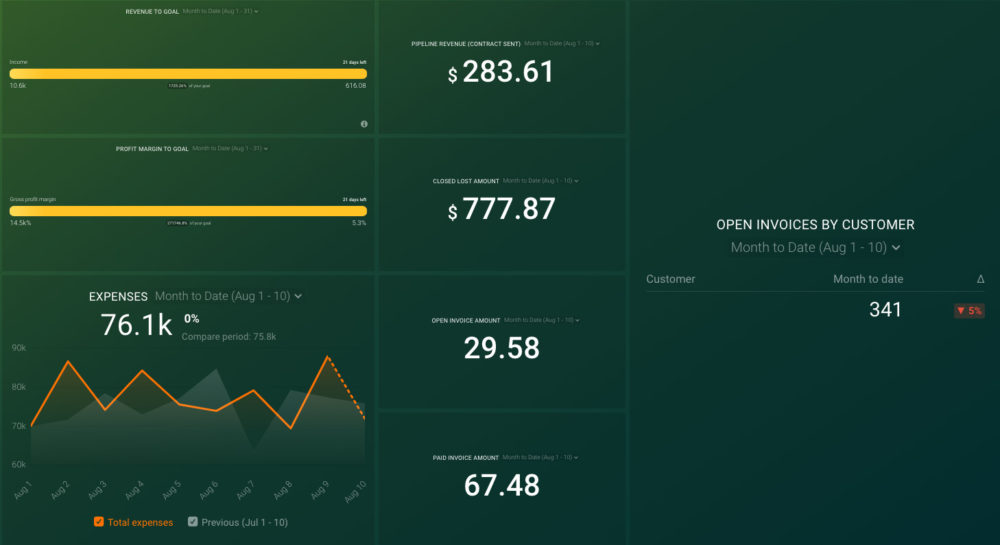
Do you own and manage a small business? Then you know how much of a struggle it can be to stay on top of the financial health of your business on a daily basis. Now you can pull data from QuickBooks and HubSpot’s CRM to track your key business metrics in one convenient dashboard, including:
- Open deals and deal amounts by pipeline stage. Get sales data directly from your HubSpot CRM and track deals, deal amounts, deal stages, and dates from your sales pipeline.
- Key financial data. Track gross profit margin, open invoices by amount and by customer, paid invoices, expenses, and income from QuickBooks.
Now you can benefit from the experience of our HubSpot CRM and QuickBooks experts, who have put together a plug-and-play Databox template that helps you monitor and analyze your key financial metrics. It’s simple to implement and start using it now!
You can easily set it up in just a few clicks – no coding required.
To set up the dashboard, follow these 3 simple steps:
Step 1: Get the template
Step 2: Connect your HubSpot and Quickbooks accounts with Databox.
Step 3: Watch your dashboard populate in seconds.
8. Which statistical analysis techniques do I want to apply?
Data quality isn’t the only important thing. You also need to gut-check your data analysis models. After all, it is easy to cherry-pick stats or data points to tell the story you want to tell. That story may or may not be what’s really going on.
In ensuring that business reporting delivers quality data to my business, there are strategies I have adopted in analyzing data,” says Maria McDowell of EasySearchPeople. “First is identifying the data source and size of the dataset that my business is working with. Secondly is ensuring the completeness and accuracy of the data. Lastly, determine the usefulness of the data to my business. These strategies have helped my company’s data analysis procedures which have, in turn, proved of great value in business reporting.”
Nick Drewe of Wethrift adds, “The best way to deliver meaningful data is to ensure you’re working from a strong foundation of accurate, relevant, and complete data, so it’s crucial that you start by asking: how can we guarantee we’re collecting high-quality data? There’s no single worse reporting mistake than working from inaccurate data – every other step you take is potentially useless if you aren’t 100% certain that you’re analyzing good quality data.
Unfortunate as it is, bad data means bad analytics and flawed insights, leaving your business reporting on incredibly shaky ground. Clean and organized data is truly the bedrock of reporting meaningful data, and much attention needs to be paid to controlling and profiling incoming data. We’re lucky in this day and age that there are a wealth of digital tools to help with this task, and that it needn’t be a tedious manual process.”
Related: How to Present Qualitative Data in a Business Report? A Step-By-Step Guide
9. Who are the final users of my analysis results?
The metrics you share and how you present the data in your data analysis report or dashboard will vary depending on if you are sharing with just the executive team, your manager, or the entire company.
“Data analysis is an iterative cycle – so we ask questions, explore the answers and then create further questions based on those outcomes,” explains Gary Warner of Joloda Hydraroll. “To understand the best questions to start with, we need to know what the relevant stakeholders want to know.
From there, we can create a report to deliver. Once they’ve had time to review this, we can discuss whether it covered everything that they wanted to know. If not, we need to ask further questions and adapt the reporting accordingly.
This is a forever-moving process, as data will be used to inform decisions, and the outcome of those decisions may highlight areas that your stakeholders need further detail on.
We regularly produce case studies, and these give us the opportunity to analyze data relating to particular projects. This helps us to understand our process from start to finish, and the data that can impact decisions at each stage.
Specifically, we have been able to help our clients in analyzing their own data to help them understand the difference that our solutions can make for their business.”
10. What is the goal of the analysis?
When you have the answer to the previous question and know who will benefit from your analysis, it is time to consider what you want your analysis to achieve. Is it going to be a report that you want to put into practice immediately so that you can change some of the strategies in place in order to achieve a better result? Or will you embed it for continual analytical use? As you know, embedding real-time reports and dashboards allows the end user to analyze the data held within the software application into which the analytics platform is embedded. In this case, it can be your business reports.
Related: 24 Types of Business Reports You Need in 2023
11. How should I visualize my data?
Data visualization is the process of turning data into a compelling visual story through the use of graphics, like charts and graphs.
It is one of the most effective ways to show trends and patterns from data analysis. Choosing the right visualization for your data is crucial. The right chart style will help you spot trends, or uncover new insights or opportunities you wouldn’t have seen otherwise. This is why it is important to take the time to choose a data visualization tool that works best for your personal needs.
Editor’s note: You can easily visualize your data with Databox, a great example would be our HubSpot Sales Manager KPIs Dashboard Template, which allows you to monitor your sales team’s output and outcomes, including average deal size, the number of deals won, new deals created, amount closed, and more.

12. How does this data compare to past performance?
Being able to compare your data to previous periods provides you with valuable insights into how it has progressed over time and if the changes you made along the way have had the desired impact. Having the ability to set your own date range by selecting the start and end dates, custom rolling ranges, more specific comparison periods, future Date Ranges, and fiscal calendars provides you with more options for comparison periods and helps add context and identify changes or trends in your performance.
Related: Predict Future Performance With Metric Forecasts
13. How often should I check my data?
Of course, you shouldn’t be staring at your screen watching data change in real-time. However, being truly results-oriented means striking a balance between watching the data and doing the work that will help your business grow. The more time you spend observing, the less time you spend doing. But keep in mind, that without the right data, you might not know what you are supposed to be doing. The right software can help you automate performance alerts so that you can make adjustments when they matter most.
Improve Data Analysis with Databox
Getting clear on the data you need, finding that information in your tech stack, and analyzing it is hard enough as it is.
We think presenting that data in a clear and compelling way should be the least time-consuming part. That’s where Databox comes in handy.
You can connect hundreds of sources to your dashboard in a matter of minutes. Plus, if you don’t want to start from scratch, we even have 500+ dashboard templates you can use to get started.
Ready to build your dashboard? Create your free trial Databox account here.


![How to Improve Agency Operational Efficiency [Insights from 40+ Agencies]](https://cdnwebsite.databox.com/wp-content/uploads/2023/09/14052320/agency-client-collaboration-1000x563.png)


