


Table of contents
Out of the box, Google Analytics is capable of capturing a lot of valuable information. Sometimes too much.
Your website is your public face to the world, and all different types of audiences, from prospects to customers to media to robots, will visit. Each arrives with varying levels of intent but may come from the same sources and view the same pages.
The challenge for marketers is all of this activity gets mixed together in Google Analytics reports. If you’re focused on lead generation, then activity from bots, customers, and employees can skew the data that would otherwise yield valuable insights about what’s working (and what’s not).

So, how can you trust your data in order to gain the clarity needed to make the right decisions?
Keith Moehring and his agency, L2 Digital, specialize in cleaning up Google Analytics accounts and creating the reports marketers need to guide strategic decision making. We talked to him about this challenge and how to correct the problem.
According to Moehring, “For Google Analytics to be useful, the data needs to be clean, accurate, and segmented to isolate relevant traffic. Views, system settings, and filters need to be configured to strip away data that conceals marketing-related website activity.”
Moehring says when he evaluates a new Google Analytics account, there are ten things he looks for right away.
- Irregular Traffic Spikes
- Sudden, Sustained Traffic Changes
- Irrelevant Global Traffic
- Lots of Bounces
- Next to No Bounces
- Traffic from Ashburn
- Free Traffic Referrals
- Previews, Logins, and Ghosts
- Too many UTMs
- Non-Referral Referrals
Is your Google Analytics data reliable?
One or more of these warning signs may be impacting your data. Learn more about L2 Digital’s approach to identifying and cleaning up your Google Analytics account
PRO TIP: How Are Users Engaging on My Site? Which Content Drives the Most Online Activity?
If you want to discover how visitors engage with your website, and which content drives the most engagement and conversions, there are several on-page events and metrics you can track from Google Analytics 4 that will get you started:
- Sessions by channel. Which channels are driving the most traffic to your website?
- Average session duration. How long do visitors spend on your website on average?
- Pageviews and pageviews by page. Which pages on your website are viewed the most?
- Total number of users. How many users engaged with your website?
- Engagement rate. Which percentage of your website visitors have interacted with a piece of content and spent a significant amount of time on the site?
- Sessions conversion rate. How many of your website visitors have completed the desired or expected action(s) and what percentage of them completed the goals you’ve set in Google Analytics 4?
And more…
Now you can benefit from the experience of our Google Analytics 4 experts, who have put together a plug-and-play Databox template showing the most important KPIs for monitoring visitor engagement on your website. It’s simple to implement and start using as a standalone dashboard or in marketing reports!

You can easily set it up in just a few clicks – no coding required.
To set up the dashboard, follow these 3 simple steps:
Step 1: Get the template
Step 2: Connect your Google Analytics account with Databox.
Step 3: Watch your dashboard populate in seconds.
Before You Begin
Before you get started cleaning up your data, Moehring recommends creating a new Google Analytics View dedicated to marketing.
“Once data is filtered out or cleaned up in Google Analytics, there is no bringing it back. It’s always a good idea to have one Google Analytics View with the raw data feed. It can serve as a valuable reference point to make sure any other filtered views aren’t missing anything important.”
1. Irregular Traffic Spikes
Erratic and sudden changes to traffic patterns can often be the first sign that analytic data is not reliable.
For most bot-blocking sites, traffic patterns follow a pretty predictable pattern week to week (holidays notwithstanding). And, if anomalies do occur, they are expected because you sent out an email or you’re getting some press coverage.
However, extreme session fluctuations caused by bots or spammy websites will create dramatic spikes randomly.
According to Moehring, “Sometimes these bots will drive the same amount of traffic over and over to the point where your session timeline starts to look like Batman in a police lineup.”
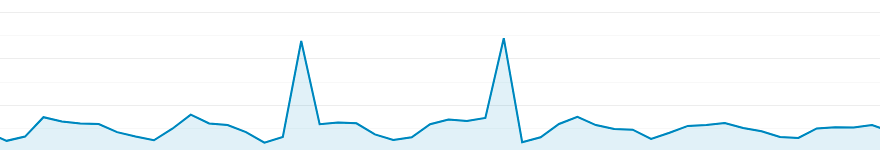
Junk traffic sources will falsely inflate user and session data and negatively affect engagement data, like bounce rate, session duration, and pages per visit.
One test to determine if the traffic is bot or spam related is to go to the Audience > Overview report in Google Analytics. Below the date ranges, there’s an option to view the traffic timeline in “Hourly” increments.
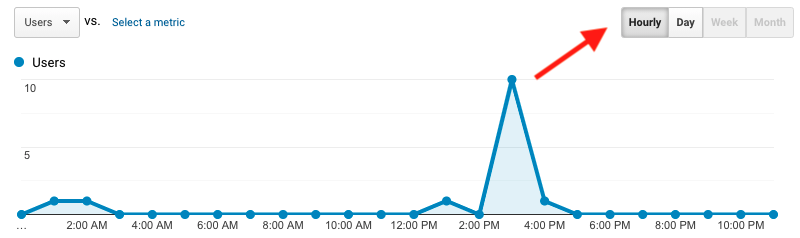
According to Moehring, “When spammy traffic occurs, it typically happens over a short period (less than 1 hour). Real traffic spikes may jump up quickly, but sustain the traffic for at least several hours after.”
How to Fix: It’s difficult to prevent all bot or spam traffic from showing up in your reports because it comes in many forms. Isolating the cause can help you put a filter in place to block it from happening in the future.
Narrow your report’s timeframe to isolate the day a spike occurred, and then compare it to a typical day the previous week or month. The comparison data will quickly highlight any anomalies. For example, if traffic from Random City, Ohio is the only geo-location up 1300%, then that’s likely the source of your problems.
A couple of useful reports to try to identify spammy sources include:
- Audience > Geo > Location. In some cases, spikes will all come from one city. See the “Traffic From Ashburn or Boardman” section below.
- Acquisition > All Traffic > Channels. See if you can identify a source, landing page, or keyword that looks spammy (e.g., freebottraffic4all.xyz). Sometimes the issue can show up as all three.
2. Sudden, Sustained Traffic Changes
A sudden, significant traffic drop or increase that is then sustained for an extended time usually has nothing to do with traffic coming to your site. More often than not, the culprit here is a change to the tracking code or your Google Analytics account.
Moehring says, “If your Analytics timeline looks like the edge of a plateau—relatively flat, sudden change, a new relatively flat—the first thing to check is that the tracking code hasn’t been stripped from a page and that no filters have been added to Google Analytics. In both cases, the change is immediate and won’t recover until corrected. This can leave huge gaps in your data, rendering it useless.”
How to Fix: The first thing to check is that the Google Analytics tracking script is still on every page. If you’re using Chrome or Firefox, download the Google Tag Assistant extension.
This extension shows what Google tracking scripts are firing on your site, as well as any issues that exist. Make sure to check every section of your site because a change to one template will only affect the pages using it.
“One time, a client’s developer uploaded a new blog template that didn’t include the Google Analytics tracking code. The site saw a sudden and sustained traffic drop of 70% for several days. We were able to identify the issue and get the tracking code back in place, but the data for those days was gone.”
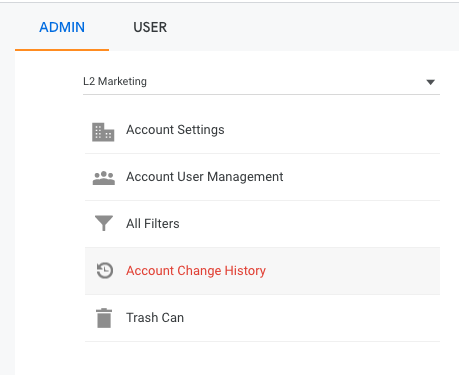
If the tracking code is in place, check that no filters were installed, inadvertently blocking a subset of data from Google Analytics. In the Google Analytics Admin section, there’s a link in the Account column called “Account Change History.” This can help you identify changes made on the day the sudden change occurred.
3. Irrelevant Global Traffic
If you’re an organization focused on global domination, then all the countries that show up in the Audience > Geo > Location report are relevant to you. However, if you’re like many businesses and you target a smaller geographic market than Earth, take a look at how much traffic is coming from places outside your primary locations.
If you’re a company focused on the United States only, traffic coming from Australia, India, and other parts of the world isn’t irrelevant to your marketing efforts. Each user from these other countries muddies up your data.
How to Fix: Create a filter that strips out traffic from every country except the ones in which you’re interested. If you’re a local business, you can do the same for region-specific traffic.
To set up a geo filter, use the following settings:
- Filter Type = Custom
- Select the Include radio button
- Filter Field* = Country (or region)
- Filter Pattern = United States
- Click Save
* Avoid using City as the filter field here. It is too restricting, and sometimes the location of IP associated with a user isn’t the same as the city they are connecting from.
According to Moehring, “Traffic sessions are going to fall (sometimes significantly), but the thing to remember is we’re trying to isolate the traffic that matters. The big numbers are nice to see but don’t help you get closer to your goals.”
If you are internationally focused, consider setting up different Views for different business segments or marketing teams. For example, if you have one team focused on North America, set up a Google Analytics view that filters out all traffic outside of North America.
4. Lots of Bounces
Bounce rate is often a misleading metric. It doesn’t account for those visitors who take the time to read your content thoroughly and interact with your page. This type of engagement can be a sign of qualified visitors that want a reason to take further action.
Most people understand a bounce to be when someone arrives to a site and then leaves without viewing any other pages. More accurately, a bounce is recorded when only one interaction takes place (e.g., page view).
By introducing new interaction tracking, you can get a much better sense of how many visitors arrive and find your content relevant enough to consume or interact.
How to Fix: The way to track interactions is with events. Events are dimensions and metrics you define that are recorded when someone takes a specific action. Some common events that can help improve bounce rate include:
- Scroll tracking
- Video views
- Form completions (if the visitor is not taken to a thank you page)
- Interactive page elements
The easiest way to add these events to your site is to use Google Tag Manager. According to Moehring, Tag Manager isn’t the most intuitive system to start using, but it can monitor and trigger events for scroll tracking, form submissions, video views, PDF downloads, exterior link clicks, and much more.
“Typically, once you install scroll tracking, a 70%+ bounce rate will plummet to below 40%. Also, time on page and session duration becomes more accurate because there are more timestamps to work with.”
Editor’s note: Using marketing reporting software like Databox, you can set up a custom dashboard that displays your website’s bounce rate, and track changes over time to identify areas for improvement.
5. Next to no Bounces
On the other end of the spectrum, if your bounce rate is very low, like less than 4 or 5%, then it’s likely you have a different problem.
Hardly, if ever, will real traffic bounce less than 4% of the time. If you see this, what’s likely happening is your Google Analytics tracking code is installed twice on your site. This can happen when you’re using a tag management system or your CMS offers multiple ways to integrate Google Analytics.
When this issue occurs, the duplicated Google Analytics tracking script eliminates the chance for a bounce. In Google Analytics’ eyes, the visitor viewed a page and then viewed the same page again a split second later. Two interactions occurred, and thus no bounce.
According to Moehring, “Bounce rate isn’t the only metric affected by this. Session data will be close to double what it actually is, and other engagement metrics like session duration and time on page will be skewed. Your data will be unusable.”
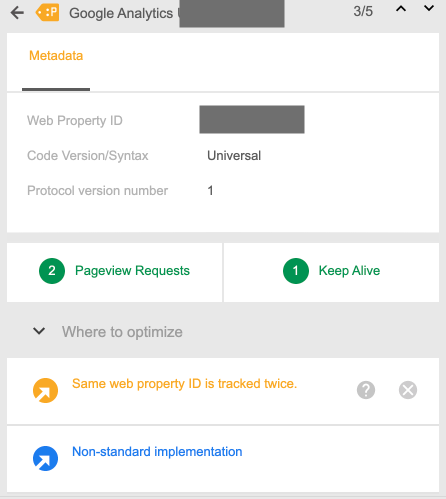
How to Fix: If you’ve installed Google Tag Assistant on your browser, navigate to your site and launch Tag Assistant. The Google Analytics tag should appear green (or blue if using Tag Manager). If it detects the same tracking script twice, the Google Analytics tag will appear yellow.

If you click into it, you’ll see a message that reads, “Same web property ID is tracked twice.”
To resolve this issue, figure out where the tracking codes are embedded on your site and remove one. According to Moehring, “The right one to remove will depend on how they are added. For example, if you’re using Google Tag Manager (GTM), keep that one and remove the other because GTM gives you the most flexibility with how and when the tracking code is used.”
When checking for duplicate tracking code, make sure to review each section of your website. Tracking code can be installed on the template level, only affecting the pages using that template.
6. Traffic from Ashburn
Bot filters don’t catch all bot traffic. If unimpeded, bot traffic will royally screw with user and session data, not to mention engagement metrics like bounce rate, pages per session, and conversion rates.
While it’s hard to know precisely where bot traffic will originate, two cities are often guilty—Ashburn, Va. and Boardman, Ore. If you go to the Audience > Geo > Location report in Google Analytics, drill into the United States and then switch to City view, to see where the top location’s traffic comes from.
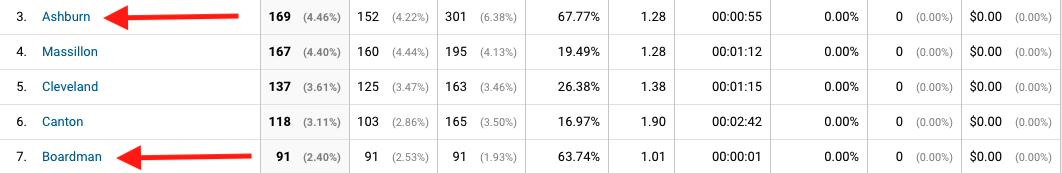
“Ashburn, Va. is widely known as the data center capital of the world (a.k.a. homebase for a lot of bots). I’ve seen situations where 60% of site traffic was coming from Ashburn, and site managers had been using it for years to make marketing decisions. It’s a good way to go down the wrong path unknowingly,” says Moehring.
How to Fix: The best defense against this bot traffic is to implement the following filter in your marketing Google Analytics View.
- Filter Type = Custom
- Select the Exclude radio button
- Filter Field = City
- Filter Pattern = Ashburn
- Click Save
Also, set up a similar filter for Boardman.
7. Free Traffic Referrals
If you’ve been monitoring site traffic for any period, you’ve likely seen a spike or two come in from a site with the URL, freebottraffic.xyz, bot-traffic.icu or some other free traffic wording. This is known as ghost spam.
Ghost spam isn’t actually traffic to your site. What’s happening is spammers are randomly generating Google Analytics UA IDs, dropping them into the standard tracking code, and then blasting them with false data.
This wildly annoying practice tends to show up in Google Analytics as organic and referral traffic. You’ll notice these ghost spam sites often include their website address as the source, keyword, and/or landing page.
Huge spikes of spam traffic not only throw session data out of whack but because they don’t trigger any other interactions, bounce rate, session duration, pages per visit, and other engagement metrics are all skewed toward the negative.
How to Fix: It is impossible to predict what URL this type of traffic will be coming from. At the same time, these pests tend to use a lot of the same words, such as “bot,” “traffic,” “free,” etc.
To proactively defend your site against these attacks, consider adding a couple of source and page view filters that center on the commonly used terms.
Source
- Filter Type = Custom
- Select the Exclude radio button
- Filter Field = Campaign Source
- Filter Pattern* = \/bot|traffic|4u|\.xyz|\.icu
- Click Save
Page View
- Filter Type = Custom
- Select the Exclude radio button
- Filter Field = Request URI
- Filter Pattern* = \/bot|traffic|4u|\.xyz|\.icu
- Click Save
*Please note, the filter pattern above is written in regex to protect against multiple ghost spam sites in one filter. If you’re not comfortable with regex, you may want to create separate filters for each term.
Word of Caution: Moehring stresses that you need to be careful when setting up these types of filters. “Make sure you do not set up filters to block traffic from relevant sources or to real pages on your site. For example, if you regularly post content about robots, a page view filter that removes traffic to URIs that contain “bot” will exclude a lot of your website traffic. Be careful to avoid these issues. Once data is filtered, it is gone and can’t be added back in retroactively.”
8. Previews, Logins, and Ghosts
Pageview data can give you a sense of why visitors are coming to your site and where to feature offers to maximize conversions. The Behavior > Site Content > All Pages report in Google Analytics can also flag irrelevant site activity.
Moehring says a great example of this happens a lot with software-as-a-service sites. “In the upper right-hand corner, these sites often include a ‘Login’ link. Anyone clicking on that link and visiting the login page is likely already a user. As a result, their activity on the site is irrelevant to your lead generation efforts.”

Be on the lookout for pageviews that include any of the following:
- “Preview”: This is often included in a URL or appended to it when viewing the draft version of a page before publishing.
- Ghost Site URLs: One calling card of ghost spammers is to add their site URL as the page viewed (e.g., www.databox.com/bottraffic4u.xyz). In a normal situation, this type of URL would trigger your 404 page, but they aren’t actually visiting your site (see number 7 for details).
- “Login” or any sign-in page URI: Visitors to this page are most likely current users and can safely be removed from your Google Analytics marketing View.
Another issue to look for here is dramatic increases in pageviews relative to the rest of your site’s content. In some cases, the dramatic increases may originate from legitimate sources (e.g., email), but if you can’t quickly identify a source that spiked traffic to a page, there’s probably something else going on.
How to Fix: Fixing these issues depends on what’s causing them.
- Internal Traffic: Set up a filter to block traffic from employee IP addresses. Click here for instructions on how to set up this type of filter.
- Ghost Spam: See the section “Bottraffic4u.xyz” for recommendations.
- Login Page Filters: Set up a filter to exclude any session that includes a visit to your login page. See below for filter details:
- Filter Type = Custom
- Select the Exclude radio button
- Filter Field = Request URI
- Filter Pattern = {{LOGIN PAGE URI}}
- Click Save
9. Too Many UTMs
Google Analytics treats every unique URL as an individual page. Unfortunately, if your marketing campaigns use UTM parameters for attribution (e.g., ?utm_source=email campaign), the collective page views one page receives may be split among dozens of unique URLs.
In other words, you’re potentially underreporting marketing’s impact on generating pageviews and goal conversions.
According to Moehring, this mistake isn’t doing marketers any favors. “I’ve seen situations where client reports only showed 40% of the overall traffic we generated. The rest was split up among URLs with unique UTM parameters intended to associate an individual to an email click.”
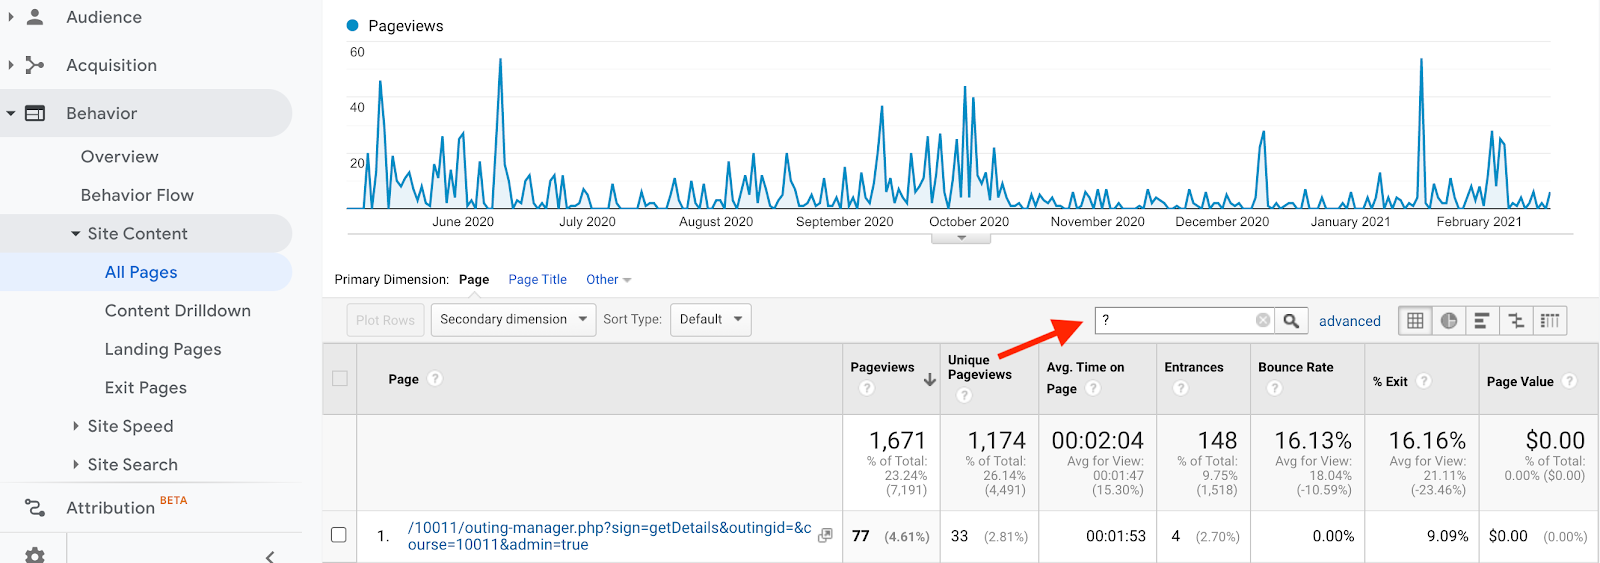
As an experiment, go to the Behavior > Site Content > All Pages report in Google Analytics. In the search bar, type in a question mark (?) and hit enter. The number of pageviews is how many are not associated with a main version of the page. If you scroll down, the total page count is how many duplicated pages were recorded.
How to Fix: Google Analytics offers a built -fix for this issue (note there is a different fix for site search parameters – see below).
- Click the Admin sprocket in the lower-left corner.
- On the next screen, in the View column, click “View Settings” for the View you want to clean up.
- In the “Exclude URL Query Parameters” field, enter the UTM parameters that are junking up your reports.
- If you go back to the experiment we ran above, scan through the URLs for the UTM parameters showing up most commonly. A frequent example of a UTM parameter for anyone doing Facebook advertising is “fbclid.”
Moehring says, “Any UTM parameter added to the Exclude URL Query Parameters field will be stripped off the URL, which in turn associates any pageview data with the main page URL. This makes page view data far more accurate and gives you the credit you deserve.”
Word of Caution: Google Analytics will strip out query parameters before it has a chance to attribute the traffic to a source. If you’re using UTM parameters to properly attribute source data in Google Analytics reports, don’t add them to the Exclude URL Query Parameters field.
Site Search

If your site or blog offers search functionality, a source of query parameters may be your site search. A UTM parameter with the visitor’s search query is often attached to the page URL after a search is conducted.
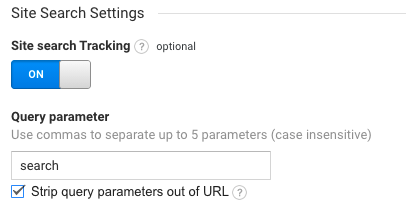
In your View Settings screen, there is a field near the bottom called “Site Search Tracking.” Toggle that on and then enter in the site search query parameter (e.g., “s” or “search”) into the field.
Directly below that field is a check box that enables you to strip out the query parameters. Make sure to check it.
Moehring says, “This feature also offers the added benefit of showing you what information visitors are looking for. If you see common queries, write content to speak to it or more prominently feature the content you already have.”
10. Non-Referral Referrals
Referral traffic from another site is fun to see, but not all referrals are created equal. In fact, some aren’t even referrals at all.
If you navigate to the Acquisition > All Traffic > Referrals report in Google Analytics, the list of referral sites may include several non-marketing-related sources. Below are some of the more common, irrelevant referrals and how to fix each.
Ghost Spam
As mentioned earlier, ghost spam traffic will often take the form of a referral, and the spammy website URL will appear as one of your traffic sources. To fix this, you’ll need to set up a filter that attempts to catch as many of these sources as possible.
Self-Referral Traffic
If you see your website or one of your subdomains as a referral source, you likely don’t have cross-domain tracking set up, or it’s not set up correctly.
In this situation, the cookie Google Analytics uses to track session activity is not passed between pages. In other words, Google Analytics doesn’t recognize a visitor as being on the site, so it creates a new session. This inflates session data and can significantly confuse your engagement metrics.
How to Fix: There are several steps to fixing this issue, including configuring your tracking script to allow for cross-domain tracking and updating your referral exclusion list. Check out our blog post, “How to Set Up & Use Google Analytics Across Multiple Websites” for more details.
Marketing Automation or CRM
If you’re using a marketing automation tool or a customer relationship management (CRM) platform, any clicks from the platform to your website results in the platform’s URL showing up as a referral source. For example, if you’re using HubSpot, you’ll often see app.hubspot.com as a referral source. Or, if you’re using Salesforce, you may see a variety of .force.com referral sources.
If you see these referral sources, then it’s most likely internal traffic and needs to be removed from your traffic reports.
How to Fix: The first step to fixing this issue is to set up a filter to block internal IP addresses. This includes your main office and the homes of any employees remotely working who may frequent the site.
To find your IP address, Google “What is my IP address?” The results will be a number like “50.4.59.183” or “2603:6010:9c33:a500:c437:cb9e:49f3:3856.”
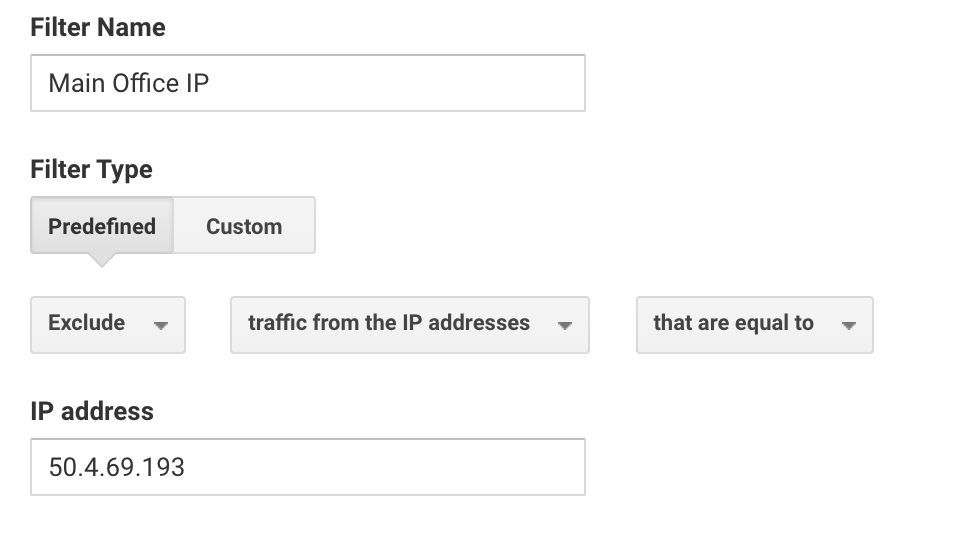
Next, we need to set up a filter to block traffic from these IPs.
- Filter Type = Predefined
- Select “Exclude” in the first dropdown.
- Select “traffic from the IP addresses” in the second dropdown.
- Select “that are equal to” in the third dropdown.
- Enter your IP address into the “IP address” field.
- Click Save.
Sources That Include “mail”
Out of the box, Google Analytics doesn’t always attribute email traffic properly. For example, if you do any email marketing, you may see “mail.google.com” as a referral source. As you can guess, this is a misattributed email traffic that came from Gmail.
Without email traffic properly attributed, evaluating the real performance of your email campaigns becomes difficult.
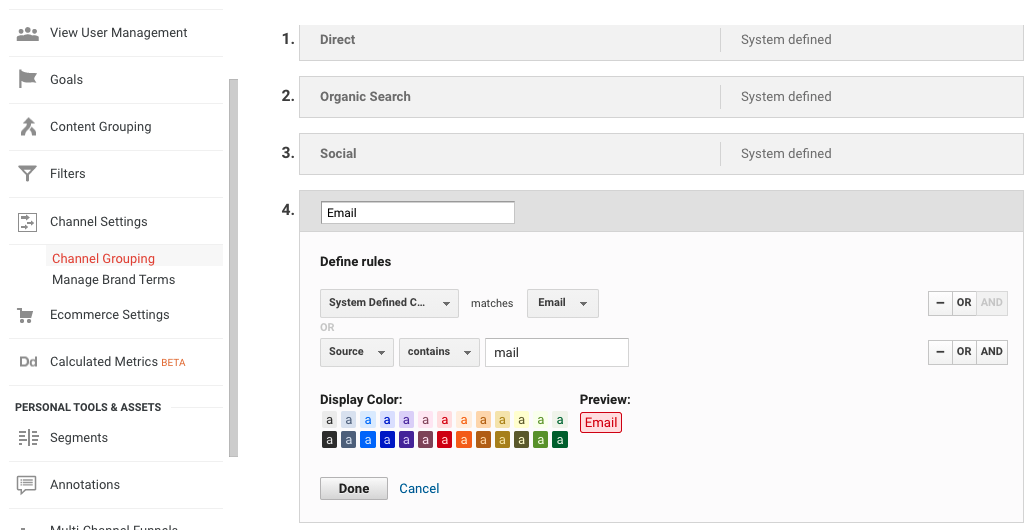
How to Fix: This can be updated in the admin section of Google Analytics.
- Click the Admin sprocket in the lower-left corner of Google Analytics.
- In the View column, click the Channel Settings link.
- Select Channel Grouping from the drop-down.
- Click Default Channel Groups.
- Click the edit pencil next to Email.
- Click the “Or” option on the right-hand side.
- In the first dropdown field, select “Source.”
- In the second dropdown field, select “Contains.”
- In the final field, type “mail”.
Make sure to hit “Done,” and then “Save” at the bottom. The “Save” button can be easy to miss because you often need to scroll down to see it.
It’s Not Too Late to Fix the Problem
For years, Moehring has worked with organizations to clean up Google Analytics and he says he has yet to partner with a client who isn’t experiencing at least one of these issues.
“The good news is it’s never too late to put fixes in place. Configuring Google Analytics to filter out the noise is simple and straightforward once you figure out what’s cluttering up your reports. From there it’s all about recalibrating benchmarks and working off your new normal.”
Use this cleaned up Google Analytics data to:
- Identify qualified website sources.
- Understand visitor interests and intent.
- Flag top trafficked pages to focus conversion rate optimization efforts on.
- Monitor what type of content visitors engage with most.
- See what offers and pages visitors tend to convert on.
- Map out where to place calls to action on a page to maximize visibility.
- Evaluate marketing campaign effectiveness.
- A/B test different variations of a page.
Clean, accurate data that isolates your target audiences can be a powerful asset in the ongoing effort to improve traffic, lead generation, and sales performance.


![How to Leverage Your Website Analytics to Acquire New Customers? [Research Findings Based on 100+ Companies]](https://cdnwebsite.databox.com/wp-content/uploads/2022/10/10044001/google-analytics-4-metrics-and-dimensions-guide-1000x563.png)


