Product Updates
 by
|
Sep 10, 2025
by
|
Sep 10, 2025
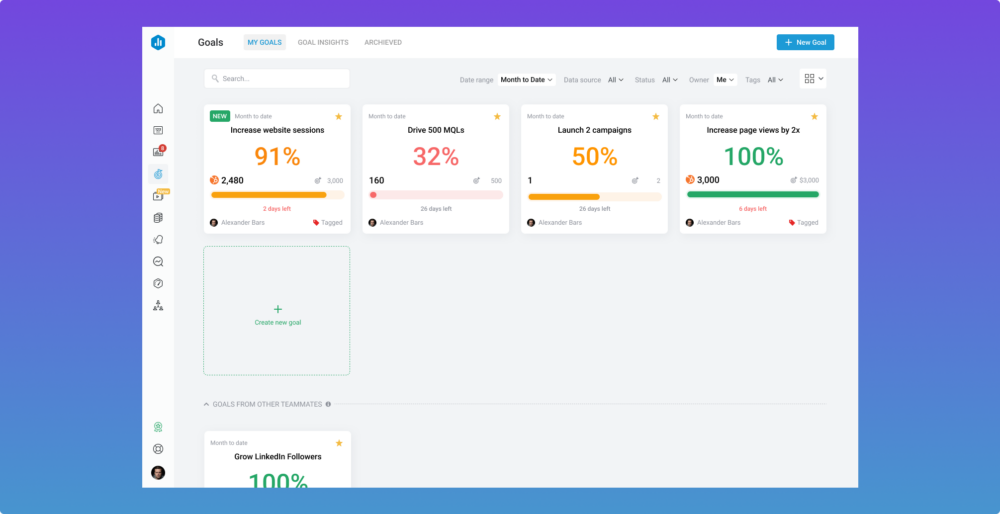
New in Databox: Track Success Your Way With More Flexible Goals
With our new and improved Goals feature, you can set, track, and manage any goal in your company
by
|
Sep 10, 2025


