


Table of contents
Businesses are often faced with problems, no matter the stage of development they’re in. They can usually rely on in-house expertise, but sometimes, their problems or plans require specialized training they just don’t have.
Enter consultants. Businesses hire these professionals to solve problems they can’t. Consultants provide expertise and advice to their clients, helping them solve their problems and clearing a path to growth and development.
One essential tool in a consultant’s toolbox is a business consulting report. These business reports provide a detailed examination of an organization’s problems and are crucial if the management is serious about solving them.
A comprehensive report is the best way for a consultant to show their skills and expertise. So if you want to be better at writing consulting reports, you’re at the right place.
We’ll examine what they are, why they’re important, and how to create an effective business consulting report.
- What Is a Business Consulting Report?
- Why Create a Consulting Report?
- What Should Be Included in a Consulting Report?
- How Long Should a Consultancy Report Be?
- How to Write a Consultancy Report
- How to Present a Consulting Report
- Consultant Report Examples and Templates
- How to Create Better Business Consulting Reports with Databox

As you move from outlining the report to assembling findings, the hardest part is often translating raw metrics into clear explanations a client can trust. Teams now use AI data analysts, like Databox MCP, to ask plain-English questions about performance and get answers based on their real metrics, definitions, and historical context. This makes it easier to explain what changed, why it changed, and which levers likely influenced the outcome—so your recommendations are grounded in the same numbers your client uses to measure success.
What Is a Business Consulting Report?
It’s really not complicated. A consulting report is a document (more commonly a set of documents) you send to your clients to report on your progress on the project you’re consulting on.
The exact type and format of the report depend on the project and the information your clients need or want to see. While you can send your report as a simple email (or a Word document accompanied by Excel spreadsheets or a PowerPoint presentation), the best option is to make use of interactive and customizable dashboards.
Businesses use consulting reports to keep track of the projects they hired consultants for and to monitor consultant performance. They’re valuable and reliable sources of information that inform policy and lead to better decision-making in the future.
Related: How to Write a Great Business Development Report: A Step By Step Guide with Examples
Why Create a Consulting Report?
Managing a business is a challenging task, and most business owners and managers have to deal with a lot of different tasks. Unfortunately, few of them (if any) truly have the broad set of skills required to solve every single problem in their business.
That’s why they turn to consultants and consulting agencies who can provide expertise and help solve their issues. These services are necessary for growth since no single business has an in-house solution for everything.
This brings us to consulting reports. They are useful to clients because they give them insight into the progress a consultant is making on a consulting project. They’re useful to consultants because they allow them to keep track of how their projects are going. In addition, since business consulting reports lay out the project in detail, they can help consultants improve their future performance and ensure better planning for the future.
Related: How to Write a Strategy Report? A Step-By-Step Guide for Marketers
So without further ado, let’s dive straight into the steps involved in creating a consulting report!
What Should Be Included in A Consulting Report?
Consulting reports vary depending on a variety of factors, including the specifics of the task, the field they’re consulting in, and the company they’re consulting for. However, following a consistent general outline is necessary if you want to ensure you give the clients a well-organized and comprehensive report.
Here are some components that should find their way into the majority of consultant reports:
- Title Page – The title page introduces what the report is about. Here, you can include the title, introduction, and the client’s name.
- Table of Contents – Follow up the title page with a table of contents. Simply list the sections of your report and note their corresponding page numbers. Additionally, can include subheadings or subtopics, allowing the readers to skim the table of content and go to the section that interests them.
- Executive Summary – This section (shockingly) summarizes the whole thing in as few pages as possible. You’ll give your readers a rough idea of what to expect and emphasize what the report is about. The summary provides a concise explanation of all the important information in the report and highlights analysis, problems, solutions, recommendations, and conclusions. You can create a repeatable executive summary template to help you spread up the process.
- Introduction – The next step is writing an introduction. This is your chance to leave a good first impression, so make sure to match the tone to the expected audience. In addition to setting the tone, this section addresses the main issues and problems that require your expertise. Provide brief details about the problems and mention the approaches and methods you’ll use to analyze and solve them.
- Background – It’s often useful to include background information. Results of the previous report, expectations, brief outline of previous efforts (if any) on the project or similar projects, market forces at play, etc. This section overlaps somewhat with the Introduction, and you may want to combine the two in order to make the report more concise or if there isn’t much to say in one of them.
- Client Profile – As it says on the tin, cover information about your client in this section. This includes the basics like business address, industry, specializations, size, past and current efforts, and other relevant information.
- Objectives – This section should outline and define the short-term and long-term goals of the report.
- Observations (Analysis) – This will probably be the biggest part of your consulting report. As a part of your job as a consultant, you have to gather information by observing and collecting data about the client’s field and performance. You need information about individual employees, the management model, and even the entire decisionmaking process.
- Appendix (Optional) – This is an optional section but it can be very useful both for you and your client. Here, you can provide citations, references, attachments (photographs, additional documents, etc.), or other information that supports your report and backs up your conclusions.
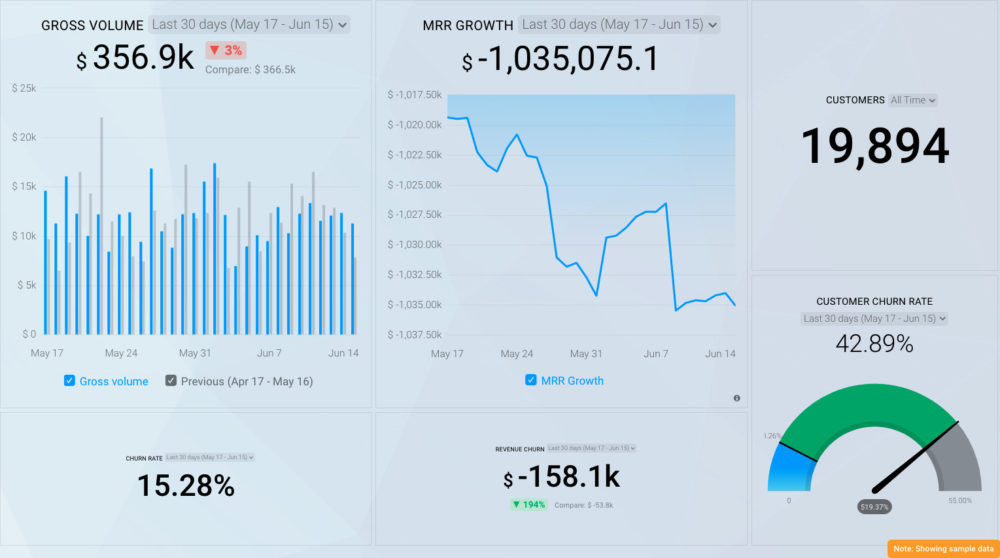
PRO TIP: How to Track the Right Metrics for Your SaaS Company
It’s not easy to know which KPIs to track for sales, marketing, and customer success in a SaaS company. There are many possibilities, and so much to do! Why not start with the basic metrics that determine the health of your company?
- Sales (Gross) Volume: How much revenue did your sales team bring in this month, this quarter, or this year?
- MRR Growth: How fast are you growing revenues from recurring subscriptions?
- Customers: How many customers do you have right now?
- Customer Churn Rate: What’s your customer churn rate, and how much revenue have you lost to churn?
If you want to track these in Stripe, you can do it easily by building a plug-and-play dashboard that takes your Stripe customer data and automatically visualizes the right metrics to allow you to monitor your SaaS revenue performance at a glance.
You can easily set it up in just a few clicks – no coding required.
To set up this Stripe dashboard, follow these 3 simple steps:
Step 1: Get the template
Step 2: Connect your Stripe account with Databox.
Step 3: Watch your dashboard populate in seconds.
How Long Should a Consultancy Report Be?
Based on our research, there’s no set length for consultancy reports. It greatly depends on project scope and complexity, company size, format, and countless other factors.
Projects can last anywhere from one to six months, and the reports themselves can be of any length. Each section takes up at least one page, and many take up much more. An executive summary shouldn’t exceed two pages, even for long reports, while the observations section for a complex project with a lot of variables can reach 50 pages by itself.
How to Write a Consultancy Report? Best Practices
Your report should flow logically, provide accurate information and give clear and coherent answers to the client’s questions.
- Start from the Background Section
- Highlight the Key Facts
- Work on the Observations Section
- Work on the Executive Summary
- Your Report Should Solve Problems
- Write It in a Logical Flow and Keep Your Audience in Mind
- Be Succinct and Write in Plain English
- Use a Neutral and Unbiased Tone
Start from the Background or Introduction Section
This is the easiest way to start a report because it gives you an overview of the problem you’ve been hired to solve and previous efforts to deal with it. You can always go back to it to check if you’ve addressed the issues mentioned in other sections.
Highlight the Key Facts
Most readers will skim through the report (or even just specific sections) before diving in properly. They’re busy people, and it’s your job to ensure the important information is clearly visible.
Using data visualizations like charts and graphs to highlight the main data points can make the whole thing more readable and help the readers absorb the information better.
Work on the Observations Section
As this will be the most important part of your report, it requires special attention. It should include solutions to the client’s problems and explain the logic behind your research and reasoning.
A good way to structure this section is to use the MECE technique (Mutually Exclusive, Collectively Exhaustive). This method ensures that any given dataset is mutually exclusive (i.e., no dataset overlaps with one another) and collectively exhaustive (i.e., it doesn’t have any information gaps or missing data points).
Work on the Executive Summary
Writing the executive summary last makes it easier since you can just pick out the most important observations and recommendations and write this section around that. It’s a good idea to bring up the most important pieces of information first and then elaborate on and support them through secondary information.
Your Report Should Solve Problems
Your client has a problem they need solved. This is the basic purpose of the report and your engagement with the client. So, ensure your report provides a solution the client needs. In order to do that, you need to determine the goals of the project before taking any other steps. Use these goals as signposts to ensure your business reports don’t veer off-topic.
Related: Goals Based Reporting: Everything You Need to Know
Write It in a Logical Flow and Keep Your Audience in Mind
Your clients probably aren’t experts in your field. If they were, they wouldn’t be asking for your help. That’s why you should strive to deliver the information and recommendations in a sequence that makes sense to them. You can use the outline we provided above to ensure your client can fully understand the content of your report.
Related: Reporting Strategy for Multiple Audiences: 6 Tips for Getting Started
Be Succinct and Write in Plain English
This is a long way to say to avoid using weasel words. On a more serious note, try to build good habits when it comes to writing reports. Being evasive and overly bureaucratic will simply not serve you here. Use short sentences and write brief paragraphs. Simple language beats waxing lyrical every time.
Use tools like the Editpad Text Summarizer to condense lengthy sections into clear, concise summaries. This helps maintain readability and ensures your key points stand out.
Use a Neutral and Unbiased Tone
Avoiding emotionally charged language is important. It gives your report an air of impartiality and professionalism. Even when you have to give your client some news they won’t like hearing, you can avoid backlash by being analytical and unbiased.
How to Present a Consulting Report
It’s very likely you won’t just hand in (or email) a report to a client. You’ll also be expected to give a short presentation and go over the main findings.
Here’s how you can prepare for it:
State the Context First
As a rule, clients want to understand their current business position and figure out how to get to their desired state. It’s your job to connect these two states for them. You should clearly articulate the problem and explain to the client why they’re in the current state, why they need to act, and what they must do. Don’t forget to back up your claims with data.
When it comes to selecting data, pick something that the client can change, something that’s important to the business, and something that the company is already working on improving.
Demonstrate What Can Be Done
The goal of your report is to make the client trust your expertise and judgment and follow up on your recommendations. After all, your recommendations will help them grow their business.
The best way you can do that is by presenting alternative scenarios with likely outcomes, i.e., what happens if they implement a suggested change and if they don’t. You can use graphs to present the differences and show the audience what you’d do in their place.
Elaborate on Your Strategy
A client may initially be resistant to your plans or suggestions, which is why you need to do more than just show them the solution. You also need to explain your reasoning and try to dispel any doubts. Find out what exactly is bothering them, and address the issues.
Explain, in detail, why your recommendations are warranted and prepare several slides in your consulting report to explain your framework, methodology, and tools.
Close the presentation by showing a slide that shows the outcomes the client can achieve by choosing to follow your recommendations.
Related: What Is Strategic Reporting? 4 Report Examples to Get Inspiration From
Consultant Report Examples and Templates
Reporting software and templates make reporting much easier. While there’s no one-size-fits-all template, there are quite a few elements they all have in common.
In order to help you build great business consulting reports, Databox has built over 300 dashboard templates you can download, use, and modify to suit your preferences. They come pre-built with the most common metrics and KPIs and support simple integration with numerous data sources.
All you have to do is choose a template, connect the data sources, and the dashboard will populate with visualizations automatically.
Here are some examples and templates you may need:
- Customer Support Report Templates
- Financial Report Example
- Sales Report Example
- Marketing report example
Customer Support Report Templates
Customer support dashboards allow you to track customer success from tools like HubSpot, HelpScout, and more. You’ll be able to measure the impact of a variety of metrics concerning Help Desk, Support Tickets, Help Documentation, and Customer Success.
If you want to focus on customer success, you can track the most common relevant KPIs and metrics with customer success dashboard templates. The breadth of supported integrations and customizability ensure you’ll be able to build any kind of report you want.

Financial Report Example
If you’re using QuickBooks and HubSpot CRM to track cash flow information, bank accounts, sales, customer interactions, conversions, and other relevant metrics, this financial performance report is just what you need to make your reporting easier. With it, you’ll be able to learn how to track open invoices in QuickBooks, if your client is on track with revenue goals, how to track expenses, and more.

Other financial report templates offer different integrations allowing you to customize them as you see fit. You can focus on Profit and Loss, Revenue, Expenses, Cash Flow, or anything relevant for your business consulting report.
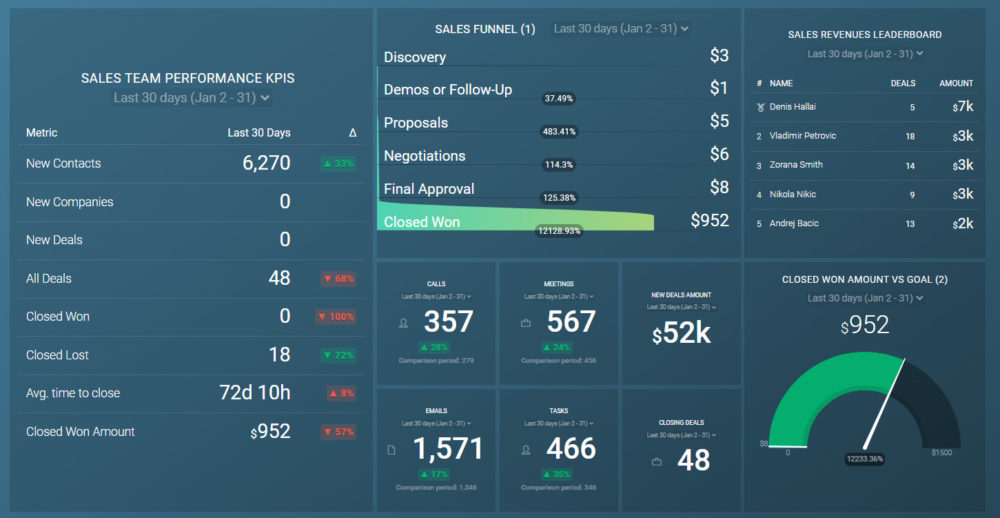
Sales Report Example
Sales reports allow you to track sales performance using a variety of data sources like Salesforce, HubSpot CRM, Pipedrive, and many others.
If you need a visual snapshot of your client’s sales team performance, this Sales Overview Dashboard will provide you with information about sales performance KPIs, productivity KPIs, and other important metrics. You’ll be able to better understand your client’s current sales pipeline and compare team results with revenue goals.
Marketing Report Example
You can use marketing reports to get information about important metrics related to your client’s marketing efforts and present them in a clear and visually-pleasing manner. They cover everything from social media and Google Ads to SEO. No matter what you’re looking for, you can find the right template.
For example, this HubSpot Marketing Monthly Reporting dashboard shows all key performance indicators you and your clients need to know from HubSpot Marketing. It covers key metrics like website visits by source, conversions, email and blogging performance, etc. This allows you to answer important questions about the client’s website traffic, landing page performance, and visitors’ progress through the inbound methodology.

Create Better Business Consulting Reports with Databox
Consulting work is important. Every business, no matter its size, is likely to need a consultant at some point. It’s also rewarding work — your recommendations and analyses can help businesses overcome obstacles and establish a strong presence on the market.
It’s not all sun and roses, however. The job can also be complicated and hectic. Consultants need to have strong analytical skills as well as work as public speakers when it comes to conveying information to clients and persuading them to take your advice.
Your consulting reports are an invaluable tool that you can use to achieve your goals, but gathering all the necessary data points, and compiling everything into a coherent report can be a complicated and time-consuming process.
Fortunately, you can use business and financial reporting tools like Databox to make report-making both simpler and faster. Dashboards are invaluable additions to any report, and they can even make the process of analyzing data easier and more intuitive.
Databox can help you save time by automatically populating visualizations based on the criteria and data sources you enter, making it easier than ever to build a consulting report for your clients. This makes the report more visually appealing, more engaging, and helps prevent errors, benefiting both you and your clients.
Sounds interesting? All you have to do is sign up here for a free trial, and we’ll help you streamline business consulting reporting right as soon as today.


