


Table of contents
You’ve created dozens of reports so far.
However, it may still be challenging to present the data in the right way. How do you make the positive outcome of your activities obvious even to those who know little about the marketing industry?
Especially when they’re interested in ROI and revenue more than in any other metric.
Well, you’re not alone. Many marketers struggle to create reports that will clearly prove their value and present the data in the best light possible. And it’s difficult to stay on top of this task when agency life can be so hectic and when working under pressure is your reality.
In 2019, a survey showed that 59% of agencies spend one hour per client on reporting. If your agency has ten or more clients, that means you spend more than a week per month on reporting only. But is it efficient? Can your clients see the worth of your efforts?
Follow our guide if you want to up your game and create streamlined and effective agency reports for your clients.
- What Is an Agency Report?
- Why Is Agency Reporting so Important?
- What Should You Include in an Agency Report?
- 9 Agency Reporting Tips and Best Practices
- Best Agency Reporting Tools

What Is an Agency Report?
An agency report refers to a detailed overview of the data obtained using different monitoring and reporting tools over a specific period of time.
This data is used for analysis so the team in charge of the tracked metrics can gather valuable insights and conclusions based on this analysis. Then, they can create an actionable plan to resolve potential issues in performance or take advantage of the opportunities that may come up.
More importantly, an agency report is the evidence of how well your strategy is working that you need to show to your clients or investors. Without reporting, you can’t prove the value of your work or justify your budget. A report contains all relevant numbers that prove you can deliver excellent results and help the client achieve their business goals.
Why Is Agency Reporting So Important?
Agency reporting is essential both for you and your client, for several reasons. An agency report gives you an overall picture of what you’ve achieved over the past week or month (or year, if it’s an annual report). It helps you evaluate your own strategies and efforts and learn from them so you can enhance them even more in the future. It also helps you sell your own services – concrete results speak more than words, so you can use them to showcase your expertise and attract new clients.
On the other hand, you keep your client in the loop of what you’re doing for them. This way, you take your communication to the next level, which improves client trust. Remember, transparent communication is one of the most important aspects of a healthy agency-client relationship.
See how much you can gain from effective reporting? Many agencies actually treat reporting as something tedious while missing the point and the benefits of creating regular reports on their activities. However, it’s critical to understand that reporting is a vital part of your whole relationship with a client and it’s essential to do it properly if you’re looking to nurture long-term collaborations for your agency.
What Should You Include in an Agency Report?
First things first: you’re reporting to a person outside of the marketing industry who’s interested in the most important KPIs only.
They don’t want to waste their time and sit through an entire meeting where they’ll listen to all the details of your strategy – a client wants only the most relevant data that concerns them directly.
This is where knowing the difference between internal and external reporting comes in handy: keep the details for your team and only include the critical metrics in your client report.
So, what should your agency dashboard contain?
Goals
Before you even start with your activities, it’s essential to set goals together with your client. What are you looking to achieve? These goals will be your North Star in the following period while you’re executing your strategy. It’s important to state your goals as a reminder at the beginning of your report.
Related: Goals Based Reporting: Everything You Need to Know
Key Metrics
Skip the metrics that may matter to your team internally, and only report on those that matter to your client. How much has their website traffic increased? How many new leads are their landing pages generating? What’s their conversion rate or their ROI? If you’re not sure what metrics to include, trace them back to the goals – if they’re aligned, they can be in the report.
PRO TIP: How Well Are Your Marketing KPIs Performing?
Like most marketers and marketing managers, you want to know how your efforts are translating into results each month. How is your website performing? How well are you converting traffic into leads and customers? Which marketing channels are performing best? How does organic search compare to paid campaigns and to previous months? You might have to scramble to put all of this together in a single report, but now you can have it all at your fingertips in a single Databox dashboard.
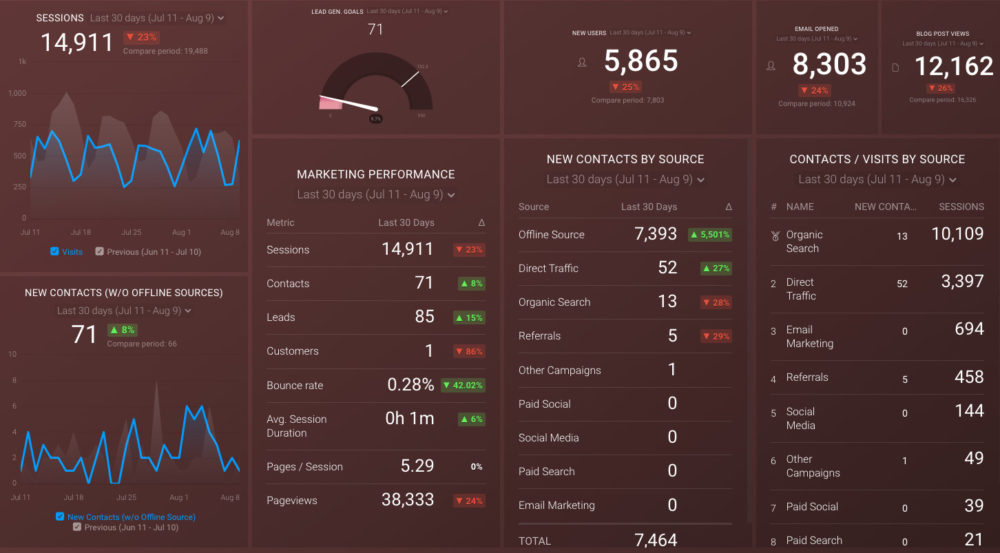
Our Monthly Marketing Performance Dashboard includes data from Google Analytics 4 and HubSpot Marketing with key performance metrics like:
- Website sessions, new users, and new leads. Basic engagement data from your website. How much traffic? How many new visitors? How many lead conversions?
- Lead generation vs goal. Did you reach your goal for lead conversion for the month, quarter, or year? If not, by how much did you miss?
- Overall marketing performance. A summary list of the main KPIs for your website: sessions, contacts, leads, customers, bounce rate, avg. session duration, pages/session, and pageviews.
- Email response. Overall, how effective were your email campaigns, measured by email opens?
- Blog post traffic. How much traffic did your blog attract during a certain period?
- New contacts by source. Which sources drove the highest number of new contacts
- Visits and contacts by source. How did your sources compare by both sessions and new contacts in a certain period of time?
Now you can benefit from the experience of our Google Analytics and HubSpot Marketing experts, who have put together a plug-and-play Databox template that contains all the essential metrics for monitoring and analyzing your website traffic and its sources, lead generation, and more. It’s simple to implement and start using as a standalone dashboard or in marketing reports!
You can easily set it up in just a few clicks – no coding required.
To set up the dashboard, follow these 3 simple steps:
Step 1: Get the template
Step 2: Connect your HubSpot and Google Analytics 4 accounts with Databox.
Step 3: Watch your dashboard populate in seconds.
Value
Don’t be afraid to “brag” about the value you’ve provided for the client. Highlight it and put it at the top of the report. Explain what activities led to that outcome and how you’re planning to keep up the good work in the future. If you can generate a list of qualified leads or conversions, even better. That will make abstract results more real.
Related: Calculating Marketing ROI: 7 Popular Formulas + Reporting Tips
Non-Monetary Metrics
Has your client’s business received many positive reviews on social media or Google Business? Since people almost never buy without consulting the web first, make sure your client understands how valuable these reviews can be.
Examples of Metrics Your Agency Report Should Include
Different people on your team will be tracking different metrics. When reporting to a client, you can easily extract the most important ones and create a single KPI dashboard that will include the most relevant key performance indicators the client may be interested in.
Here are a few examples of the metrics you may want to include in your agency report.
- ROI
- Cost per lead
- Customer acquisition cost
- Customer lifetime value
- Backlinks
- Keywords by ranking
- Social traffic and conversions
- Social interactions
- Email open rates
- CTR
- Incremental sales
9 Agency Reporting Tips and Best Practices
How can you enhance your agency reporting and make sure your clients see the value of your work clearly? Follow these best practices.
- Add Notes and Images to Your Report
- Make Sure You Don’t Miss Important Data
- Create Visually Appealing Reports
- Explain How Website Data Relates to the Client’s Business Goals
- Use Templates to Save Time and Energy
- Include a Next-Step Plan
- Make Connections to Historical Data
- Create Several Reports for Better Data Organization
- Report Frequently
Add Notes and Images to Your Report
Numbers only won’t tell a story to your client. And it’s exactly what a good report does – it tells a story about your performance. To make sure the numbers are clear to the person reading the report, make sure you add your notes.
For example, you can explain sudden peaks or drops in website traffic by adding a note about covering a trending topic in a blog post on that day.
Images containing graphs and charts will help the client visualize the data and understand the report better, especially if you’re comparing this month’s results to what you accomplished last month. Make sure you use all kinds of charts and tables, depending on what data you’re representing.
Make Sure You Don’t Miss Important Data
If you’re juggling several clients, it’s easy to “miss a spot” on your dashboard when analyzing your performance. However, the solution to this is rather simple.
If you use the right tools – for example, Databox – you can set up KPI alerts that will notify you as soon as something changes in your metrics. You will be notified when you reach a goal, when there’s an unexpected drop in sales or traffic, or whenever you want. This way, you won’t miss any red flags or opportunities and will be able to react timely.
Moreover, you can choose how you want to receive these alerts: via Slack, email, or mobile.
Create Visually Appealing Reports
Remember that the only way a client can understand the value of your work is if they understand the information you’re presenting to them.
To achieve that, you need to create a beautiful, well-organized report where you’ll display the data clearly and divide it into sections that make sense. Start with the most relevant data and your best results at the top of the report and then dive into a bit more detailed metrics below.
Make sure these metrics are divided into clusters that are easy to grasp and give each cluster a heading: for example, brand awareness, SEO, ROI, etc.
Also, a professional look will give a nice final touch to your report. Customize it by using your brand colors and adding your and your client’s logo, and include elements that personalize your agency report. The client will appreciate the extra effort. If you have no logo yet, try using a free logo maker to create one, time and cost effectively.
Explain How Website Data Relates to the Client’s Business Goals
It’s all about the client’s website performance, but don’t forget about their business goals too. Sometimes, your clients won’t be able to make that connection on their own, so it’s your job to explain it to them.
If you’re reporting on different metrics you’ve agreed are your KPIs, ask yourself: does my client understand why this metric matters? Does my client understand how performing well in this section helps them achieve their overall business goals?
Keep these questions in mind throughout the report and try to answer them while presenting each set of the data. Focusing on how your KPIs relate to the client’s business goal will also help you choose what metrics to include in the report.
Use Templates to Save Your Time and Energy
If you have multiple clients, creating reports from scratch can take away a lot of your time and energy. Imagine the work you could have done for your clients if you hadn’t spent all those hours on creating reports!
Enter Databox agency reporting templates. Using dashboard templates can help you create reports faster and still be able to customize them for a personalized experience for each client. This way, you can focus more on what really matters, which is implementing your strategies, and eliminate the unnecessary steps that drive you away from your core tasks.
Templates help you scale your reporting, and whenever you have a new client, you can simply remove the irrelevant sections or add the ones you need for this specific report.
Include a Next-Step Plan
You should always make your agency reports transparent, even if there are some unexpectedly bad results. Hiding your data can cause a lack of trust between you and the client, which may result in ending your collaboration.
It’s natural for you to experience some ups and downs, and most clients will be pretty understanding about it. After all, sometimes you simply need to use the trial-and-error method to figure out what works.
However, we understand it’s not pleasant having to tell your client your strategy failed. That’s why it’s critical to include recommendations and an actionable plan on what you’re going to change next month and how you’re going to improve your tactics to generate a better outcome. The data you collect is only a tool, anyway – what matters is what you do with it afterwards.
Make Connections to Historical Data
Another great pratice that helps your clients understand better what you do for them is including historical data in your reports. It’s much easier for the client to visualize your progress if they’re able to compare your latest results with the past.
Have you managed to increase their website engagement rate? Or the number of qualified leads and conversions? Or their ROI is much higher now? Make sure you include historical data to highlight the positive changes or drops in activity, illustrate the trends or patterns you’ve noticed, and back up your analysis.
Note that this part of your report may be one of the most critical when it comes to proving value to your client: if there’s a steady increase in performance and your client has been able to reach their goals, it clearly proves that your efforts pay off.
Create Several Reports for Better Data Organization
If you need to report on several channels, creating several agency reports (by using looped dashboards in Databox) instead of one will work much better when it comes to reporting readability and organization.
Trying to squeeze everything into a single report may not work well if there are too many metrics to include. Instead, you can break down the data by channel to make it more effective. This way of presenting your data will give you enough room to include secondary KPIs if they’ll explain the data better.
Also, different channels often require different strategies and they may have different average values to compare to. What’s considered a good CTR on one platform may not be as good on another, so it’s best to separate the channels into their own dashboards for more accurate data representation.
Report Frequently
Although monthly reporting may seem like a logical choice at first, more frequent reporting aided by a client dashboard software, can help you eliminate potential issues in communication with your client.
A month is a long time between updates you give to the client. It deprives you of a chance to act promptly if you see things have gone south and the client has additional requests. Weekly reports, on the other hand, enable you to repair the damage while it’s still possible.
Moreover, your weekly reporting meetings can be much shorter than the monthly ones, which makes them less tiring for both sides.
With Databox Scorecards, you won’t be searching for performance updates anymore and you also won’t have to worry about your reporting frequency. Simply create a scorecard for each client and automate reporting for each day, week, month, and more. Databox Scorecards send you updates on your key performance indicators (KPIs) and can be delivered anywhere – through email, Slack, or the Databox mobile app.
Best Agency Reporting Tools
Your best ally in creating persuasive and well-organized reports that display all the relevant KPIs in an appealing and effective way are agency reporting tools. But how do you pick the right one for your team? Among the most popular ones are HubSpot, Google Analytics, Google Search Console, Semrush, Ahrefs, and so on.
And while each of these tools has a large number of integrations available and even some pre-built dashboard templates you can use immediately, navigating through each report and connecting all your data can be a rather time-consuming and tedious task. Not to mention that the visualizations can be quite limiting…
So, which tool should you pick then?
Enters Databox.
Databox is agency reporting software that allows you to create custom dashboards and streamlined client reports in just a few clicks. Thanks to its drag and drop dashboard designer, it’s easy to use even you are not that tech-savvy. No coding or design skills are required.
A wide range of dashboard templates helps you avoid building a report from scratch. What’s more, once you’re done with the report, you can easily share it with your team or client.
For agencies that want to go beyond internal efficiency and turn reporting into a core part of their service model, formalizing that approach can create additional leverage. Databox Solutions Partner Program is designed for agencies and consultants who embed performance dashboards and reporting into their client engagements. Instead of treating reporting as a recurring operational task, partners build it into their core offering—standardizing delivery, reducing manual work, and creating a recurring revenue stream tied to the reporting and performance management services they already provide.
Streamline Your Agency Reporting with Databox Today
Imagine creating enjoyable agency reports without spending hours customizing them. Imagine if you could actually work on developing a superb strategy for your client instead of building sections in your reporting tool. Imagine you could do it all in one place, automate it, and track performance in real-time. And on top of all, create reports that will clearly show the value of your work to your clients.
Well, with Databox, you don’t have to imagine anything.
You can easily make it your reality with just a few clicks using this custom dashboard software– automate agency reporting and never again waste your time on unnecessary steps that drive you away from the results you know you can achieve. Connect your data sources so you can visualize all data in one place, build client tracking dashboards quickly with our large palette of free templates, and customize the flow of your report so your clients get a fully personalized experience.
Sounds compelling? Create your free agency account in less than a minute and finally streamline your agency reporting.


