


")
Table of contents
You have the data. You just need to know which question to ask first.
TL;DR
- A revenue drop is never one problem. It is one of four: new customer revenue fell, existing customers expanded less, existing customers contracted, or customers churned. Identifying which component moved first determines every step that follows.
- Before diagnosing anything, confirm the drop is real: calendar-day variance, billing cycle anomalies, and seasonal patterns explain most single-month declines before any strategic cause does.
- Logo churn and revenue churn answer different questions and point to different owners. Conflating them sends the wrong team to solve the wrong problem.
- Involuntary churn (failed payments, expired cards) accounts for a significant share of churned MRR in most subscription businesses. Check it before escalating to Sales or CS.
- Databox Genie lets a CEO ask “Why did revenue drop in March compared to February?” and get a breakdown by MRR component tied to real account data — in minutes, without analyst support.
Revenue dropped this month. You asked your team why. You heard “we’re pulling the numbers together” and a timeline that ends sometime next week. So you open your laptop and start looking yourself. (If you want to skip the three-day investigation next time, try Genie free.)
The answer to why revenue dropped almost always traces back to one of four variables: new customer revenue fell, existing customers expanded less than expected, existing customers downgraded, or customers cancelled outright. Identifying which variable moved first determines what you investigate next and who owns the fix. Most CEOs skip straight to theories before isolating which component actually changed. That is why the investigation stalls.
The problem is not that revenue dropped. The problem is you cannot find out why fast enough to do anything about it.
Revenue is not one number — it is four questions
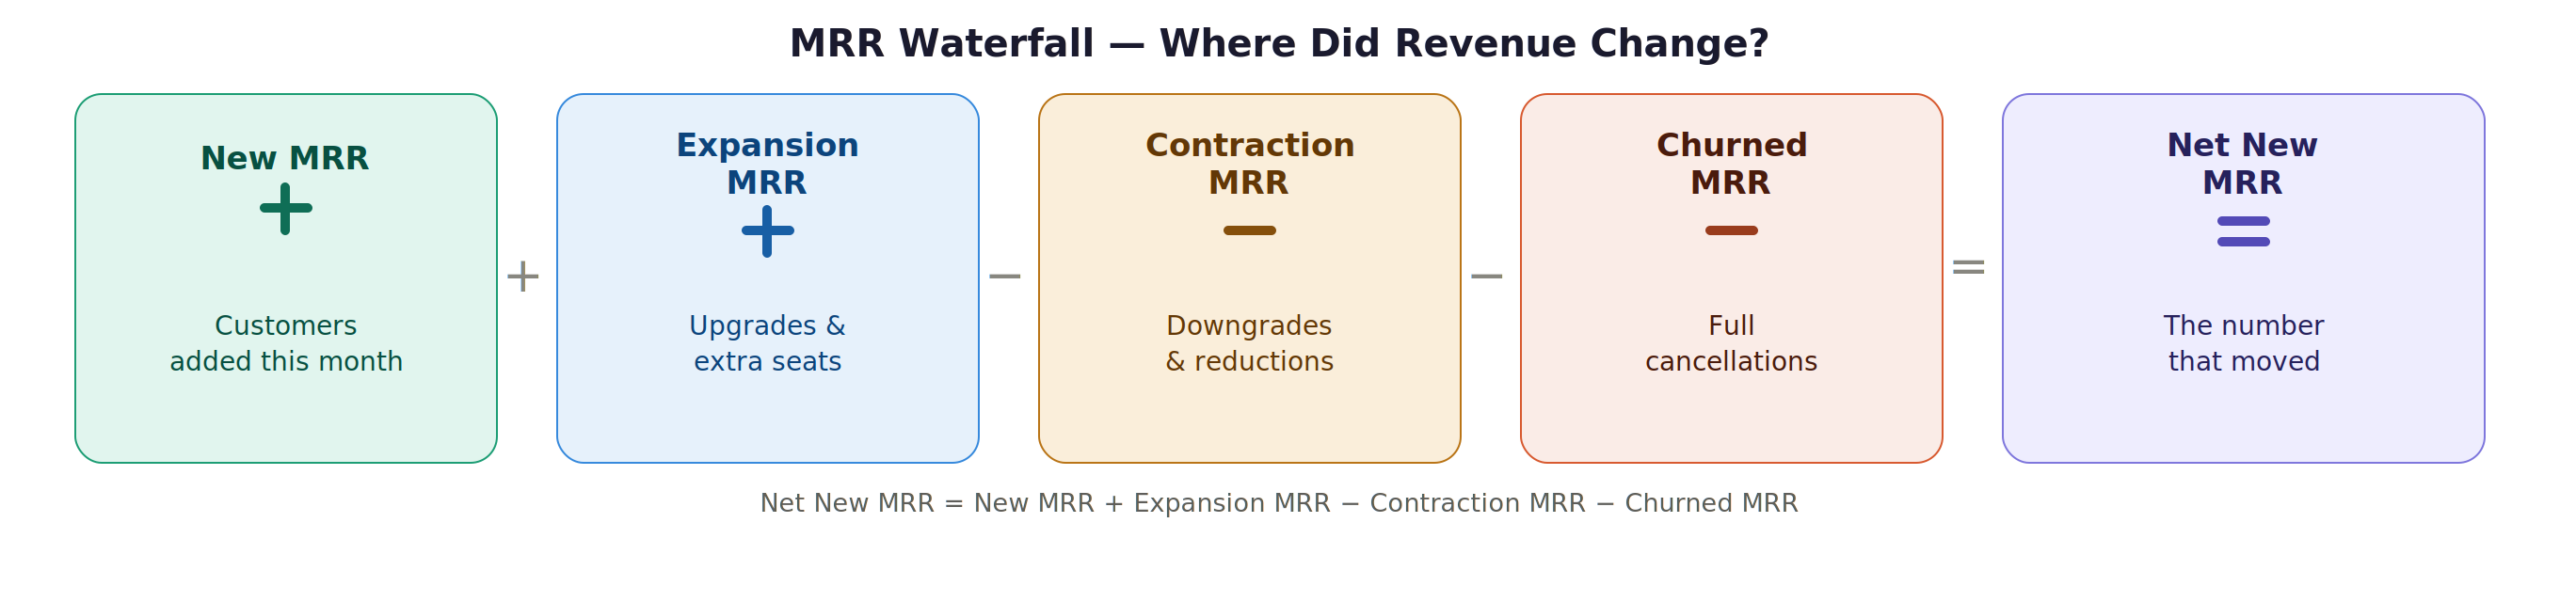
Total revenue is a sum, not a signal. A CEO who looks at total revenue month-over-month and sees a $40,000 drop knows almost nothing useful yet. The MRR waterfall breaks that number into its actual components:
Net New MRR = New MRR + Expansion MRR − Contraction MRR − Churned MRR
| Component | What It Measures | Who Owns It |
|---|---|---|
| New MRR | Revenue from customers who did not exist last month | Sales / CRO |
| Expansion MRR | Additional revenue from existing customers — upgrades, seats, add-ons | Customer Success / Product |
| Contraction MRR | Revenue lost from downgrades — customers who stayed but paid less | Customer Success / Account Management |
| Churned MRR | Revenue lost from full cancellations | Customer Success / Product |
Pull this breakdown before you do anything else. Each component has a different owner and a different fix. A VP of Sales investigating a new MRR shortfall while the real problem is contraction MRR from three downgrading enterprise accounts wastes a week. Decompose first.
Before you diagnose, confirm the drop is real
Many apparent single-month revenue drops are comparison artifacts, not actual business deterioration. Three errors appear constantly:
Calendar-day variance. February has 28 days. January has 31. A 10% month-over-month decline in a shorter month may be arithmetic, not performance. Compare trailing 30-day revenue to prior trailing 30-day revenue, not raw calendar months.
Seasonal blind spots. Comparing October to September without checking October year-over-year misses recurring seasonal patterns. A drop that looks alarming against last month may be entirely normal against the same month last year.
Billing cycle anomalies. Annual contracts renewing in one month inflate that month’s revenue. The following month looks artificially depressed against an anomaly, not a baseline.
If none of these apply, same calendar period last year showed stronger performance, no one-time billing events distort the prior month, and the trailing 30-day comparison still shows a decline, the drop is real. Move to the MRR waterfall.
A volume drop and a value drop need different investigations
Once you know which MRR component shifted, the next question is whether you lost customers or lost revenue per customer.
Logo (customer) churn measures how many customers cancelled. Revenue churn measures how much contracted value disappeared. The gap between the two tells a specific story.
If logo churn is high but revenue churn is low, smaller accounts are leaving. The ACV impact is contained, but the pattern signals a broken early customer experience, an onboarding or product-fit problem in lower tiers.
If logo churn is low but revenue churn is high, a small number of large accounts downgraded or cancelled. The revenue hit can be severe even though the cancellation count looks manageable. The signal points to an account management or product gap at the enterprise tier.
The decision rule: pull your churned account list from billing, sort by ACV, and look at the top ten. If one or two accounts explain most of the churned MRR, you have a concentrated enterprise problem, not a broad retention crisis. Different owner, different urgency, different response.
Check involuntary churn before escalating to Sales or CS
The most overlooked cause of a single-month revenue drop is not a sales miss or a CS failure. It is a payment processing failure. Most CEOs escalate to the wrong team before checking this, and most of the time, that is the wrong call.
Failed payments, expired cards, and billing friction drive a meaningful share of churned MRR in subscription businesses. Unlike voluntary churn, involuntary churn is largely recoverable if caught quickly. Before you brief the CS team on a retention crisis, check three things:
- Failed payment rate this month versus the prior 60-day baseline. Did failures spike?
- Dunning sequence performance. Are recovery emails sending and converting?
- Card expiration cohort. Is there a cluster of customers whose cards expired this month?
An anomaly in any of these means you have found a mechanical problem, not a customer satisfaction problem. The fix is operational, and no Sales accountability conversation is required.
Genie collapses this investigation into one conversation
According to Databox’s “Time to Insight: What Are the Biggest Roadblocks to Actionable Data?” survey, 64% of business leaders say it typically takes one to three days to gather the data needed to answer a single business question.
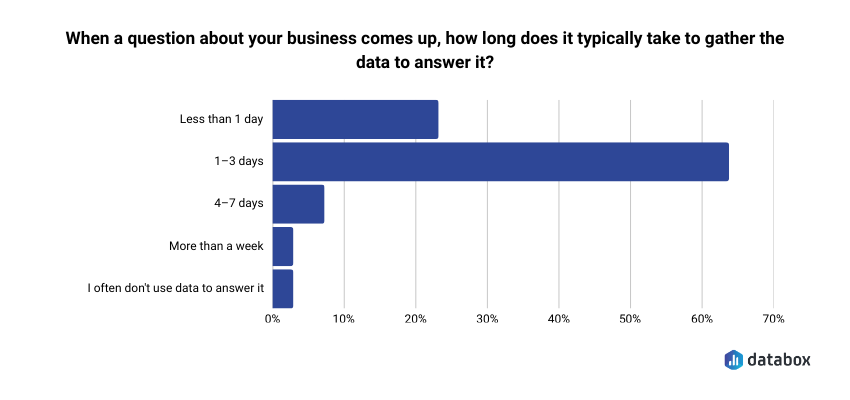
The delay is structural: revenue data lives in your CRM, billing system, and spreadsheets with no connection between them. Assembling the MRR waterfall manually takes days, not because the analysis is hard, but because the data assembly is.
Genie is Databox’s conversational AI analyst. A CEO types a plain-language question and gets a breakdown tied to real account data from Databox’s standardized, connected metrics. The following prompts map directly to the diagnostic above:
- “Show me MRR waterfall for this month vs. last month”
- “Which customer segments had the largest revenue decline this month?”
- “Compare churned MRR by plan tier for this month vs. last month”
- “How many failed payments did we have this month vs. last month?”
- “What drove the drop in expansion MRR this month?“
The before-and-after is direct. Before Genie, the same investigation sends a CEO across five tools over two to three days — CRM, billing, finance spreadsheets, and multiple exports. By the time the picture is complete, the window for a fast response has closed. With Genie, the CEO asks the question, gets the component breakdown with account-level context, and moves to a decision in the same session.
“Having an AI analyst that can just tell you why a metric has dropped and what’s likely driving it — that’s a game-changer. Genie feels like having a smart teammate who’s always watching the data.”
Conclusion
A revenue drop almost never stays unexplained once you separate the four MRR components, apply the logo-versus-revenue churn distinction, rule out involuntary churn, and confirm the comparison is valid. The framework is not complicated. What has been hard is assembling the data fast enough to use it. A CEO who could not answer “why did revenue drop?” without waiting three days now can — before the window to act closes.
Frequently Asked Questions
How long should a revenue drop diagnostic take without analyst support?
With connected data, the MRR component breakdown takes under 30 minutes. The comparison check and involuntary churn review add another 15 to 20 minutes. A complete first-pass investigation should take under an hour. If it is taking three days, the delay is data assembly, not analysis complexity.
What is the difference between revenue churn and logo churn, and why does it matter?
Logo churn counts how many customers cancelled. Revenue churn measures how much contracted value disappeared. A company can have low logo churn and high revenue churn if a small number of large accounts downgraded. The distinction tells you whether you face a broad customer experience problem or a concentrated enterprise account problem — different owner, different urgency, different fix.
Why should I check for involuntary churn before escalating to Sales or CS?
Involuntary churn — failed payments, expired cards, billing friction — drives a meaningful share of churned MRR in subscription businesses. Unlike voluntary churn, it is largely recoverable if caught quickly. Escalating to Sales or CS before checking payment data wastes time and sends the wrong team to a mechanical problem.
How do I know if a revenue drop is seasonal or structural?
Compare the current month to the same month in the prior year, not only to last month. If the same calendar period last year showed a similar pattern, the drop follows a seasonal cycle. If the year-over-year comparison also shows a decline, or if the same MRR component has dropped for two consecutive months, the problem is structural.
Can I run this diagnostic without an MRR waterfall already set up?
Yes, but with more manual work. Pull new customer revenue from your CRM, revenue increases from existing customers from billing, revenue decreases from downgraded accounts, and full cancellation revenue from your billing system separately. Databox can automate this breakdown across 130-plus native integrations if your data sources are connected.


