Table of contents
60% of BI initiatives fail to deliver business value—despite more than $15 billion spent annually on business intelligence or BI tools, according to Dataversity (November 2025).
TL;DR
- 60% of business intelligence initiatives fail to deliver business value—not because of bad tools, but because companies buy for data teams instead of revenue teams.
- This comparison evaluates Power BI, Tableau, Looker, ThoughtSpot, and Databox through six criteria that matter for non-technical users: self-service capability, AI reliability, revenue-stack integrations, time to first trusted insight, total cost of ownership, and adoption design.
- The five failure modes to avoid: the Shelfware Trap (tool requires analyst skills), TCO Shock (hidden costs sink ROI), Metric Chaos (no governed definitions), the Demo Trap (clean sample data hides real complexity), and AI Hallucination (LLM does calculations instead of querying governed metrics).
- Databox + Genie scores highest for revenue teams needing fast, trusted answers without analyst dependency. Power BI and Looker are better fits for enterprises with dedicated BI resources.
- The critical question for any AI-powered BI tool: does the LLM perform the math, or does a separate computation engine query governed metrics? The answer determines whether you get reliable analytics or confident guesses.
You’ve seen this play out. The demo was flawless. The slides showed beautiful dashboards. Leadership signed off. And six months later, the VP of Marketing still files a ticket every time MQLs drop unexpectedly, because nobody on the revenue team can actually use the thing without analyst support.
Most business intelligence (BI) tool comparisons are written for data engineers. They optimize for SQL flexibility, semantic modeling depth, and enterprise scalability. That’s useful content… for someone. But if you’re a VP of Marketing, a Head of Sales, or a RevOps lead trying to figure out why pipeline is down and what to do about it before your next board meeting, those feature matrices don’t solve your problem.
The standard comparison content doesn’t serve this buyer. And the standard buying process produces the standard outcome: shelfware.
This article gives you a different approach. You’ll get a decision framework built around five documented failure modes, the patterns that cause BI investments to collapse. You’ll see six evaluation criteria filtered through a revenue lens, designed to expose whether a tool will work for non-technical users answering GTM questions. And you’ll get an honest comparison of the tools most likely to land on a modern revenue team’s shortlist — including a question every buyer must now ask about AI reliability that most comparison articles still ignore.
“Dashboards show you what happened. The right BI tool tells you why, and who on your revenue team can actually get that answer without filing a ticket.”
Why Most BI Tool Comparisons Are Useless for Revenue Teams
Generic BI comparisons optimize for data-team buyers, people who can write SQL, configure LookML, or build calculated fields in DAX. Revenue leaders don’t need those capabilities. They need answers to specific questions about pipeline, CAC, conversion rates, and MQL quality — fast, without a dependency on the data team.
Self-service analytics promised that leaders like the COO, VP of Marketing, and Head of Sales could answer routine questions without waiting. In practice, it still meant “you can see charts,” not “you can get explanations you can run the business on.”
The gap between “access to dashboards” and “ability to answer questions” is where most BI investments quietly fail. A VP of Marketing staring at a chart showing MQLs dropped 20% doesn’t need more visualization options. They need to know why it dropped, which channels drove the decline, and whether it’s an anomaly or a trend — and they need that answer in minutes, not days.
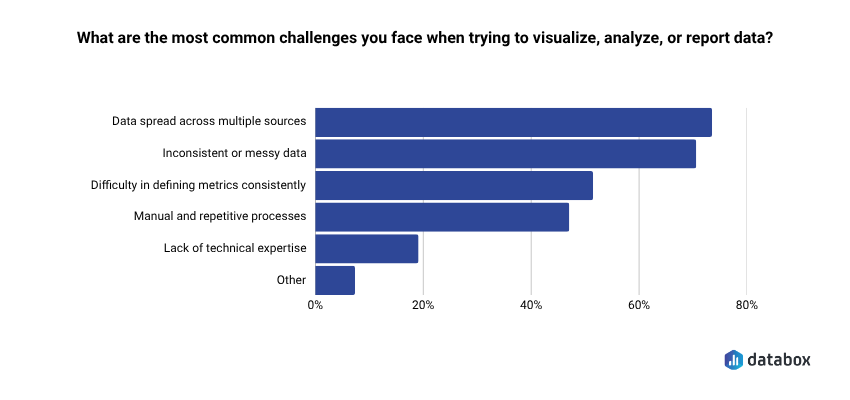
According to Databox’s Time to Insight research, 73% of teams say data spread across multiple sources is their top reporting challenge. When your revenue data lives in HubSpot, Salesforce, GA4, and a Stripe export someone emailed last quarter, the tool that promises “connect any data source” isn’t solving your problem unless your team can actually use that connection without technical help.
Here’s the permission structure for what follows: if your team knows SQL and has dedicated analyst resources, traditional BI tools are powerful and appropriate. The question this article addresses is narrower: what happens when the person who needs the insight isn’t a data analyst and can’t wait two days for one?
The 5 Ways Revenue Teams Get Burned by BI Tools
BI implementation failure isn’t random. It follows predictable patterns. Naming these patterns in advance is the difference between buying with eyes open and repeating the same expensive mistake.
If you’ve been through a failed BI implementation before, you’ll recognize at least two of these. If you’re evaluating tools now, use this as a diagnostic checklist — any tool that doesn’t address these failure modes head-on is likely to reproduce them.
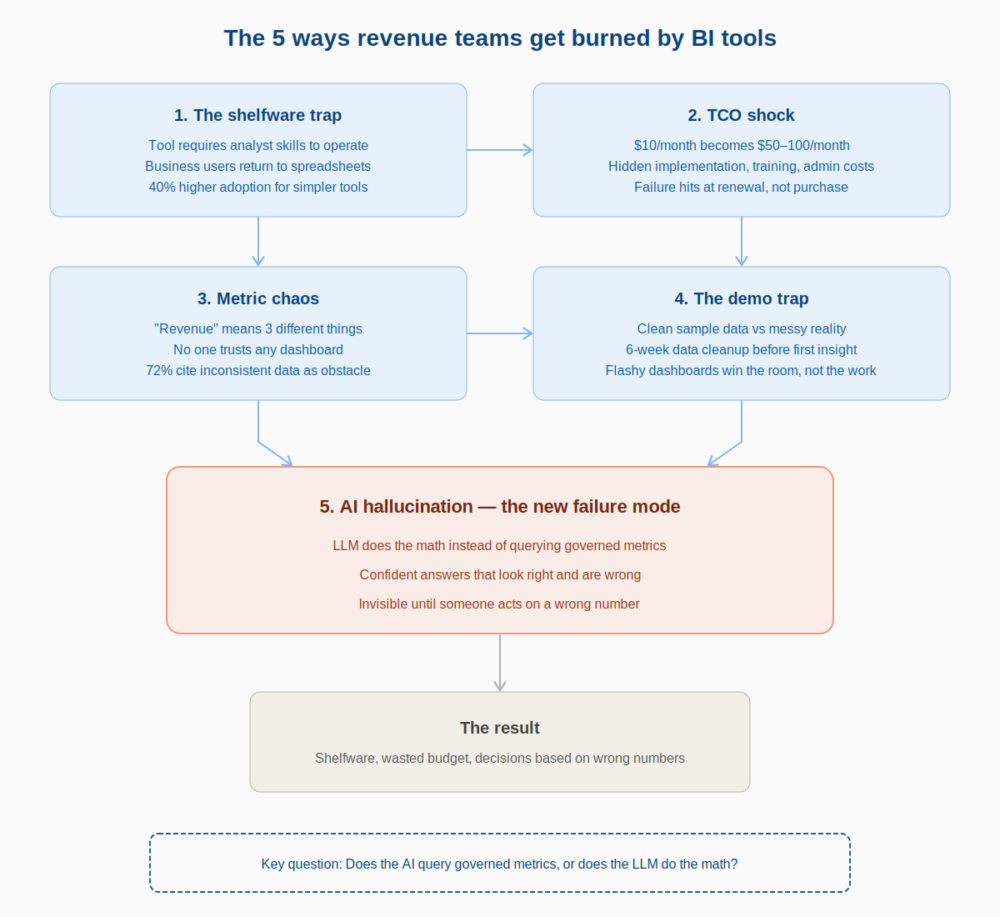
1. The Shelfware Trap
The tool required analyst skills to operate, so only analysts operated it. Business users went back to spreadsheets. The “self-service” promise was real for people who already knew the tool, not for the VP of Marketing who needed MQL data at 9 AM on a Tuesday.
Baked into the architecture of most BI tools, this is the most common failure mode. Designed by data professionals for data professionals, these tools carry a steep learning curve and an interface that assumes familiarity with data modeling concepts. The result: a tool that sits in the tech stack, technically available, practically unused.
Forrester’s 2025 BI Wave research found that user adoption rates are 40% higher for simpler tools in organizations under 1,000 employees. Simplicity isn’t a feature compromise, it’s a core requirement for tools that need to serve non-technical teams.
2. TCO Shock
License cost is the visible iceberg tip. The rest: implementation services, training, additional connector licenses, ongoing admin time, the BI analyst hire you didn’t plan for, sinks the ROI calculation. The failure mode hits at renewal, not at purchase.
That $10/month Power BI license becomes $50–100/month per user when you factor in premium features, capacity licensing, and the implementation partner you needed to make it work. Implementations balloon from $2K projected to $25K actual.
The vendor won the demo. The invoice won the argument.
When evaluating tools, build a 12-month TCO estimate that includes implementation, training, ongoing administration, and any analyst dependency the tool requires. A “cheap” tool that needs a dedicated admin isn’t cheap.
3. Metric Chaos
When “Revenue” means three different things across three dashboards, no one trusts any of them. Teams revert to whoever’s spreadsheet is most recently updated. The BI tool becomes a source of conflict, not a source of answers, especially across marketing, sales, and finance.
Metric chaos is a governance problem that most BI tools don’t solve by default. They give you the power to define metrics, but without a semantic layer or enforced definitions, every team builds their own version of the truth.
According to our Time to Insight research, 72% of teams cite inconsistent or messy data (shown on the chart above) as a regular obstacle to turning data into action. If your tool doesn’t enforce standardized metric definitions before deployment, you’re building on a foundation that will crack.
4. The Demo Trap
The evaluation ran on clean, sample data. Production data is messy, fragmented, and spread across HubSpot, Salesforce, GA4, and a Stripe export someone emailed last quarter. The tool that looked polished in the demo becomes a 6-week data-cleaning project before the first dashboard goes live.
Too often, organizations buy a BI tool because it looks impressive in a demo. Flashy dashboards may win the room, but if the tool doesn’t map back to actual business goals;, and actual business data; it quickly becomes shelfware.
The antidote is running your evaluation on real production data, not sample datasets. Any vendor that can’t or won’t do this is hiding something.
5. AI Hallucination — The New Failure Mode
No prior BI buying cycle accounted for this risk, and most comparison articles still don’t address it.
Every tool on the market now claims “AI-powered” capabilities. The architecture behind that claim matters enormously. An AI BI assistant that queries raw data with an LLM doing the math is not a reliable analyst. It is a confident guesser.
Most AI data tools let the LLM do the calculations, it reads your numbers, tries to compute averages, and hallucinates the results. A language model doing your math is a confident guesser. It can produce a number that looks right, reads well, and is wrong.
The failure mode is invisible until someone acts on a wrong number. The AI response sounds authoritative. The executive makes a decision. Nobody discovers the error until the forecast misses or the campaign underperforms.
Any tool you evaluate needs to answer this question directly: does the AI query governed metrics, or does the LLM do the math?
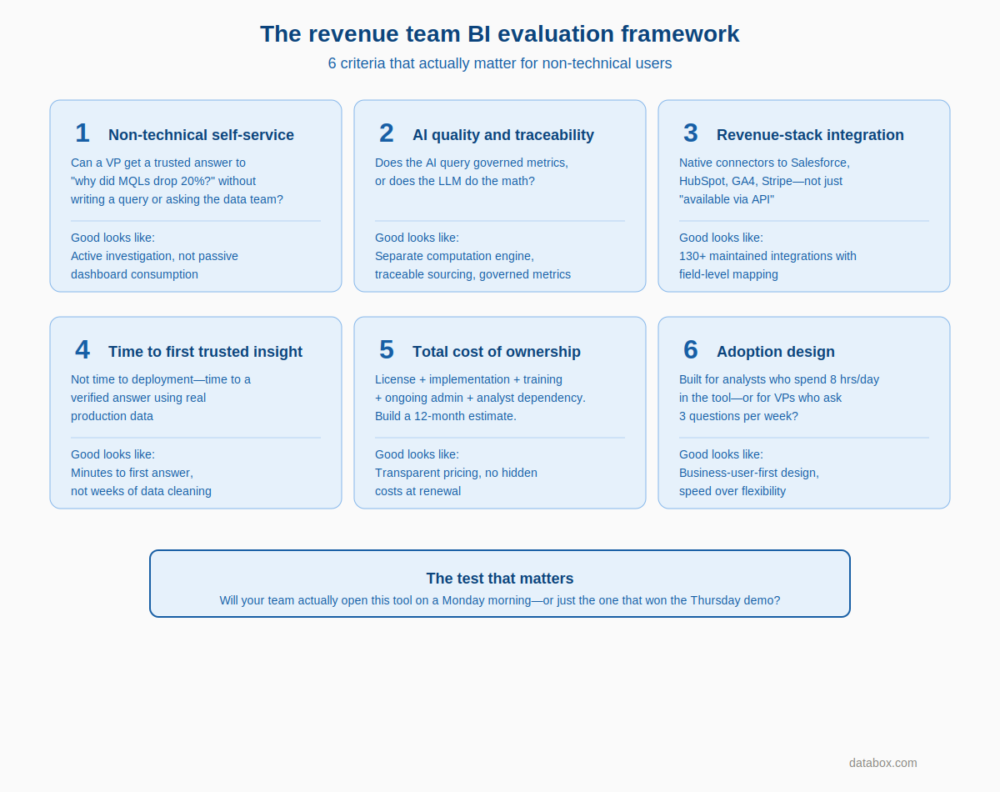
The Revenue Team BI Evaluation Framework: 6 Criteria That Actually Matter
Before comparing any tools, revenue leaders need evaluation criteria built around their actual use case, not the data team’s. Every criterion below is designed to expose whether a tool will work for a non-technical business user trying to answer a revenue question.
The criteria below also scaffold the comparison that follows. When you see a tool rated “High” or “Low” on these dimensions, you’ll know exactly what that means.
Criterion 1 — Non-Technical Self-Service
Can a VP of Marketing get a trusted answer to “why did MQLs drop 20% last week?” without writing a query, building a calculated field, or asking the data team?
Define self-service specifically: not “they can see a dashboard” but “they can get an explanation they can act on.” The difference is the gap between passive consumption and active investigation. A self-service tool that only lets users view pre-built charts isn’t self-service for the questions that actually matter.
Criterion 2 — AI Quality and Traceability
Does the AI query governed, standardized metrics, or does it generate answers from raw data using the LLM as the computation engine?
The trustworthy AI stack requires four components: plain-language input and output, a separate computation engine (not the LLM) running calculations against real data, standardized metric definitions, and traceable sourcing. Without all four, the answer isn’t trustworthy.
Organizations implementing AI-enhanced BI often report faster insight discovery. Speed is only valuable if the answer is correct. A wrong answer delivered fast is worse than no answer at all.
Criterion 3 — Revenue-Stack Integration Depth
Native connectors to Salesforce, HubSpot, GA4, Google Ads, Meta Ads, Stripe, not “available via API” but actual maintained integrations with field-level mapping.
A 130+ native integration count means the revenue team can connect their actual stack without a data engineer standing up a custom pipeline. “Available via API” means weeks of engineering work before you see your first dashboard.
Criterion 4 — Time to First Trusted Insight
Not time to deployment. Not time to first dashboard. Time to a verified, trustworthy answer to a real business question using real production data.
Demo trap tools fail on this criterion immediately. They can show you a polished dashboard on sample data, but getting to a trusted answer on your actual data takes weeks of cleaning and model building.
Companies using Power BI within existing Microsoft environments report faster time-to-value compared to greenfield implementations. The broader point: ecosystem fit is a major time-to-value driver. Outside that ecosystem, the time-to-value story changes dramatically.
Criterion 5 — Total Cost of Ownership
License cost + implementation cost + training cost + ongoing admin + connector licensing + BI analyst dependency. Build a 12-month TCO estimate, not a per-seat figure.
The $10/month tool is only cheap if your team can use it without help. Factor in the analyst hours required to build and maintain dashboards, the training investment to get non-technical users productive, and the hidden costs of connectors and premium features.
Criterion 6 — Adoption Design: Built for Analysts or Business Users?
Most buyers never ask the architectural question underneath this criterion. Was the UI and interaction model designed for a data analyst who will spend 8 hours a day in the tool, or for a VP who will ask three questions per week and needs answers in seconds?
Analyst-first tools optimize for flexibility and depth. Business-user-first tools optimize for speed and simplicity. Both are valid — but only one serves revenue teams without analyst support.
BI Tools Compared: The Revenue Team Shortlist
The five tools below represent the most likely options on a modern revenue team’s shortlist. Each is evaluated through the six-criterion framework above — not by feature count.
| Tool | Non-Technical Self-Service | AI Quality | Revenue Integrations | Time to Insight | TCO (12-month) | Adoption Design |
|---|---|---|---|---|---|---|
| Power BI | Medium | Medium | Medium | Medium* | Low–Medium | Analyst-first |
| Tableau | Medium | Medium | Medium | Medium | Medium–High | Analyst-first |
| Looker | Low | Medium | Medium | Low | High | Analyst-first |
| ThoughtSpot | High | Medium | Medium | High | Medium–High | Mixed |
| Databox + Genie | High | High | High | High | Low–Medium | Business-user-first |
*With Microsoft 365 ecosystem. Ratings reflect revenue-team use case specifically, not general enterprise BI capability.
Power BI
Default choice for Microsoft 365 enterprises. The cost structure is genuinely hard to beat at entry level, and faster time-to-value in existing Microsoft environments is a real advantage for enterprise teams already on Azure.
The UI can be unintuitive for non-technical users. DAX has a steep learning curve that effectively locks business users out of anything beyond pre-built reports. Sharing reports across organizations introduces deployment complexity that requires admin involvement.
AI Copilot features are maturing but still require well-structured semantic models to avoid unreliable outputs. Without a built and governed semantic model already in place, Copilot amplifies inconsistency rather than solving it.
Pricing signal: Entry licensing starts low (~$10/user/month for Pro), but premium features and capacity licensing escalate. The cheap starting point often isn’t where you end up.
Honest verdict: Best for Microsoft-stack enterprises with existing BI resources. Revenue-team verdict: adoption friction is high unless paired with a dedicated analyst.
Tableau
Long the tool of choice for executive reporting, Tableau’s drag-and-drop interface is genuinely intuitive for chart building. Strengths include visualization richness, a broad data connector library, and a strong community.
Weaknesses: Tableau Cloud performance can be sluggish at scale. The platform lacks robust integrated semantic modeling, so metric consistency depends on upstream governance you build yourself. Post-Salesforce acquisition, the product roadmap has felt uncertain to many existing customers. Tableau Pulse (AI) is promising but early.
Pricing signal: Starts around $75/user/month (Creator). Scales quickly for org-wide deployment.
Honest verdict: Best for data-savvy teams that prioritize visualization quality and have analyst resources. Revenue-team verdict: powerful for presentation-layer dashboards; less suited for ad-hoc revenue questions without analyst involvement.
Looker
LookML’s governed semantic layer solves the metric chaos problem — when configured correctly, “Revenue” means the same thing everywhere. That’s a genuine architectural advantage for teams that have suffered metric inconsistency.
LookML requires technical investment to set up and maintain. Starting at ~$35,000/year, Looker is an enterprise-tier commitment, not a growth-stage starting point. Self-service is real for users — but only within models a data team has pre-built. Outside those models, users are stuck.
Pricing signal: Enterprise pricing. $35,000/year entry point (Google Cloud).
Honest verdict: Best for data-team-supported organizations that need a governed semantic layer. Revenue-team verdict: excellent if the data team can build and maintain the models; non-starter if they can’t.
ThoughtSpot
Natural language search is genuinely fast and intuitive — one of the better implementations of the “ask a question, get a chart” experience. Ideal for sales and revenue teams who want to skip custom dashboard builds and explore data conversationally.
The limitation: powerful only when queries stay within well-defined models. Outside those guardrails, results degrade. AI answers (Sage) are improving but carry the same governed-vs-raw-data question. Without a strong underlying data model, the natural language interface produces unreliable results.
Pricing signal: Mid-to-high enterprise tier. Pricing not publicly listed; typically quoted.
Honest verdict: Best for teams with a clean data model who need fast ad-hoc exploration. Revenue-team verdict: strong on the discovery use case; weaker on standardized revenue reporting.
Databox + Genie
Purpose-built for revenue teams tracking marketing, sales, and business performance from SaaS platforms, not a general-purpose enterprise BI tool, and it shouldn’t be evaluated as one.
The differentiator is Genie’s governed AI architecture: answers are grounded in standardized metrics inside Databox. The computation engine (not the LLM) runs the actual calculation. When data isn’t available, Genie says so rather than guessing.
Use case example: MQLs drop 20% week-over-week, leadership wants answers by end of day. Ask Genie why, it ties the drop to a specific paid channel, compares it to the last 30 days, and surfaces where to focus next, in minutes, without a ticket.
Integrations: 130+ native integrations including HubSpot, Salesforce, Google Analytics 4, Stripe, QuickBooks, Meta Ads, Google Ads, BigQuery, MySQL, Snowflake.
Advanced Analytics: Since the 2025 Advanced Analytics release, Databox has added Datasets (data preparation), a no-code SQL builder, and multidimensional metrics — enterprise-level analytical depth without enterprise-level complexity.
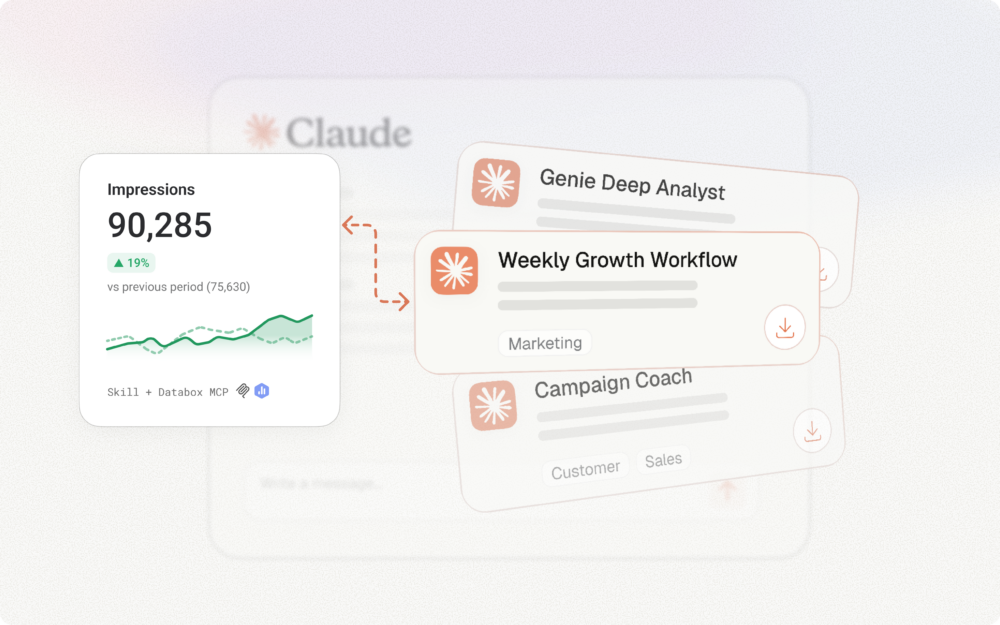
MCP forward-look: For teams already using Claude or ChatGPT: Databox MCP exposes connected data through the Model Context Protocol, allowing any MCP-compatible AI to query business metrics directly.
Pricing signal: Transparent, tiered pricing starting with a free plan. No $35K entry commitment.
Honest verdict: Best for revenue teams (marketing, sales, RevOps) at SaaS and growth-stage companies who need fast, trusted answers to GTM questions without BI analyst dependency. Not the right tool for complex enterprise data warehouse visualization or deep custom data modeling. For those needs, Power BI or Looker is the more honest answer.
“I’ve used Power BI, Tableau, TripleWhale—they’re complicated and limited. Databox is simple, smart, and flexible. It’s the first tool that met all our business needs.”
What “AI-Powered BI” Actually Means — and the Question Every Buyer Must Ask
Every tool on this list claims “AI-powered” capabilities. The question that separates reliable AI analytics from confident guessing is architectural.
The Trustworthy AI Stack
Reliable AI analytics requires four components:
Plain-language input and output. Users ask questions in natural language and receive answers they can understand. Most AI BI tools deliver this — it’s table stakes.
A separate computation engine. The LLM handles language understanding. A proper analytics engine handles the math. The LLM never touches the calculations.
Standardized metric definitions. The AI queries governed metrics with consistent definitions — not raw data tables that can be interpreted multiple ways.
Traceable sourcing. Every answer includes visibility into where the data came from and how the calculation was performed.
Without all four, the AI answer isn’t trustworthy — it’s a sophisticated guess.
The Question to Ask Every Vendor
Ask this directly: “When I ask your AI a question that requires calculation, does the LLM perform the math, or does a separate computation engine run the query against governed metrics?”
Tools that route questions through a proper analytics stack against governed metrics produce reliable results. Tools that let the LLM read data and generate numbers produce results that sound right but may not be.
How to Use This Framework
The framework above isn’t designed to produce a single “right” answer. It’s designed to help you avoid the wrong one.
Before your next demo, map your actual use case against these criteria:
Identify who needs answers. If your primary users are non-technical revenue leaders who need ad-hoc answers without analyst support, weight Criterion 1 (Non-Technical Self-Service) and Criterion 6 (Adoption Design) heavily. With dedicated analyst resources, the calculus changes.
Audit your integration requirements. List every tool where revenue-relevant data lives. Check whether each platform on your shortlist has native, maintained integrations, not “available via API” promises.
Calculate real TCO. Build a 12-month estimate that includes implementation, training, ongoing admin, and any analyst dependency. Compare that number, not the per-seat licensing figure.
Test on production data. Any vendor that can’t or won’t run their evaluation on your actual data is hiding the demo trap. Your data is messy. Your data has gaps. A tool that only works on clean sample data won’t work for you.
Ask the AI question directly. “Does the LLM do the math, or does a separate computation engine handle calculations against governed metrics?” The answer tells you whether the AI feature is a productivity multiplier or a liability.
The tool that wins your evaluation should be the one your team will actually open on a Monday morning — not the one that looked best in a Thursday afternoon demo.
Revenue teams have been burned enough. The next BI investment should be the one that finally delivers.
Frequently Asked Questions
Why do most BI implementations fail for revenue teams?
Most BI tools are designed for data analysts, not business users. The interface assumes familiarity with data modeling, the learning curve is steep, and “self-service” means “you can view dashboards someone else built”—not “you can get answers to your own questions.” When the VP of Marketing still needs to file a ticket to understand why MQLs dropped, the tool has failed its purpose regardless of how many features it has.
What’s the difference between “self-service analytics” and actual self-service?
Self-service analytics typically means non-technical users can access dashboards without filing a request. Actual self-service means they can investigate questions, explore causes, and get explanations they can act on—without writing queries, building calculated fields, or waiting for analyst support. The gap between viewing charts and answering questions is where most BI investments quietly fail.
How do I calculate the true cost of a BI tool?
Build a 12-month total cost of ownership estimate that includes: license fees (including premium features and capacity tiers), implementation services, training costs, ongoing administration time, connector licensing, and any analyst dependency the tool requires. A $10/month tool that needs a dedicated admin and a six-week implementation isn’t cheap—it’s hidden expense
What is AI hallucination in BI tools, and why does it matter?
AI hallucination occurs when an LLM generates calculations instead of querying actual data. The model pattern-matches what an answer should look like rather than executing the math against your numbers. The result can look authoritative and be completely wrong. This matters because executives make budget, headcount, and pipeline decisions based on these numbers. The fix: ensure the AI queries governed metrics through a separate computation engine—the LLM should handle language, not math.
How do I evaluate whether a BI tool’s AI is reliable?
Ask the vendor directly: “When I ask your AI a question that requires calculation, does the LLM perform the math, or does a separate computation engine run the query against governed metrics?” Reliable AI analytics requires four components: plain-language input/output, a separate computation engine for calculations, standardized metric definitions, and traceable sourcing. Without all four, the answer is a sophisticated guess.
Which BI tool is best for revenue teams without dedicated analyst support?
Databox + Genie scores highest for revenue teams (marketing, sales, RevOps) who need fast answers to GTM questions without analyst dependency. ThoughtSpot is strong for ad-hoc exploration if you have a clean underlying data model. Power BI and Tableau require analyst involvement for anything beyond pre-built reports. Looker requires significant technical investment before business users see value.
When is Power BI the right choice?
Power BI is best for Microsoft-stack enterprises with existing BI resources. The integration with Dynamics, Azure, and Excel is strong and often one-click — but that advantage disappears outside the ecosystem. If your team doesn’t know DAX and you don’t have a dedicated analyst, adoption friction will be high regardless of the low entry price.
When is Looker the right choice?
Looker is best for organizations that have suffered metric chaos and need a governed semantic layer—where “Revenue” means exactly one thing everywhere. The catch: LookML requires technical investment to set up and maintain, and the $35,000/year starting price makes it an enterprise-tier commitment. Self-service only works within models the data team has pre-built.
What should I test during a BI tool evaluation?
Test on your real production data, not sample datasets. Pick a question that already triggered a Slack message or support ticket in your organization—something like “why did MQLs drop last week” or “what’s our CAC by channel this month.” Have the actual end user (VP, RevOps lead) run the test, not an analyst. Set a time limit. If the tool can’t produce a trusted answer on messy real-world data within that window, it will fail in production.
What’s the most important question to ask during a BI vendor demo?
“Can we run this evaluation on our actual production data instead of your sample dataset?” Any vendor that can’t or won’t do this is hiding the demo trap—the gap between how the tool performs on clean sample data versus your messy, fragmented, real-world data. That gap is where most BI implementations die.