


Table of contents
We’re getting closer to the end of the month.
And while you and your team have been heads down on the work and ways to make adjustments all month––it’s time to fill everyone else in your organization in on what marketing is doing and how it’s performing. To be clear – marketing is the most monitored and reported operation, according to Databox’s state of business reporting.
So, where do you start? What should you include?
Or, maybe we start at the beginning. Who should be preparing the marketing report?
Just shy of 10% of companies we surveyed said their monthly marketing report is prepared by the CMO:
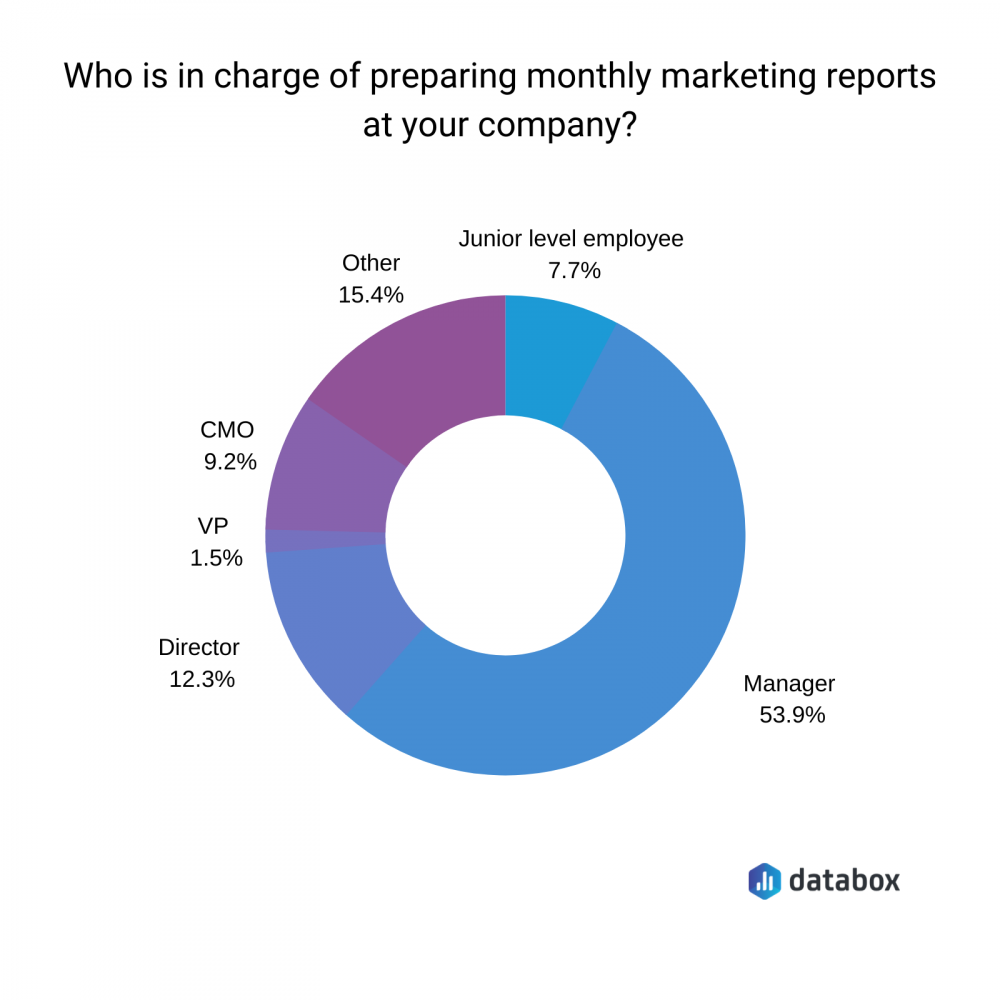
More often than not, it’s a marketing manager creating the report.
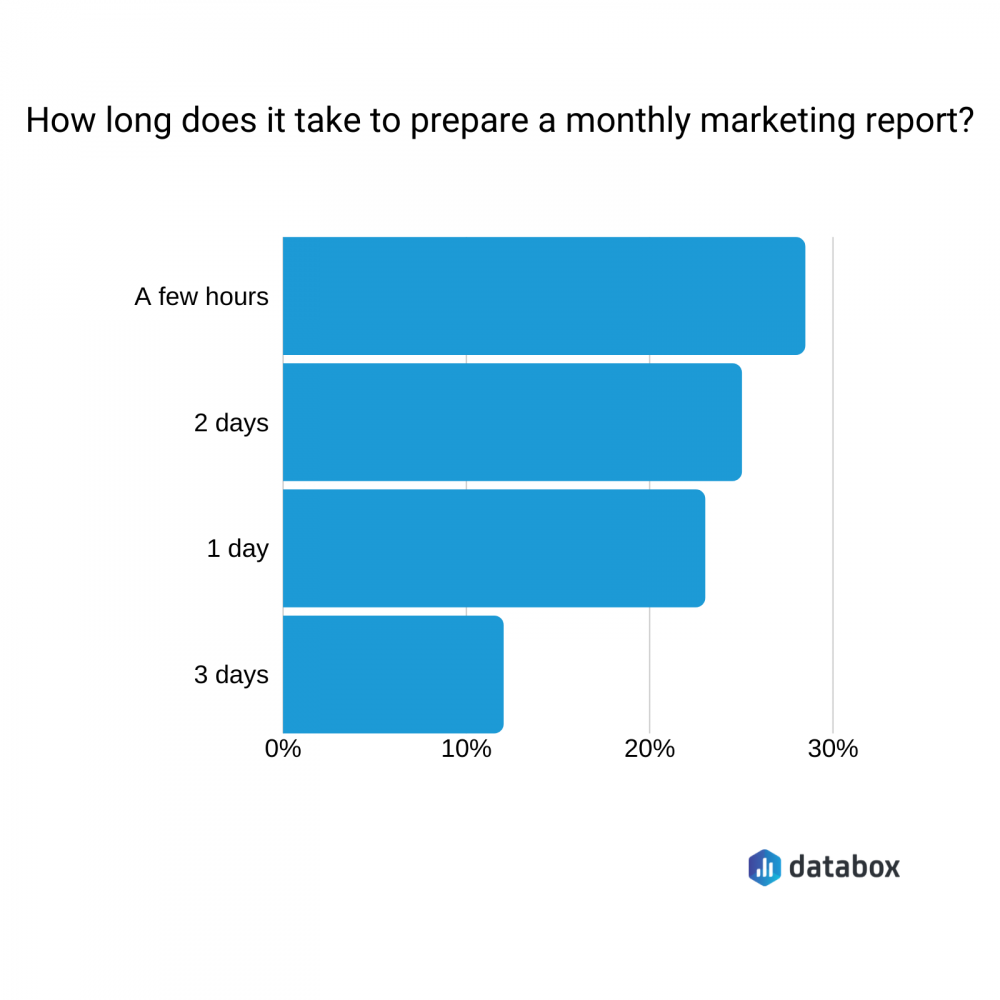
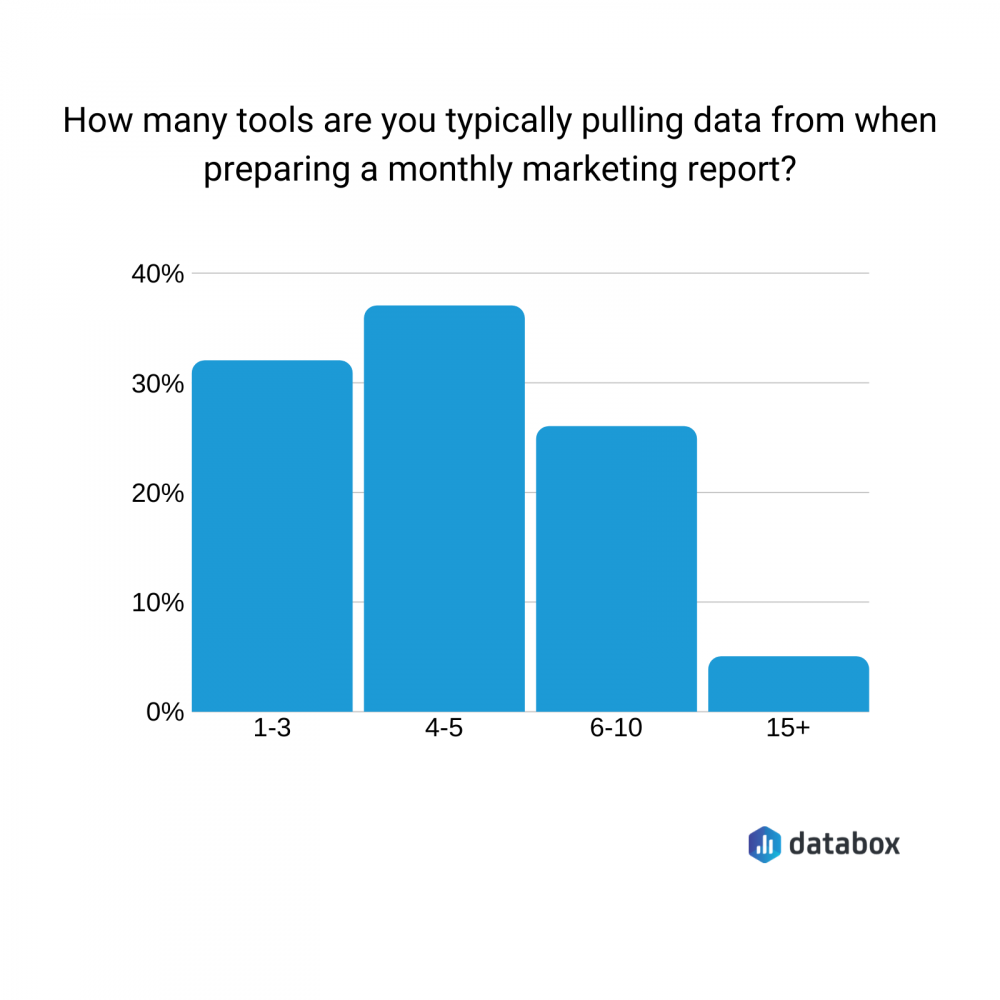
They typically spend less than a day creating the report:
Directors, CEOs, and Founders want to see that their marketing spend is paying off. They want to know that you’re using budget wisely and creating campaigns that actually impact the bottom line.
What they don’t always want is a 20-page document that just lists KPI after KPI.

What Should My Monthly Marketing Report Include?
You know what bosses don’t want to read in a report.
So, what should you include? And is there anything you should avoid when putting together a monthly report?
In this guide, 39 experts share the metrics they actively track in their marketing dashboards and they always include in their monthly marketing report, including:
- Organic traffic
- Branded vs. unbranded traffic
- Traffic by source
- Average session duration
- Qualified lead score
- Contact conversion rate
- Total conversions
- Cost per lead
- Leads by source
- MQL to SQL conversion rate
- Customer acquisition cost
- Sales velocity
- Retention vs. acquisition
- Marketing spend
- Return on investment
- Alexa Global Ranking
- Brand mentions
- Number of backlinks
- Analysis and comparison
*Editor’s note: Need help putting together your monthly marketing report? We’ve got hundreds of templates that sync with popular marketing tools such as Google Analytics, Search Console, and HubSpot–all of which can be shared with your team at monthly meetings:
1. Organic Traffic
“This represents the number of website visitors finding your site on their own without any paid efforts,” Breazy‘s Stuart Leung explains. “This metric is corresponded with how successful your SEO strategy is.”
Brian Robben of Robben Media adds: “Without [organic traffic], you always have to pay the piper for paid advertising.”
“With it and ranking on the 1st page of Google for services or products your company offers, now not only do buy-now customers spend their money with you, the prospects who aren’t looking to buy but browse, will still find your website and get comfortable with your brand, opening up future sales opportunities.”
Robben adds: “We’ve made millions of dollars for our clients and ourselves on the back of organic traffic.”
Sean Francis of Blue Magnet Interactive summarizes: “Marketing is about positioning products and services in front of potential customers and traffic (sessions, new-users) is the lynchpin of everything. If no one is reading your brilliant copy, then your brilliant copy isn’t doing its job.”
2. Branded vs. Unbranded Traffic
Organic traffic tells you how many visitors are coming to your website from search engines like Google.
You can filter this even further, breaking it down by:
- Branded traffic: Including your brand/domain name (e.g. “Databox marketing tips”)
- Unbranded traffic: Not including your brand/domain name (e.g. “marketing tips”)
Andrew Guh of Online Hikes thinks: “You should focus on the amount of organic traffic that comes from branded searches. For example, when someone types the name of your company in Google. The more searches like that – the better.”
However, Sam White says: “Unbranded traffic to service pages is an important metric [Del Mar Jiu-Jitsu] monitor each month. This gives us the clearest insight on the impact of our SEO efforts.”
“All the keyword rankings are great along with traffic to blog posts but ultimately, unbranded traffic to our service pages tells us how rankings are translating into new business.”
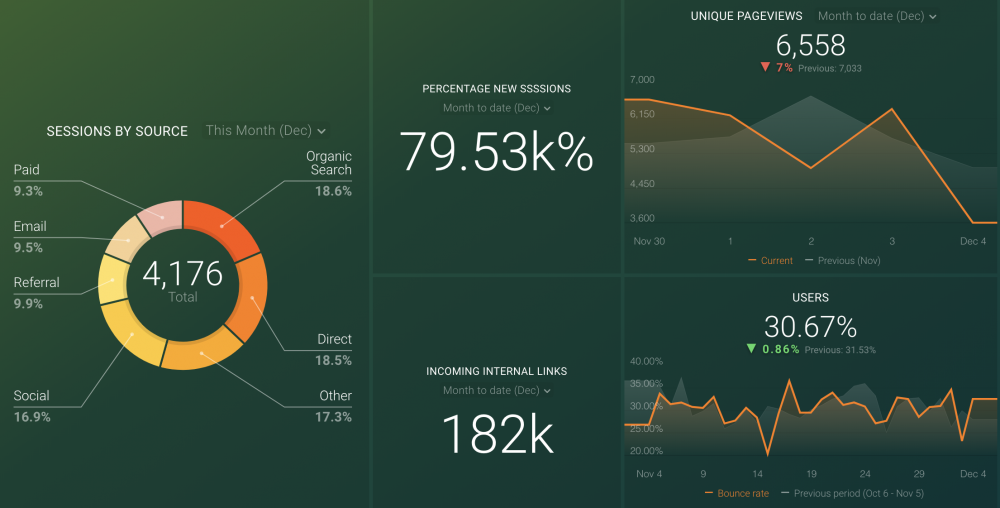
3. Traffic by Source
“Every monthly marketing report should include top traffic-driving channels,” says SyncShow‘s Jasz Joseph.
“Most robust marketing teams are working on a variety of things – SEO, social media, email, etc. It is important to see which of these efforts is driving the most/least traffic to your website so you can invest time and money accordingly.”
Ryan Scollon adds: “It’s very easy to look at the overall figure of traffic or conversions for that month and see if you have made progress. But in the finer detail, it could be that one source of traffic tanked and another skyrocketed. It’s important to separate them and review them individually.”
Kevin Olson says the team at Capitol Tech Solutions “include this in all of our marketing reports because it shows where site visitors are coming from (direct traffic, paid search, organic search, referral, social, etc).”
Tom Pick of Webbiquity puts this into practice: “For example, if the growth is being driven by non-brand search traffic but direct visits are stagnant, that may indicate you need to put more effort into brand-building, thought leadership, and media relations.”
Use this marketing automation dashboard to monitor and optimize your traffic sources.
4. Average Session Duration
According to Brooke Logan of Sagefrog Marketing Group, “average session duration is super important to see if end-users getting to your website are behaving the way you want them to.”
“You can get all the traffic in the world, but if an end-user isn’t staying on your website long, something probably isn’t right.”
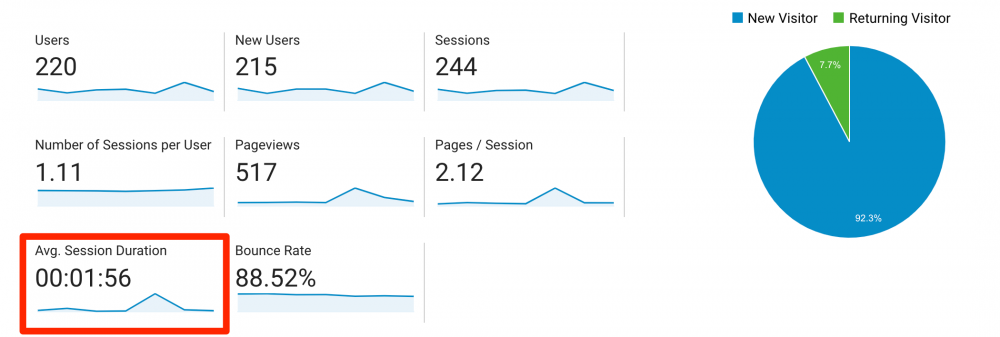
Anand Iyer agrees, and thinks “every MONTHLY marketing report should include [average session duration] because it is a great indicator to find how engaging your content is, how long users spend on your website and find ways to improve UX and UI on low performing pages.”
PRO TIP: How Are Users Engaging on My Site? Which Content Drives the Most Online Activity?
If you want to discover how visitors engage with your website, and which content drives the most engagement and conversions, there are several on-page events and metrics you can track from Google Analytics 4 that will get you started:
- Sessions by channel. Which channels are driving the most traffic to your website?
- Average session duration. How long do visitors spend on your website on average?
- Pageviews and pageviews by page. Which pages on your website are viewed the most?
- Total number of users. How many users engaged with your website?
- Engagement rate. Which percentage of your website visitors have interacted with a piece of content and spent a significant amount of time on the site?
- Sessions conversion rate. How many of your website visitors have completed the desired or expected action(s) and what percentage of them completed the goals you’ve set in Google Analytics 4?
And more…
Now you can benefit from the experience of our Google Analytics 4 experts, who have put together a plug-and-play Databox template showing the most important KPIs for monitoring visitor engagement on your website. It’s simple to implement and start using as a standalone dashboard or in marketing reports!

You can easily set it up in just a few clicks – no coding required.
To set up the dashboard, follow these 3 simple steps:
Step 1: Get the template
Step 2: Connect your Google Analytics account with Databox.
Step 3: Watch your dashboard populate in seconds.
5. Qualified Lead Score
“As a B2B company, the most important thing for our marketing report to include is the number of contacts we’ve had during the month and the stage that they are at in the sales process compared to our spending,” says Caroline Scholten of Chocolate Films.
“To us it’s very important to see the relationship between our marketing efforts and the contracts we get with clients.”
MonetizeMore‘s Kean Graham also thinks: “Every marketing department should score each type of their leads and accumulate the score each month if they’re in B2B. If they have a short sales cycle and are B2C, it’s still useful to score sales to gauge the chance they’ll be a return buyer.”
6. Contact Conversion Rate
“While there are dozens of valuable metrics a marketing professional could include, I would say that one that should definitely be included in a monthly report is contact conversion rate,” Morey Creative Studios‘ Joseph Whearty.
“In other words, the percentage of people that gave their contact information to a brand as a result of marketing efforts.”
Whearty explains: “This metric is important because it’s like checking the temperature of a marketing campaign. A low conversion rate suggests that, even if reach and engagement are high, audiences did not feel compelled to take the next step in their buying process.”
“As a brand, this is an excellent way to assess what you’re getting for your marketing dollars, especially if it’s primarily your sales team that brings leads across the finish line as customers. As a marketer, it’s a powerful tool for justifying your worth to company leadership or to your clients.”
“Naturally, this metric is most accessible for brands that base the majority of their marketing efforts on digital campaigns, as online behavior such as visits, clicks, and submissions are much easier to track and attribute to specific marketing initiatives,” Whearty adds.
7. Total Conversions
“The end of goal of your marketing should always be to influence sales or revenue be it directly or indirectly,” says Venngage‘s Aditya Sheth. “So it only makes sense you should track conversions or sales (by setting up goals in GA) to measure just how much your marketing activities are influencing the bottom line of the company.”
“The exact definition of a conversion will vary based on the platform/media used. But bottom line, it shows how effective your campaign or marketing is for your specific call to action,” 10x digital‘s Holly Rollins adds.
Lakeer Kukadia of Radon Media agrees: “Conversion metrics are something you should really focus while creating your monthly marketing reports. Because ultimately, clients are more interested in the metrics that affects their bottom line and propel their business forward.”
Conversion Hacker‘s Bobbie Lind adds: “Click through rates, open rates, conversion rates, and any other metrics pales in comparison. Because if a business isn’t making money on a campaign everything else doesn’t matter. And while sales matters on a MONTHLY level it should be a daily driver as well.
“You could have a giant website that attracts millions of visitors a month, but if your conversion rate is zero, there is not going to be any new business generated from that traffic,” says Weirdert Group‘s Jonathan Stanis.
“Similarly, you could have a site that only gets 1,000 visits a month, but if 20% of those convert, that’s 200 leads to fill your marketing and sales funnel and add to the bottom line.”
Summarizing, Upgrow‘s Ryder Meehan says: “This the end goal for every marketing program. Whether rank, impressions, or clicks are up or down, it doesn’t matter nearly as much as conversions (i.e. orders, leads, signups, etc) or revenue for an ecommerce site.”
8. Cost per Lead
“To have a successful and thriving business, you want to make sure that your metrics are improving month after month,” writes Jonathan Aufray of Growth Hackers.
“Generating leads is crucial for any business and, therefore, tracking your cost per lead (CPL) is essential. You want to make sure your CPL is decreasing, meaning that your acquisition channels are being optimized and your conversion rate is getting higher.”
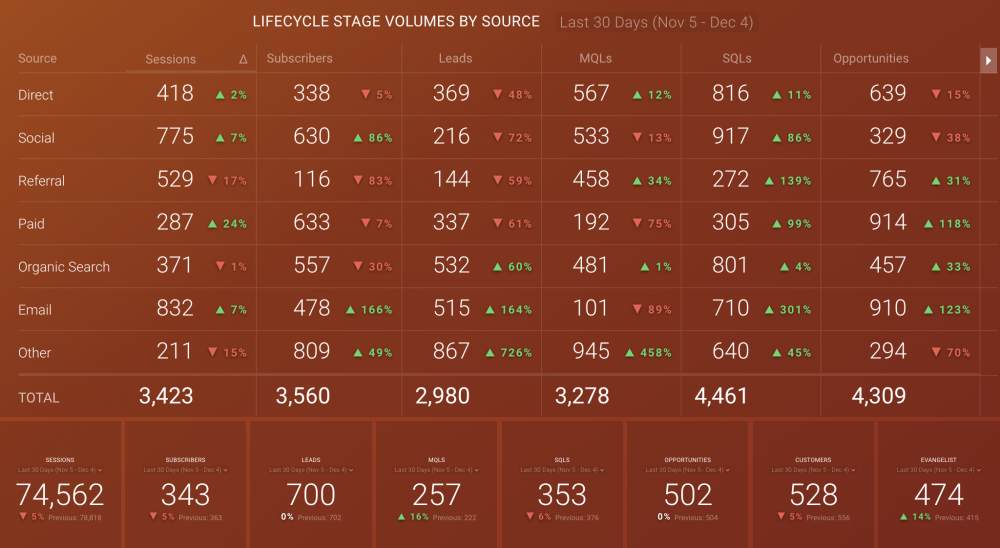
9. Leads by Source
It’s not just the volume of leads you should be including in a monthly marketing report. According to Heather Baker of TopLine Film, “it’s essential to look at leads generated by source so that you can see which of your marketing efforts are yielding results.”
“We break ours down into PPC, organic search, client referral, repeat business from current client and other.”
Perfect Patients‘ Randi Grant adds: “We typically have several campaigns and strategies running at the same time, so being able to see from month to month which ones are generating the most leads helps us learn what’s working, what’s not, and how to plan future marketing campaigns.”
*Editor’s note: Do you use HubSpot to monitor your marketing campaigns? View where your leads are coming from with our HubSpot Sources Report dashboard. You’ll be able to see which marketing channel brings the most leads and opportunities:
10. MQL to SQL Conversion Rate
There are two types of lead you’ll be working with in a business:
- Marketing Qualified Lead (MQL): A lead that fits the mold of a target customer, such as location, age, or gender.
- Sales Qualified Lead (SQL): A lead that’s spoken with a sales team who are confident they’re ready to purchase.
“The performance of your sales team will be judged (in part) by the rate of leads generated to sales converted,” says Rajat Chauhan of TutorEye Inc. “After all, it’s sales that keep the lights on.”
However, Chauhan thinks that the MQL to SQL conversion rate ratio “will help to determine if your sales department needs to implement any changes to their strategy.”
Trina Moitra of Convert.com also recommends breaking down your MQL to SQL conversion rate by source: “We track “source” as the origin of traffic and “conversion touchpoint” as the form that got us the actual lead.”
“This yields a matrix that shows us the best channels to invest our marketing dollars in… and go straight after the initiatives that get us the revenue.”
Related: 11 Ways to Improve Lead Quality According to 40 Marketing & Sales Experts
11. Customer Acquisition Costs (CAC)
Quincy Smith says that “CAC or cost of acquisition is huge for [Ampjar] – we want to see how each channel is performing in terms of leads and conversions and we obviously want to see that number get lower.”
“Month to month is perfect here because it allows us time to adjust and start new campaigns vs week to week which is far too frequent for most teams.”
theotherstraw‘s Lennart Meijer agrees: “Reporting on this on a monthly basis will provide you with information on what marketing tactics are going to be sustainable when acquiring new customers.”
12. Sales Velocity
QuarterOne‘s Richard Mann explains that sales velocity is “the value of new deals closing per month calculated as (a) leads per month (b) conversion rate and (c) average deal value.”
“Sales velocity isn’t solely the responsibility of the marketing team, but marketing have an important role in not just the lead-gen part but also supporting the process of converting leads to won deals.”
Mann adds: “An understanding of sales velocity is critical for effective marketing and can really help align marketing efforts with the rest of the business – in particular sales and finance.”
13. Retention vs. Acquisition
“Every marketing report should include a metric on user retention vs. user acquisition,” says Hexe Data‘s Krzysztof Surowiecki.
“It is important to know whether we acquire users or not, whether users coming back to us, when, after what period of time. It is also worth verifying the context of their shopping behavior. Thanks to it, we can optimize our marketing actions more efficiently.”
You might need to use tools like Shopify or HubSpot to find this. That’s likely why most marketers use 4-5 data sources to create their monthly marketing reports:
14. Marketing Spend
The average marketing budget is 7.5% of a company’s annual revenue.
Chloe Thomas of eCommerce MasterPlan advises tracking “how much money you paid for the traffic, and how much time you and your team spent managing the marketing to get the traffic.”
“If you don’t review how much traffic costs you alongside how much it does for you you can’t improve future performance effectively.”
15. Return on Investment (ROI)
Once you know how much you’re spending on marketing, Will Hatton of The Broke Backpacker thinks: “It’s essential to see that your marketing is working and that you are receiving more than you are paying out, else you are just throwing your money away.”
“Without revenue above costs, a business will fail pretty quickly. It also helps spot channels that are working and ones that are not. You can then reallocate funds to the proven channels to increase your ROI.”
Brendan Hufford of SEO for the Rest of Us adds: “Far too many marketing reports focus on views, impressions, etc. when every report really needs to answer the question, “What are we paying you for?”
Editor’s note: Would you like to share dashboards and discuss performance directly in Slack? With Databox’s integration with Slack, you can see if your marketing is working and whether you are receiving more than you are paying out. Get started now.
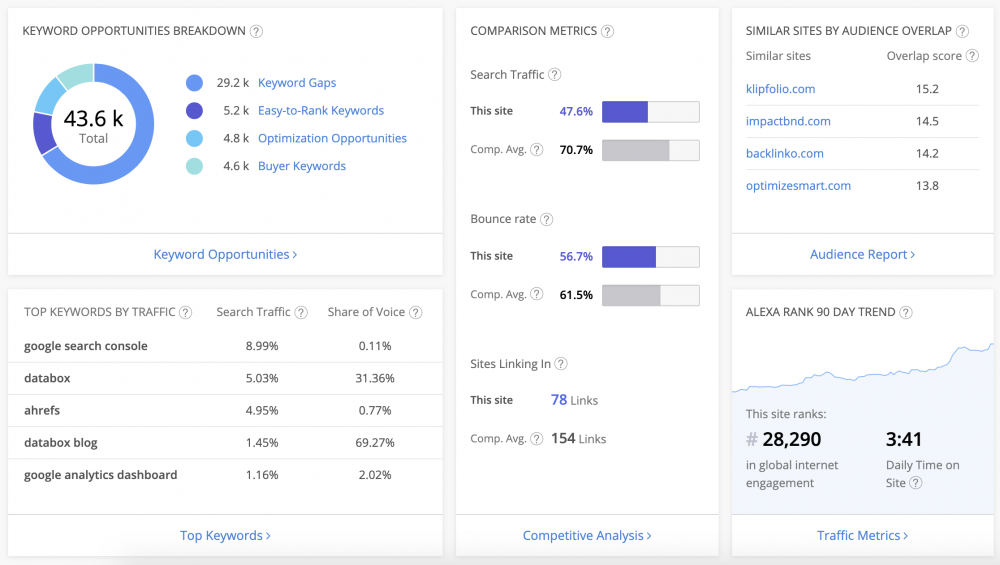
16. Alexa Global Ranking
“Alexa.com allows you to research your website and find its current local (country) and global ranking,” says Ramey Miller of Text Request.
“I believe that is important in every monthly meeting because it reflects on what has been done that month in comparison to the month before. It also serves as a source for knowing what is working or not for your website.”
17. Brand Mentions
“Every monthly marketing report should include outside mentions and discussions about your company,” writes Alexander Lewis of Paessler AG.
“What is the world saying about your tools, products, or brand? This involves finding mentions of your brand in traditional media and in social media and forum discussions.”
Lewis continues: “Understanding how the world is talking about your company helps your brand stay ahead of bad publicity, poor reviews, or misinformation about your organization. It also lets you connect and form deeper relationships with consumers and reporters who are already speaking highly of your company.”
18. Number of Backlinks
Chances are, your SEO team is working to build new backlinks to your site.
Michelle Ngome’s team at Sutliff & Stout does, which is why they “include our total number of backlinks each month. We are able to determine if we hit our goals and recognize trends.”
*Editor’s note: Keep track of the links you’re building to your site each month with our Link Analysis dashboard. You’ll be able to see incoming internal links, along with how many unique users they drive to your site:
19. Analysis and Comparisons for Each Metric
“In B2B marketing, a monthly report should go beyond just the numbers and include detailed analysis into the new leads generated in the month,” says Colton De Vos.
“At Resolute, we often include a timeline of how the lead was generated and where it made it to in the marketing / sales process. That way we get a full picture view by tying together data from Google Analytics, conversion tools (forms, live chats, outreach), and CRMs for tracking customers and opportunities.”
De Vos continues: “This gives us a summary of new opportunities and a month-to-month view of how qualified leads are coming into the business so we can optimize our efforts to cater to these opportunities.”
SEO Hacker‘s Sean Si agrees: “The monthly marketing report should include comparisons between the data gathered. This ensures that you are gaining traction based on the marketing efforts you have implemented.”
“Having monthly progressions or comparisons will also help you see where else you can work hard on.”
However, Noah Parker of The Influence Agency says: “A key mistake that not only marketers make, but also a key flaw with most automated reporting software, is that they default to month-to-month reporting comparisons or week-to-week reporting comparisons.”
“While this data may be important to a business, reviewing data from such a small data sample does not account for anomalies in user or consumer behavior, seasonality and how it affects buyer habits, as well as a number of other variables that can affect one’s business ranging from weather to economy.”
“Therefore, it’s essential that marketers observe and analyze Year-Over-Year monthly data, or of a period of 3,6, or even 12 months Year-Over-Year, in order to assess a bigger picture of data and how a marketing campaign has fared through a few or many of the aforementioned variables that can affect one’s business throughout the year.”
Say goodbye to boring monthly marketing reports that nobody actually reads, and hello to a report that tells your team what they need to know.
Make sure you include the KPIs you track with your marketing dashboard software in your report and not only will you be able to spot what you’re doing well, but you can find problems before they become a major issue.
Can’t stay on track with your company’s performance? Instead of waiting for a reporting meeting, create a custom KPI scorecard now and stay in the loop wherever you are and whatever you do.


