


Table of contents
Most companies are sitting on a mountain of useful product, sales, and customer data. However, just because you have the data doesn’t mean it is being utilized well.
Sure, you might be tracking some of this data in a spreadsheet and maybe you are creating a report once a week or so.
While that’s better than nothing, you are not using this data as well as you could be. You are simply reporting on basic observations.
A better approach is to turn this raw data into actionable insights that your company can use.
In this post, we’re taking a closer look at what data insights actually are as well as some best practices for extracting insights from data.
What Are Data Insights?
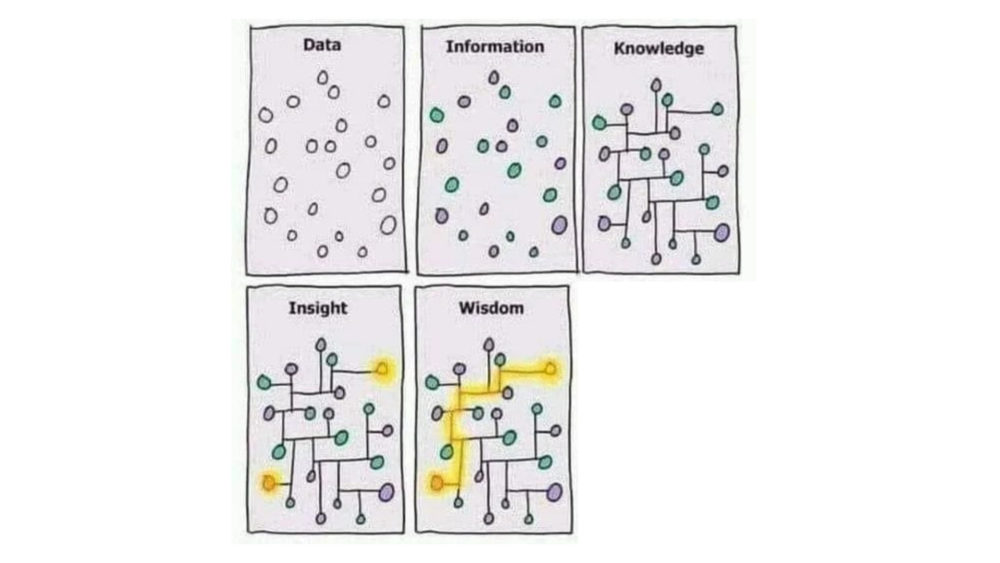
Before you can understand data insights, you first need to know what data actually is.
Raw data is simply a collection of facts, usually in the form of numbers.
Analytics is the actual process of analyzing raw data to look for patterns and trends.
And, data insights is the process of turning your findings into actionable feedback you can use to improve your business.
We can say it looks similar to something like in this image:
So, when we surveyed 40 people to ask about how they used data, it is no surprise that nearly 88% said they use it to extract actionable insights.

And it’s interesting to mention that the process of mining the raw data and then turning them into actionable insights (as opposed to basic observations) does come with a tradeoff. It is harder to pull off and takes more time.
Why Are Data Insights Important?
The biggest reason why data insights matter is it allows you to make better business decisions. This can be everything from the macro-level decisions around business revenue, profits, and cash flow to micro-decisions around which ad campaign to run with.
Related: How to Analyze Data: 30+ Experts on Making Sense of Your Performance
10 Tips for Pulling Insights from Data
It is easy to get overwhelmed when it comes to analyzing data. So, here are tips to make the process of pulling actionable data insights simpler.
- Start with the question you are trying to answer
- Establish a repeatable process
- Make sure your data is credible
- Convert numbers into visuals
- Look for patterns and trends
- Don’t confuse correlation with causation
- Account for historical data and trends
- Pool relevant data
- Make it easy for other departments to access the data they need
- Invest in a data visualization platform
1. Start with the question you are trying to answer
Data is only as useful as the question you are trying to answer. Many newbies skip the question step and dive right into the data. That’s a mistake. You should use data to answer your existing question
Aurore Legentil of Synthesio explains, “Uncovering actionable and meaningful insights from data is all about methodology.
First, start with a specific business question (how does my audience feel about my last product launch? What content type has the highest engagement with my audience?), then use human AND machine intelligence to find the answer.
Our best tip: Combine human intelligence and machine intelligence to get insights that are accurate and actionable. Advances in machine learning have made it possible to decode the true meaning of data and human language. But, to ensure relevance, you need human expertise to not only manage the technology, but also bring an understanding of user-generated content, cultural nuance, and local context.
Human-machine teams deliver scale and speed – and ensure insights are accurate and ethical. This is why a hybrid approach to AI-enabled consumer intelligence that combines expert teams and AI-powered technology is best suited for today’s brands that need to make fast, confident decisions.”
Even with a solid methodology, interpreting results can still slow teams down, especially when questions require pulling context from multiple reports. Instead of manually stitching that information together, many teams use AI data analysts, like Databox MCP, to ask plain-English questions about performance changes and get answers grounded in their real metrics, definitions, and historical data. This makes it easier to understand not just what happened in the data, but why it happened, so insights can move from analysis to informed action.
Sam Cambell of Reddiquette adds, “Data is everywhere, and it has the power to give you insights about your business. Whether you are looking for information on how many customers have purchased a product or what marketing campaigns are most effective at generating leads, data can tell you. However, this data isn’t always easy to understand. Here are some tips for making sense of your data and getting real insights from it.
- Define your problem using data, user stories, or any other relevant inputs.
- Find data-driven insights in the form of patterns, groups, segments to answer this problem question while factoring out variables that are not important to answer your question for this context while optimizing for the variables that matter most while accounting for external factors which could disrupt or skew results.
- Present findings with facts and figures to support them in whatever format best serves your readership needs, be it through charts & graphs formats or text & textual content formats, depending on what they’re looking for help with solving – either readability challenge engagement vs accessibility analytics observability problem domain complexity depth issue recency timeliness topical relevance being offered help with or a combination thereof depending on what they’re looking for help with solving..
- Continually Improve the process of moving from step 1 to step 3 by incorporating feedback loops into your workflow and create a data-driven insights process that employs best practices in how you derive insights from data, including when to use certain algorithms best suited for particular scenarios, which datasets are best for answering certain types of questions, what level of granularity data should have to solve for a given problem – all the way down to how you structure your question being asked in the first place.
- Repeat steps 1-4 iteratively over time to continually improve upon your data-driven insights offering and make it increasingly valuable to those you’re serving.”
2. Establish a repeatable process
Another reason why you should start with a question and have a methodology is that it makes it easy to turn this into a repeatable process. This is not only more efficient for you and your team, but also leads to more accurate data collection and analysis.
For example, Admir Salcinovic of PriceListo says, “At PriceListo, we follow a 5-step process to derive insights from business data. Data cleaning, establishing relationships and trends, statistics calculation, and building advanced analytics models constitute this process.
Data cleaning simply refers to removing duplicate records and finding missing values in newly collected data.
After this is done, we proceed to establish relationships between data points by displaying them in different ways like plotting two variables against another in a graphical representation. Tables also perform huge roles in this aspect.
Once the graphical representation of variables is produced; calculating statistical metrics like mean, median, mode, and standard deviation provide a clearer understanding and a means of comparison of business data provided.
Advanced analytic models are then built using the derived information through tools like decision trees, regression, clustering, and so on. Different models built provide new observations which can help business managers make decisions moving forward.”
Related: Google Analytics Data: 10 Warning Signs Your Data Isn’t Reliable
3. Make sure your data is credible
You also need to make sure your data is clean and accurate. This is often easier said than done though.
Ben Herzberg of Satori says, “To derive insights from data what I think is necessary is the following:
- Having interesting data. That’s pretty obvious, if your data doesn’t have enough depth, you will not be able to get good insights from it. That means that sometimes you need to enrich your data or add to the data from other sources (for example, having marketing data, but augmenting them with web telemetry data of user actions).
- Having trusted data. If you can’t trust the quality of your data, you may be doing worse than not being able to derive insights. You may be getting the wrong conclusions and your insights may be faulty.
- Being able to access and process the data, fast. To be able to get valuable insights, in most cases there is some time sensitivity. That means that your organization should be able to make the data you need accessible to you within a reasonable time, and you should be able to apply analytics (or models) on it as fast as possible.
- Applying domain knowledge. In most cases, the best insights are drawn where domain experts are in the room (or the zoom). That means that, as an example, a customer success manager may know of great questions that a data analyst alone will not think of out of the box. This is one of the reasons why it is important to enable more people from your organization to consume data and analyze it.”
4. Convert numbers into visuals
The way you present the data matters. It is easier to tell a compelling story if the data is displayed in graphs, charts, and other visual elements as opposed to a wall of numbers.
“Convert everything into visuals rather than numbers,” says Austin Fain of Perfect Steel Solutions. “How does this help? That’s easy – a person can quickly spot different trends and patterns in visually represented information rather than numbers which can seem a bit overwhelming. Therefore by simplifying numbers into charts, graphs, infographics, it is very easy to gain insights from data. I usually use dashboards, which convert the information into easily readable bar charts and graphs. Not only does this make the work more interesting, but also more useful and fun!”
Pro Tip: Your Go-To Dashboard For Doing a Deeper Dive on Website Traffic and Conversion Sources
Struggling to find an easy yet effective way to gain a comprehensive understanding of your traffic sources, user behavior, and revenue generation?
You can do all that and more with our plug-and-play GA4 Acquisition dashboard template:
- Understand user acquisition: See where users come from, tailor outreach, and track new user growth;
- Focus on high-performing channels: Identify top channels, optimize resource allocation, and adjust underperformers;
- Track revenue & engagement: Monitor revenue growth, active users, and the effectiveness of your campaigns;
- Go beyond traffic & conversions: Gain deeper insights into demographics, sales, customer journeys, ARPU, and more;
- Optimize marketing & drive results: Make data-driven decisions to improve your marketing strategy and achieve business goals.

You can easily set it up in just a few clicks – no coding required.
To set up the dashboard, follow these 3 simple steps:
Step 1: Get the template
Step 2: Connect your Google Analytics 4 accounts with Databox.
Step 3: Watch your dashboard populate in seconds.
5. Look for patterns and trends
The quality of your data insights lies in both the data you collected (is it credible and accurate?) and the patterns you can extract from it.
“Extracting insights from data is a core process for any business,” says Dan Ni of Messaged.com. “The quality of your insights depends on how well you extract them. It is no secret that it has a learning curve to it but through a lot of trial and error, we found the best approach to do so.
In our case, we employed the use of an appropriate tool such as Google Analytics to help us make this process smoother and the best practice we learned from our experience was that we used to look at the data randomly rather than looking for a specific pattern or trend to better understand if we have upwards growth or the opposite. Hence always look for correlations in your collected data to better assess future situations.”
Donna Duncan of B-SeenOnTop adds, “Look for patterns and anomalies. Ask why. Answers frequently surface problem areas that need to be addressed and missed opportunities to generate more awareness, understanding, and demand for your goods and/or services.”
6. Don’t confuse correlation with causation
However, one caveat is to make sure you aren’t confusing data correlation with causation.
“To maximize insights derived from data, you MUST understand what the data is telling you,” says Tyler Specht of SquidCrate LLC. “Correlation is not causation, and if you don’t fully understand the metrics you are using, you can easily assume rather than predict.
To allow the data to be valuable to your organization, understanding what the data means is critical.
If you were to look at the impression of an ad, you should have an idea of how many impressions it typically takes to get a conversion. Then you can take a look at your CPM and derive a strategy to lower your costs.
The same idea populates in our ecosphere. What does the data mean and how can we maximize results? To do so without statistics backing your research, you need to understand the goal of the placement and the scope of the change. Did we make a positive difference in this area of the organization when we implemented this strategy and did we accomplish the goal(s) we set out to hit?”
7. Account for historical data and trends
If you have any historical data, reviewing this can often be extremely helpful in predicting future trends.
“Understand the impact of historical trends,” explains Craig Hewitt of Castos. “A common mistake for business owners is to look at a slice of data and draw conclusions without taking into account historical trends. We analyze historical data to derive insights into how our business has reacted to economic cycles, seasonality, and market trends. Through understanding and referencing historical trends, our data can tell us a more coherent story.”
Related: A Beginner’s Guide to Historical Blog Post Optimization
8. Pool relevant data
Another mistake that people make is using a single data point or a vanity metric to inform a larger trend.
“To pull insights from data effectively, use them in conjunction with each other,” says Gregory Yong of Convincely. “Data used in isolation rarely tells the full story, and if you want to make truly accurate observations, you need to pool together multiple metrics. For example, your bounce rate might be artificially high in a given month, and this could be cause for concern. However, data might also point to numerous server outages which left your website offline frequently. This tells you that consumers aren’t losing interest in your product; rather, they’re finding it difficult to access. You can use these observations to confidently rectify the problem rather than mistakenly investing your time and resources elsewhere.”
9. Make it easy for other departments to access the data they need
Just like you shouldn’t make decisions based on a data point in isolation, you also shouldn’t silo off data in your company.
“Using a self-service data analytics platform has been a gamechanger for our team, mainly because it allows users from any department to choose the data and metrics they want to analyze without needing any coding experience,” says James Diel of Textel. “ In the past, getting the IT team to gather the data into a form we could understand cost us a load of time. Now, with the use of reporting software anyone can build an analytics dashboard and report with the click of a few buttons.”
10. Invest in a data visualization platform
One way to make your data more accessible in your company is to use dashboards or other data visualization platforms.
“My best tip for pulling insights from data is to use a good data visualization platform,” says Daivat Dholakia of Essenvia. “Simply looking at a pile of numbers on paper will be incredibly difficult to sort through and derive insights from, not to mention it will be unnecessarily time-consuming. A data visualization platform allows you to actually see trends and patterns.”

Improve Data Analysis with Databox
To recap, data is a collection of numbers and facts. Analytics is what you can do with this data. And, insights are the actionable takeaways you are going to implement.
One of the best ways to turn more raw data into actionable data insights is to present the data in a way that’s accessible to your entire team (and ideally the entire company).
That’s where using software, like Databox, can come in handy. You can pull in data from hundreds of direct integrations and build actionable dashboards quickly. You can also set up scorecards and alerts to get regular updates and act on trends earlier. Start a free trial here.


