


Table of contents
Did you know there are more than 455 million websites on WordPress?
And, tens – if not hundreds of millions have active blogs.
With so much content being created every day, how do you ensure that your content stands out?
Well, one way is to measure content engagement. By measuring content engagement you can see how your content is trending over time. But which metrics are the right ones to track?
Let our experts help you! We have surveyed dozens of experts and asked them to share which metrics they keep their eyes on.
In this post, you will learn:
- What is Content Engagement?
- What are the Most Common Content Engagement Metrics
- 30 Metrics to Measure Content Engagement

What is Content Engagement?
Content engagement is a broad term that measures whether or not visitors are taking your desired action.
This will vary based on the type of website and where this content lands in your content marketing funnel – top, middle, bottom, retention + upsell.
What are the Most Common Content Engagement Metrics?
There are dozens of metrics you can use to track content engagement. However, what you choose to measure in your content marketing dashboard will vary depending on your audience and specific goals.
Ben Johnston of Sagefrog Marketing Group says, “It depends what your goal is with the piece of content; if it’s to rank highly (which it usually is), then new users and overall traffic is a great way to monitor how effective it is. “
“If you are offering a beefy educational resource, then average session duration would be a great metric to show that users are engaging with your page.”
“If you want to test how well a piece of content fits into your internal linking structure, look at the behavior flow report in Google Analytics to see where users navigate to, or if they drop off the site entirely.”
30 Ways to Measure Content Engagement
So, here are 30 different ways that marketers are keeping an eye on how engaging their content is.
- Bounce Rate
- Average time on page
- Scroll depth
- Time on page in conjunction with scroll depth
- Conversions
- New leads
- Appointments booked
- Sales qualified leads (SQLs)
- Email signups
- Email open and click-through rates
- Pageviews
- Number of new people reached
- Custom events
- Site visitors
- Pages per session
- Percentage of traffic from search
- Percentage of traffic from social media
- Revenue
- Social shares
- Average time on site
- Positive visitor feedback
- New Linkedin connections
- Backlinks
- Assisted conversions
- Referring domains
- Impressions
- UTM campaigns
- Average dwell time
- Average session duration
- Comments
PRO TIP: How to track these 10 popular Google Analytics 4 metrics
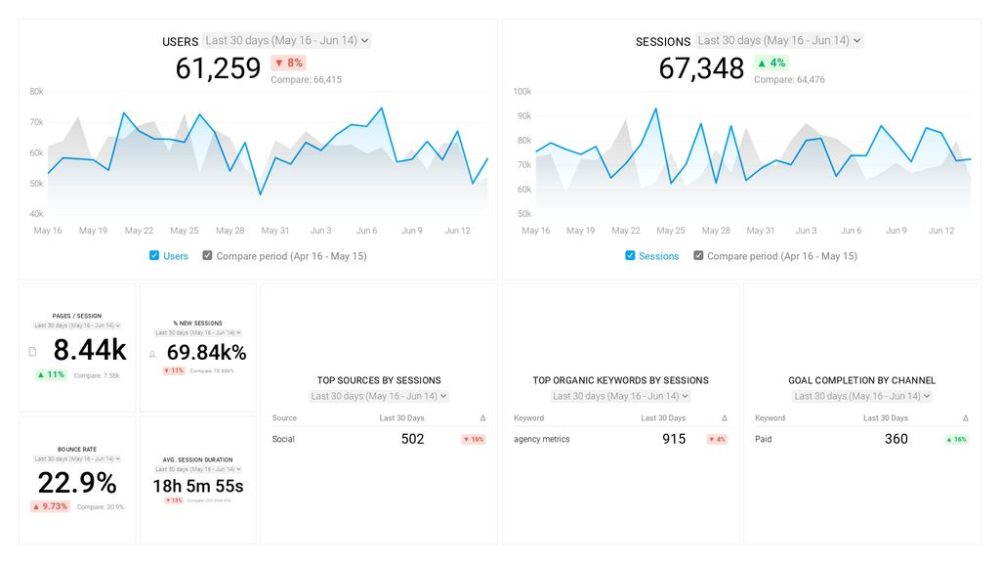
Sure, there are dozens (and dozens?) more Google Analytics 4 metrics you could track. But, starting with these 10 commonly tracked metrics will give you a pretty high-level view of how your marketing is working…
- Sessions: The number of sessions can tell you how many times people are returning to your website. Obviously, the higher the better.
- Sessions by organic keyword: Which organic keywords bring in the most traffic to your website? This may help you determine whether your SEO investments are paying off.
- Bounce rate: Do visitors leave shortly after landing on your website? Or do they stick around?
- Average session duration: How much time are people spending on your website? Users with a high average session duration are most likely relevant to your company.
- Goal completions: How many users responded to your call to action?
If you want to track these in Google Analytics, you might find the visualizations limiting. It’s also a bit time-consuming to combine all the metrics you need in one view.
To better understand how your website performs in terms of traffic growth and conversions, we’ve made this plug-and-play dashboard that contains all the essential metrics for understanding how successful you are at optimizing different aspects of your website.
You can easily set it up in just a few clicks – no coding required.
To set up the dashboard, follow these 3 simple steps:
Step 1: Get the template
Step 2: Connect your Google Analytics account with Databox.
Step 3: Watch your dashboard populate in seconds.
1. Bounce rate
“Bounce rate,” says Katrina Dalao of Referral Rock. “You may get a lot of impressions and click-through rates, but if people are only spending a few seconds on the page, you might not be getting the type of engagement you’re looking for.”
Michelle Alese of Kantaloupe says, “Inordinately high bounce rates are a great way to spot content that doesn’t closely match reader search intent. This is an indicator that the piece of content at hand may need to be updated or rewritten, in order to provide the best answers to reader’s questions.”
Amelia Whyman of Global App Testing adds, “If the bounce rate is very high, with users only lingering on a page for a few minutes, we know they are not engaged. A low bounce rate shows that your content has captivated the attention of your users.”
“Bounce rate is incredibly telling of if your content effectively grabbed the user’s attention immediately,” says James Watson of Omaha Homes For Cash. “If you are able to keep your bounce rate low, all your other metrics (such as time spent on page) will improve. Keeping users’ attention and interest is always my number one focus. After all, what good is your content if your viewers don’t ever see it?”
For example, Paige Arnof-Fenn of Mavens & Moguls says, “I started a global branding and marketing firm 19 years ago and content marketing success isn’t just about getting people to your site; it’s also about keeping them there.”
“If people are spending time on your site, or even coming back, then you know your content is working and you’re well on the way to generating leads and sales from your content. If people leave within a few seconds, you’ve got a problem.”
“But if your analytics data from your marketing dashboard software shows they are reading to the end, and even checking out other content or subscribing to your newsletter, then you know that content is successful.”
“Measuring the way your website visitors interact with your content is a good way to make sure you’re attracting the right traffic. I recommend you look at your bounce rate as the key metric because engaged visitors will spend more time on your site and view more pages if they’re interested in what you have to offer.”
2. Average time on page
“A good metric to measure the engagement of content is the amount of time a user is active on a page,” says Ajmal Dar of MoccasinGuru. “This means the time they are moving their mouse, scrolling or clicking on a specific page.”
Ciaran Bruder of Realm of Film says, “This means eyes on words, which is the purpose of writing. And if the screen is just left open with very little info skim read, it still shows an intention to read!”
Georges Petrequin of Contentbulb adds, ”Average Time on Page is a key metric to see how engaging our content is. We could have thousands of page views, but if the Avg Time on Page is low, the content clearly isn’t what visitors expected. If we see people are spending (on average) several minutes on our blog posts and articles, we know it must be what they’re looking for.”
Catriona Jasica of Top Vouchers Code agrees, “Having an insight into how much time a user spends on the page you’ve shared your content on helps you to get a vague review of your piece. You can see the average time spent on a particular page and not the whole website.”
“If the time spent is too short, you get to know that your content wasn’t able to grip the attention of the customer and that you need to work on it. However, if a consumer has spent a specific time on your page which was exactly how much time it would have taken to consume your content, it might depict that you succeeded in having the user hooked.”
For example, Liat Behr of Ink of Imagination says, “I find the amount of time users spend on a webpage to be an important indicator. Understanding where users are spending their time on my site provides me with insights on what they find important.”
“This in turn puts me in a better position to help them meet their needs.”
Monitoring pages per session is particularly important for blog posts.
Sandra Chung of Mention says, “A good indicator that tells us if our blog content is resonating with our audience is time spent on an article. Most of our articles are 1500+ long, so if a person is spending 7-8 minutes on an article, that tells us it was fairly engaging to them.”
“Content is a massive part of my business and, so, of all of the metrics I use to measure performance, consumption is always at the top of my list,” says Jacek Zmudzinski of Future Processing. “More specifically, I rely on one major consumption factor – Average Time On Page.”
“The reason for this is that this gives me a really good idea of how engaging or interesting a particular piece of content is – quite simply, if people are spending a fair amount on the page it means that they’re reading the content and are interested enough to read to the end.”
“On the other hand, if the time spent is low it means that it’s not grabbing the reader’s attention. This helps me to know what kind of content to focus on in the future in order to build my following.”
Amanda Sexton of FocusWorks Marketing adds, “Looking at Google Analytics and seeing how much time is spent on a particular piece of content is a clear indicator for engagement.”
“If we have a piece that’s being highly shared but we’re seeing low time on page, it’s likely because either: 1. the topic needs to be more understandable or 2. they’re not finding what they need right away. Both of those are issues that can be fixed relatively easily.”
“If they’re spending a lot of time on a particular page, then we know that’s a piece that spin-off topics should be developed from.”
Rachel Blakely-Gray of Patriot Software, LLC agrees, “The main purpose of blog articles is to provide information to the user. So when we look at blog article metrics, we hone in on the average time on page.”
“Are users engaged enough with what’s written to spend a little time reading it, or do they click on an article, skim for a second, lose interest, and leave?”
For example, Sabrina Hamilton of FinanceOverFifty.com says, “I use Google Analytics to track various metrics of my blog. The one metric that signifies reader engagement to me is time on the page.”
Though many content creators are concerned with their bounce rate, this metric is not an effective measure of true reader engagement.
“The difference between 30 seconds and 5 minutes on a page is a huge indicator of the level of engagement each reader had reached before exiting.”
However, in some cases, the average time on page can be misleading.
Thorstein Nordby of Nettly says, “Most companies will report on the number of visits to a page or article, page views or time on page. The problem is that you don’t know if the visitors actually consumed the content. On top of that, time on page is often not accurate when using tools such as Google Analytics.”
“This is why you should use a “timer trigger” in Google Tag Manager to either record an event in Google Analytics if someone spent say 45 seconds (you choose the time) or use a custom conversion in your Facebook Ads manager.”
“You can go even further and follow the example of Kickpoint (https://kickpoint.ca/digital-content-marketing-analysis/) who made their own function that counts the number of words on the page and determines how long it will take to read.”
Related: 18 Plays for Tracking Your Content Marketing Using Google Analytics
3. Scroll depth
“Good scroll depth is an indicator to us that the content we’re producing is genuinely being well received, so it’s something we track using Google Analytics and a mixture of heatmap software.”
Alessandro D’Andrea of Clickable agrees, “I personally use the scroll depth as a metric to fully understand the engagement of a piece of content. Mixing together bounce rate, scroll depth, and time on page you can get a lot of quantitative data on how people read your content. It requires a bit of Google Tag Manager work to set it up, but once it’s done it repays you with amazing information.”
Keith Moehring of L2 Digital adds, “Using Google Tag Manager, you can log events in Google Analytics when visitors scroll a certain percentage of the way down a page. “
“For example, on a blog post, you can track an event when someone scrolls 33% of the way down the post, and then another for 50%, 75%, and then 90%. This is a great way to gain insight into how much of your content visitors are consuming. It can also help to improve the accuracy of bounce rate and time on page because the event is considering an interaction.”
4. Time on-page in conjunction with scroll depth
“I like looking at a combination of time and scroll,” says Elad Levy of Quiero. “Each is rather simple to measure on its own with built tags in Google Tag Manager. But when measured separately, it’s hard to tell who skimmed through your content or simply just left their PC on and when for lunch. A combined metric using both measures, e.g. over 50% scroll *and* 60 seconds, gives a much better estimation of actual interest in our content.”
Stavros Angelidis of Ebiz Tools adds, “Engagement is more or less related to relevance. Therefore for every case and depending on your industry and type of site (business, e-commerce, blog, or other) the metric is different.”
“For example, for business websites, the one metric that shows engagement is the time on page or time on page combined with scroll depth.”
5. Conversions
“We put vanity metrics like time on page or bounce rate aside,” says Denny Putsh of Hitting the Golf Ball.
“What counts for us is that people follow our call to action and sign up for a newsletter. So every piece of content is measured against how many newsletter signups it creates. Signups / Unique Users. People don’t signup for a newsletter if they are not engaged with the content. That’s the crucial insight here.”
Adam Crookes of Freshly Squeezed says, “It always comes down to the number of people that have clicked our call-to-action at the end of each content piece. Using Google Analytics, we’re able to track the number of people who click the call-to-action after reading a piece of content.”
Peter Thaleikis of Bring Your Own Ideas Ltd. explains, “Most content on commercial websites is ultimately written to convert: you aim to either collect email addresses for your mailing list, users for your free trial or customers to buy your e-commerce products.”
“So it makes sense to measure your content efforts end-to-end by counting the intended outcome directly. While it might be more challenging to track, it is more accurate and finally helps to make the right data-based decisions.”
For example, Ryan Dunagan of SPOTIO says, “Form fill – if possible every piece of content (blog, webinar, ebook, etc.) should have a soft call to action to gather information from the user and deliver additional value. Form fill signals to the marketer that the free content was so engaging and valuable that the user was willing to take the next step in the buyer’s journey and learn more about that particular topic.”
Vikram Tarugu of Detox of South Florida adds, “Conversion rates differ widely from industry to industry, but tend to generally stay about 2 and 3 percent. That said, if you are designing unique landing pages for particular markets, shoot for a conversion rate of around 5 percent, or even higher.”
Related: How to Create & Measure Your Content Marketing Funnel
6. New leads
“Inbound demo requests and mentions of content on calls/demos let you know that content is working,” says Tyler Burch of BoardActive. “Not on a reach level, but on a revenue and conversion level, which is infinitely more important.”
Jonathan Aufray of Growth Hackers Agency adds, “It can be difficult to actually measure the results of the content pieces you create. Let’s say you create an insightful blog post. How will you measure its success? With the number of readers? How long people stayed on your page? Your bounce rate?”
“Even if those metrics are important, they don’t help you move the needle. What you want is having content, which helps you grow your business. So, what you want is to generate leads with the content you create and publish. Therefore, look at how many leads you generated for each piece of content.”
“You’d rather have 100 readers and 10 leads than 1,000 readers and no leads.”
7. Appointments booked
“I use appointments,” says Edward Marchewka of CHICAGO Metrics.
“Content efforts are about providing value, providing engagement, and gaining interest. When viewed as an authority people will trust you and seek out your services. Thus, they will want to set appointments to discuss the next steps.”
8. Sales qualified leads (SQLs)
“Sales Qualified Leads,” says Brooks Manley. “For the longest time we measured bounce rate, time on page, and email signups – but we’ve realized this kind of engagement means very little if they have no buying intent (unless running ads or affiliate links).”
9. Email signups
“Newsletter signups might seem a bit old school, but they give us a good idea if the content we are providing is what our readers want to see,” says Nicole Wolfe of TopSpot Internet Marketing.
Steven Rudnik of CK3 Guides says, “For blog or top-of-funnel efforts, one measurement of engagement is email signups. If we’ve created great content or helped a reader find the solution they were looking for, we’re far more likely to see them sign up for our newsletter. It’s a good social validation signal that we provided them with the information they were looking for.”
Anthony Gaenzle of Anthony Gaenzle Marketing adds, ”Building your mailing lists should be one of the key focuses of your content strategy. Once you’ve built large, segmented email lists, you can send targeted messages to specific groups of your audience segmented by any number of factors. This allows you to increase conversions because you’re able to drop targeted content right into your audience members’ email inboxes.”
10. Email open and click-through rates
“Aside from the traditional page views and social shares, we track down email clicks for our weekly newsletters,” says Mario Peshev of DevriX. “Top content marks a higher engagement ratio compared to other stories (or blog posts) that we blast in our bulletin.”
“Regardless of whether you maintain a successful newsletter or not, it’s worth testing a weekly (or monthly) issue that distributes your top content and serves as an engagement measurement mechanism as a bonus.”
Brandon Monaghan of Miracle Brand adds, “When it comes to email content, we look at open rates, click rate and conversion to determine its effectiveness. In terms of what looks good/effective, there are benchmarks per industry we work towards taking into account the size of the store, size/quality of audience, and opportunity for repeat purchases. Outside of this, we ultimately look for continued improvement over time.”
“We optimize at each metric with the understanding that starting at the top of the funnel has an exponential effect on everything down stream:
- How many people subscribe to the list
- How many people open emails
- How many people click
- How many people buy
- How many people buy again
For each metric, we start with a hypothesis, and we test. We generally collect three data points to ensure the results are statistically relevant before we chose a winner and move on with the insight. For flows, we look at data points at 1000, and above before we make a call.”
Related: 34 Email Pros on How They Achieve Above Average Email Open Rates
11. Pageviews
Ramey Miller of Text Request says, “90% of everything we create is to bring us conversions. A good amount of that is in an indirect way. We write content that is general and just helps businesses be better at business.”
“The key is to get them interested in the product and service we offer after they click on our blog or post. So we look at pageviews. How many people went to other pages on our site, from that one piece of content. This lets us know what is and isn’t working in our lead gen funnel.”
“We use Pageviews to measure the engagement of our content efforts,” adds Randy VanderVaate of Funeral Funds. “Measuring Pageviews helps us understand how often people visit our website. A higher number indicates that many people are interested in reading our content.”
“Pageviews also indicate how well our updates on our pages and posts are performing.”
“Increased Pageviews are also an indicator that our SEO practices are working. An increased number in pageview means that the updates and changes we made are working to cultivate engagement are working to drive traffic to our site.”
12. Number of new people reached
“The best metric to measure your content engagement can be found on the individual post insights,” says Brianna of Girl Hustlers.
“This metric shows you how many accounts you reached that wasn’t following you already. I use this metric the most because it shows how many people I reached that were outside my current audience, I can use this data to measure the effectiveness of my hashtag strategy, and I can also use this to measure the state of the algorithm.”
13. Custom events
“Set up custom events for your content and measure those conversions,” says Morgan Hennessey of Electric Enjin. “We typically look at content like blogs to be more awareness level but push them along the funnel if you can.”
“My favorite tactic is including gated downloadable content (like checklists or ebooks) and tracking those interactions as a conversion. That way, you’re seeing if your content is 1) about a good topic and 2) worthy of engagement AND you’re collecting emails, too!”
14. Site visitors
“Growth in Site Traffic,” says Kenny Trinh of Netbooknews. “I tend to focus on growth from organic search, email, and social since these are the key channels for content promotion I use. This essentially is an indicator of how successful you are at catching people’s attention with your content and filling the top of the funnel with visits. You can go deeper and start looking at things like time on site, email CTR, etc, but the more metrics you focus on, the less effective metrics become.”
15. Pages per session
“Number of pages per session gives me a good indication that the reader likes what they’re reading and is keen to read more/find out more about you,” says Deirdre McArdle of ENNclick.
Swati Chalumuri of Hearmefolks says, “If I notice a reduction in the number, I concentrate on the exit rates and tweak the content on the affected pages.”
Jakub Rudnik of Shortlister adds, “We measure this on Google Analytics. Different types of content will have different benchmarks for pages per session: home pages should have many pages, evergreen blog content much fewer. Still, no matter the type of content there are ways to optimize a page to increase how many pages a user visits during their time with you.”
Related: What is ‘Pages Per Session’ in Google Analytics & How Do I Increase It?
16. Percentage of traffic from search
“We publish a lot of content, so we measure the impact by viewing total organic visitors filtered by landing page,” says Adam Gingery of majux.com.
“Here’s how: In Google Analytics, go to Behavior > Site Content > Landing Pages (filter for organic traffic!). If you are getting organic visits to your blog posts and pages, your content marketing is working.”
17. Percentage of traffic from social media
“There are a few metrics that every content marketer knows to watch, such as time on site, bounce rate, and unique visitors,” says Mackenzie Bailey of Steeped Content.
“However, there are creative metrics to monitor your content magnetism. I build UTM parameters into blog links, which I tactically share on sites like Quora when responding to queries. Doing this lets me track the inflow of traffic in Google Analytics from different sources. It’s a great way to see how your content is being engaged on social sites.”
18. Revenue
“If your job is in sales you’ll want to watch how much revenue your page produces,” says William Schumacher of Uprising Food.
“When eCommerce in Google Analytics is enabled, you can display the page ranking of all the content under the behavior segment. This will show you the total income each page has generated for you.”
Storm McManus of Storm Marketing Consultancy adds, “For eCommerce clients, sales are going to give us a good indication of the way the audience has engaged with the content.”
19. Social shares
“The amount of traffic your site receives is not always because you have great content but because you are able to engage users with your content,” says Derin Oyekan of Reel Paper. So, you want to measure how many times people share your content since people sharing your content means that they like it and want other people to know about it.”
Mehdi Hussen of SalesHandy says, “Social sharing is the key. I check how many times the blog is shared on social media and track its performance across all platforms.”
Sturgeon Christie of Second Skin Audio adds, “Likes are great, but shares are what truly drives reach and so Second Skin Audio likes to use that as the main metric to gauge its content efforts off of.
“When your content gets a high number of shares, you know it must be engaging. People only share content they’re truly impressed by, so looking at the number of shares your content gets is a great way to see how engaged people were with it.”
“If your photo or video post gets no shares whatsoever, on the other hand, it’s likely not all that exciting of content and you should probably switch up your content strategy.”
For example, Todd Ramlin of Cable Compare says, “Right now we’re trying to increase our presence on social media so one metric we’re paying extra attention to is social sharing. Social shares track how many times the content gets shared on social media sites. A share matters because it’s an endorsement and it also exposes your content to a wider audience.”
Sarah Taher of Delta Growth agrees, “I would focus on social shares of that content. Social shares bring more traffic, give strong social signals to search engines about your content, and help improve the authority of newly launched websites. Having content that goes viral is every content marketers’ goal.”
20. Average time on site
“Far too many bloggers, journalists, and other writers tend to take too much of a robotic approach when it comes to website copy,” says David of National Air Warehouse.
“Your article is “Ten Ways To…”, you come up with your list of points, and you just start laying out facts, statistics, and examples. However, to really have a copy that converts, your writing voice needs to be more natural and personable.”
“For example, ever thought about including a relevant personal anecdote in your copy? That goes a long way in improving conversions. Also, do you write as you talk? Don’t take this to the extreme, but if you think about it, I think you get my point.”
“Yes, your copy needs to be factual and accurate, but it does not have to read as strained and overly persuasive. Communicate with your readers on a real and natural level and your conversion rates should improve.”
“As far as metrics to track, conversions would be too obvious, and I’m sure everyone’s doing that. But next in your toolbox should be the amount of time spent on your site and how many pages are being visited during each visit. If those are trending upwards, and improvement in conversions should be sure to follow.”
21. Positive visitor feedback
“We use positive feedback as a metric to measure engagement,” says Arnold Chapman of ELD Focus. “The audience segments which are highly interested in our products tend to contact us to let us know what they like and dislike. This helps us with our approach to content for when we have new ideas.”
22. New Linkedin connections
“My goal is to build a reputation as being a B2B copywriter for small IT and tech companies in the Thames Valley,” says Alice Hollis. “And, my data shows me that the best clients I have come via referral through LinkedIn. So when I post my content through the platform, I’m interested in reaching those 2nd and 3rd-degree connections to extend my network to build future pipeline.”
23. Backlinks
“The number of backlinks you’re securing for your website is an important marketing metric to use to measure the engagement of your content efforts,” says Tiffany Schultz of Lake One. “Backlinks not only help to drive referral traffic but also shows Google that your content is trustworthy, which will contribute to your overall rankings.”
Lukasz Piotrkowski of Upmenu adds, ”In my quest for world domination (or at least internet domination), my goal is to use my content to gain and maintain a high Google ranking. As such, the most important metric for me is that of inbound links to my site.”
“I’m constantly assessing the links to each of my pieces of content (I use SEMRush to help me to do this) in order to ensure that the links leading to my content are of super high quality as its only by gathering these great quality links that I’ll manage to gain high domain authority, great visibility and, therefore, start climbing the ranks.”
24. Assisted conversions
“One metric that should be used to measure the engagement of content efforts is assisted conversions in Google Analytics,” says Jesse Teske of JCT Growth.
“Upper funnel content on the blog often doesn’t convert but introduces the customer to the brand. Understanding the role and how much it actually plays in the journey can drastically change the ROI of your content effort.”
Related: The 19 Fundamental Content Marketing KPIs for Measuring ROI
25. Referring domains
Franco Colomba of Rankable SEO says, “As an SEO Specialist Content Writer, I look at the number of referring domains as it indicates 1st-page rankings and other sites linking to you.”
26. Impressions
“Does your new blog post rank well enough to generate hundreds of impressions,” says Craig Streaman of Streaman Marketing. “Even if it’s not driving clicks (yet), organic search impressions on a new piece of content is the best way to measure effectiveness.”
“How? Well, it’s rare to see impression/click trends for content trending in different directions. If a recently published piece is already ranking and driving impressions, it’s likely that other articles on your site are also getting the benefit as a result. Remember, some content is made more to support existing content than to stand alone.”
27. UTM campaigns
“Tracking URLs (and UTM parameters) are a great way to find out how well your content is doing,” says Brandon Amoroso of ElectrIQ Marketing.
“By using a trackable URL from programs such as HubSpot you can find out how many people click on your content and where they get redirected from. This information can be used to help modify your marketing strategy since you gain a better understanding of what type of audience your content resonates with.”
28. Average dwell time
“The one crucial metric for me is average dwell time which I track in my Google Analytics account,” says Nikola Roza of Nikola Roza- SEO for the Poor and Determined. ‘This metric is crucial for me because I know that in order for any kind of engagement to happen, users need to stay on my site and pages and consume my content.”
“And it doesn’t matter whether engagement is clicking on an affiliate link, or on an internal link, or social sharing the article, or signing up to my newsletter.”
“Each of them can happen only after the user has stayed for a few minutes on the page.”
“In other words, if you nail this one metric right, others tend to fall in place on their own.”
“And you can always do some smart CRO later to improve those other metrics. But is it’s essential that people stay for as long as you can keep them.”
Related: Dwell Time for SEO: What It Means & 25 Ways to Improve It
29. Average session duration
“There’s no magic formula for measuring content success, but there are a few metrics to analyze when measuring the engagement of your content efforts,” says Jennifer Hastings of SSPR.
“One of the best ways to determine if visitors are engaged with your content is to look at the Pages Per Session and Average Session Duration metrics. The pages per session measure the total number of web pages a user visited, whereas the average session duration measures the time a user spends on the website.”
“Together, these metrics will help you determine if your visitors are actually engaging with your content or not. This information can be used to further develop your content strategy and create engaging content that is more relevant to your target audience.”
30. Comments
“Typically when we think of engagement, we are looking for an action the audience took on the content,” says Stephanie Riel of RielDeal Marketing.
“While social media platforms bundle various engagement sources together. One tried and true metric we use to measure the engagement of content is the comment. If the audience is compelled to take action – a comment often requires extra effort and thought whether on a social media account, or a blog article.”
In sum, these are 30 metrics you can use to measure how engaging your content is. The metrics that matter the most for your brand will depend on your goals.
All ready to start tracking your content engagement metrics? With our business metric tracking software, you can track all of your key content engagement metrics from one just screen.


