


Table of contents
Just 8% of marketers consider themselves “successful” or “very successful” at measuring the ROI of their content marketing efforts.
That’s a huge problem. It means they’re investing hours of time (and lots of cash) into a strategy they don’t know is paying off.
It could be costing them more cash than it’s generating. Uh oh.
The even more shocking news? You can track your content performance using a tool already in your arsenal: Google Analytics. (And, even better–it’s free.)
We asked 30+ marketers how they’re using Google Analytics to track the performance of their content. They shared a bunch of valuable tips, including:
- Add your content marketing goals
- Assign goal values
- Use the content grouping feature
- Track on-page engagement
- Monitor the performance of links you’ve included
- Look at how content plays a role in the customer journey
- Use weighted bounce rates to find your most interesting content
- Monitor your most popular landing pages
- Add annotations to show content update dates
- Look at the content drilldown report
- Integrate your data with Google Data Studio
- Compare at new vs. returning visitors
- Track how your audience interests develop
- Create a custom Google Analytics dashboard
- Build custom segments for your personas
- Sync your Search Console data
- Use custom UTM links
- Dive into model comparisons

How to Track Content Performance Using Google Analytics
1. Create Google Analytics goals for your content marketing goals
One of Google Analytics’ best features is their goal tracking.
You should already have goals you want to achieve with your content marketing, such as:
- Increase revenue
- Reduce churn
- Grow your email list
It’s crucial to create those goals in your Google Analytics account already set-up. That way, you can track how each piece of content helps you meet each goal.
In fact, teambuilding.com takes this so seriously that Michael Alexis says: “We switched from tracking all Acquisition and Behavior data to only looking at the data that results in Goal Conversions.”
“The result of this switch has been that we are now crystal clear on what drives actual leads and revenue for our business. Before this re-focus, it was easy to get lost in the data and we invested significant resources in developing traffic and similar from channels that just weren’t profitable for us.”
That’s why WikiLawn‘s Jennifer Walden says: “The best tip I’ve found to make the most out of Google Analytics for content marketing or any marketing strategy is to make use of the goals feature and make sure your goals fall along the buyer’s journey.”
“For example, when seeing how aware customers are of you, you can set a goal to track traffic via relevant keywords.”
“Or when they’re engaging with your content and hearing your message, you can track the amount of time they’re spending on videos and blog content, and what they’re watching specifically.”
Related: How to Set Content Marketing Goals (& The Most Common Ones Marketers Set)
2. Assign goal values
“One way Benson SEO uses Google Analytics to measure content marketing efforts is by assigning dollar values to actions we want users to take on our client websites,” said Scott Benson.
“For example, a newsletter subscription has a value to your business. And while this particular action might have a smaller value than say a
“contact us” form, we still assign values to these micro conversions. A newsletter sign up feeds email marketing, and other channels, and is often an indicator the user could convert to a macro goal later.”
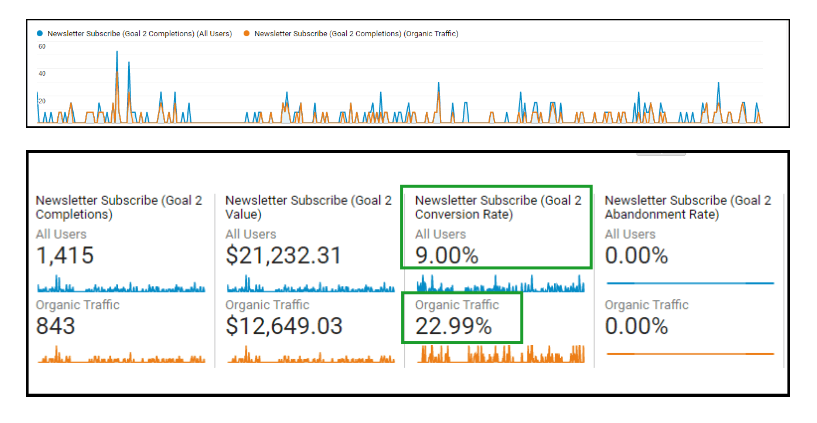
“We typically want to see how many searchers coming from organic sources sign up for a newsletter via a request form, versus users from all sources – paid ads, paid social, free social, etc.”
“Also assigning a goal value to the newsletter sign up action allows us to analyze the value of individual pieces of content, categories or site sections are having on business metrics,” Benson continues.
“We compare all users from every source/medium to those strictly from organic sources.”
“By fine-tuning those messages and measuring this metric, we will find the messaging that yields the best conversion rate for the newsletter subscription request,” Benson summarizes.
3. Use the content grouping feature
“One of the absolute best things that I’ve started to do is use the content grouping feature of Google Analytics,” writes Ron Stefanski of Your House Needs This.
“This allows me to group pieces of content together easily allow for quick analysis and reporting. I personally use it for “Best X for Y” content on my website, but there are many ways to use it for analysis.”
SafariGrowth‘s Grafton Robinson adds: “We’ve started adding content groupings to all new content, which allows us to track how different types of content perform against different goals.”
“For content operations of any scale, this makes analysis so much faster and easier, and it’s easy to do.”
Related: 18 Google Analytics Custom Dimensions for Drilling Down Into Your Website’s Performance
4. Track on-page engagement for each piece of content
“When we create and publish new content, we want to see which content performs the best,” says Colin Mosier of JSL Marketing & Web Design.
“Usually, in the form of blog posts, we can see how successful these posts are by monitoring how many page views a particular blog is receiving.”
“We also want to monitor how long a person is on this particular page. These factors give us great insight into what type of content people really enjoy reading.”
Mosier explains: “If we find that blogs on a particular topic are receiving more hits and for a longer duration, we can see that this may be a topic that people want to see more of. This gives us insight into our future editorial calendars and if we should continue to write about a certain topic more.”
“Also, if we have a guest blogger write a post for our website and we find that it performs particularly well, we may want to reach out to them again for a follow-up post!”
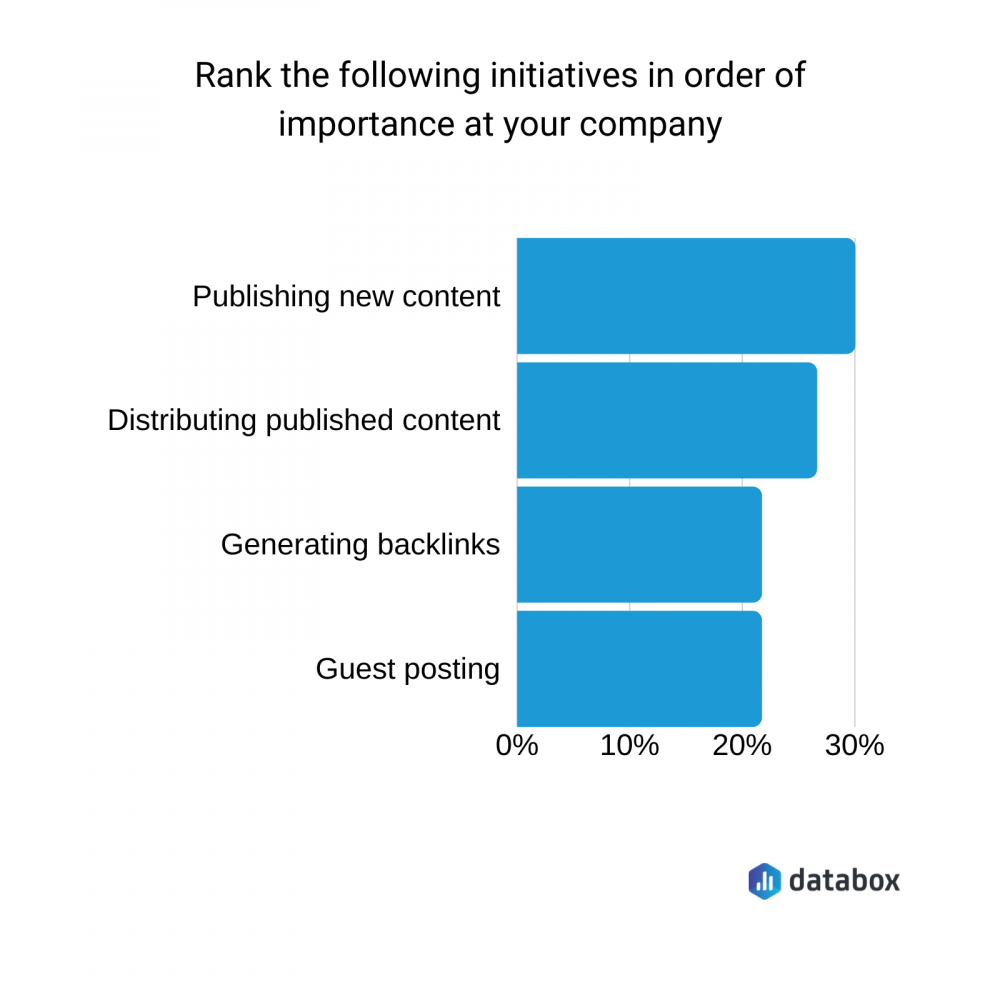
Considering most companies say their most important initiative is publishing new content, that’s a great way to make sure you’re on-track:
FreedomRep‘s Ilir Salihi adds: “Optimizing content for the search engines is critical, but only one piece of the puzzle. This traffic is useless if our visitors are landing on our site and clicking the back button.”
“We look at the landing pages, average time on site, and also investigate the exit pages where visitors are dropping off. Are these pages providing the best answers to user search queries? How can we improve the content or user experience on these pages to increase engagement.”
“This data is vital in ensuring our content provides the most value to our audience,” Salihi says.
So, how do you track these on-page metrics? What data should you be looking at?
The team at MakeWebBetter do this using the scroll event in Google Analytics. Gaurav Tripathi says it “is the best method of monitoring content marketing activity because we can easily understand how deeply users read our content (by monitoring scroll percentage), and compare each content segment with average. “
Lightico‘s Howard Schulman adds: “One game-changing metric we’ve implemented in Google Analytics is scroll depth events and goals to measure blog content. With tracking scroll depth, we at least know how much of our content is being read and where the drop off happens.”
Summarizing, Robin Rozhon of Electronic Arts (EA) says: “The number of pageviews is a good indicator of traffic performance but it’s a very limited view that says nothing about user engagement.”
“The magic happens when you start combining multiple metrics (pageviews, scroll depth, on-page clicks, traffic from earned channels, etc). Event tracking allows you to measure on-page clicks and scroll depth while calculated metrics allow you to summarize all those inputs into one metric.”
Related: The 19 Fundamental Content Marketing KPIs for Measuring ROI
PRO TIP: Measure Your Content Marketing Performance Like a Pro
Struggling to track the impact of your content across platforms? We feel you. Thanks to Databox, fragmented data doesn’t have to hold you back anymore.
Our library of free content marketing dashboard templates puts all the insights and metrics you need in one place. No more jumping between reports!
Measure engagement: Track key metrics like likes, comments, shares across social media platforms to see what content resonates most with your audience. Analyze website traffic, bounce rate, and average time on page to understand how visitors interact with your content.
Optimize conversions: Identify high-performing landing pages and blog posts that drive the most leads using dashboards like HubSpot Marketing Lead Source. Analyze campaign performance and user activity for both organic and paid content with a Facebook Pages & Facebook Ads dashboard.
Improve SEO: See which pages rank highest in search results and drive the most organic traffic. Improve search visibility by visualizing key SEO factors like backlinks and domain rank.

You can easily set it up in just a few clicks – no coding required.
To set up a dashboard, follow these 3 simple steps:
Step 1: Choose a fitting template
Step 2: Connect your data
Step 3: Watch your dashboard populate in seconds
5. Track whether people click the links you’ve included
“A game-changing Google Analytics technique I’ve started using is pairing GA with Google Tag Manager to track external link clicks throughout my content marketing efforts,” Tony Mastri of MARION Marketing Company says.
“Including quality citations to third-party resources is a content marketing best practice. If I notice patterns where certain citations are frequently causing users to leave our site, it’s a good signal to create a similar content asset that can be published as a page or embedded as a visual without sending users away.”
“As always, proper citations are still necessary, but if you can relay the content without your visitors needing to leave your website, you’ll generally be better off.”
Mastri continues: “This is similar to the driving concept behind Google’s Featured Snippets. They still credit the original source, but they retain search engine users by summarizing the information in a way that doesn’t require navigation to a third-party site.”
Angela Ash of Flow SEO adds: “When we track our content marketing, it’s important to see whether our site visitors are clicking on the links within our content, directing them to other pages on our site of a similar nature.”
“This can increase the length of time that visitors browse our site, meaning they may return more often. By monitoring this, we can learn whether our anchor text provokes curiosity to click on the link, or if we have a little more work to do.”

6. Look at how content plays into your customer journey
“One game-changing way we’ve been using Google Analytics is to examine users’ Behavior Flow from organic search traffic,” says Sam Olmsted of Online Optimism.
“This data is extremely valuable because it allows you to see which content is the most engaging and how users actually move around your site.”
“By looking at the Behavior Flow report, you can gain insights into how people get to your website in the first place and whether it was your content marketing efforts that got them there.”
“You can also see where people go once they are on your website, so you can determine whether or not your content made an impact on their interaction with your business.”
Olmsted explains: “To find the Behavior Flow chart, you first need to filter for organic search traffic. Then go to Behavior and click Behavior Flow.”
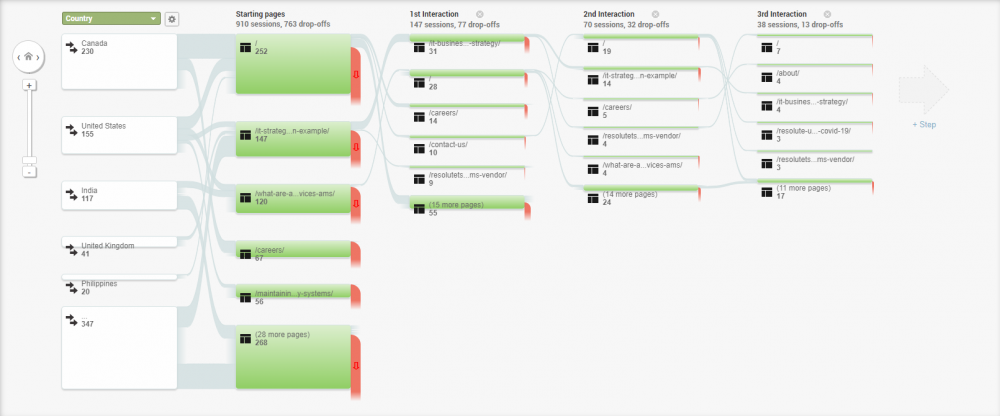
Colton De Vos of Resolute Technology Solutions adds: “Using the ‘Users Flow’ page in Google Analytics, our team has been able to identify which pages visitors from our target demographic land on and then where they progress from there.”
“The real value from examining User Flow is focusing our interlinking strategy and CTAs (calls-to-action) in our content marketing on other services and offers that our target demographic is naturally interested in.”
“If there isn’t a clear navigational path on our website to these other pages, we add in sidebar offers, mid-page links, or corner page pop-ups. This brings down the bounce rate, raises the average time on site, and makes for a better user experience for website visitors looking for relevant information quickly.”
“By filtering by geographic location, we’re able to tailor these extra interlinks specifically to what visitors are looking for within North America where we do most of our business,” De Vos adds.
Melanie Musson of AutoInsuranceCompanies.org agrees: “By tracking the buyer’s journey [using the Behavior Flow report,] we’ve been able to pinpoint and eliminate stopping points–or anything that hinders a buyer from taking the next step on the journey toward conversion.”
7. Find your most interesting content with weighted bounce rate
“Google Analytics allows you to view bounce rates of your pages using a weighted sort,” Craig Ricks Jr of Acadian Windows says.
“With this feature, you can see at a glance which pages have the most trouble retaining people’s interest.”
“Thanks to this, we have been able to observe the commonalities among those pages that have been unable to retain user interest. We are then able to use that knowledge to revamp the content on those pages.”
8. Monitor your most popular landing pages
According to Darwin Overson, the team at Overson Law has “focused on the landing page report over the past few months, and the insights have been fascinating (Behavior > Site Content > Landing Pages).”
“Once in the landing page report, filter your segments to only Organic Traffic; then, view your organic landing pages in descending order.”
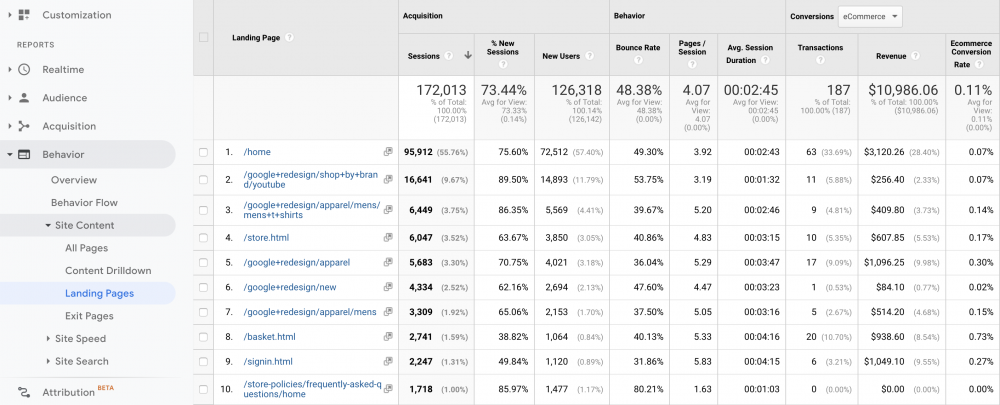
Overson explains: “This allows us to find pages that have high amounts of traffic but low lead volume, and vice versa.”
“In short, it helps us know what content to produce going forward because we can focus on the organic landing pages that are actually driving value to the business rather than just viewing site-wide conversion reports.”
Related: 15 SEO Metrics That You Should Be Tracking On A Daily Basis
9. Add annotations to show content update dates
Made some big changes to your old content? (We did–and increased search traffic by 75%.)
Brian Barwig of Integrate Digital Marketing recommends to “record any changes in Google Analytics by creating an annotation. You can do this directly under the graph showing days and traffic.”
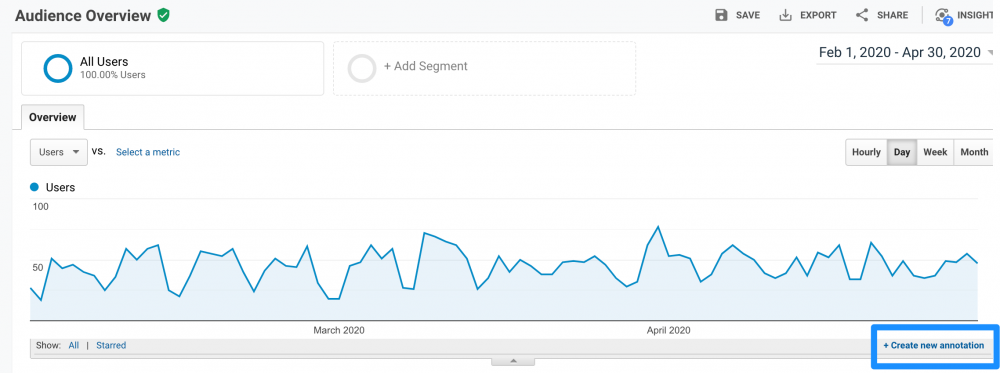
Barwig explains: “Create an annotation noting updates you made to a page (new Title, Metas, Headers, added internal links, etc). This will give you a baseline of metrics pre and post-change.”
“From there, periodically check the unique visitors to the page to determine if the content updates you implemented were successful or if additional changes need to be made.”
“They are simple additions to the data when you publish a new content piece,” Ashley Sterling of The Loop Marketing adds. “It also marks the spot that your team should start to look into keyword results, domain authority, backlinks, etc.”
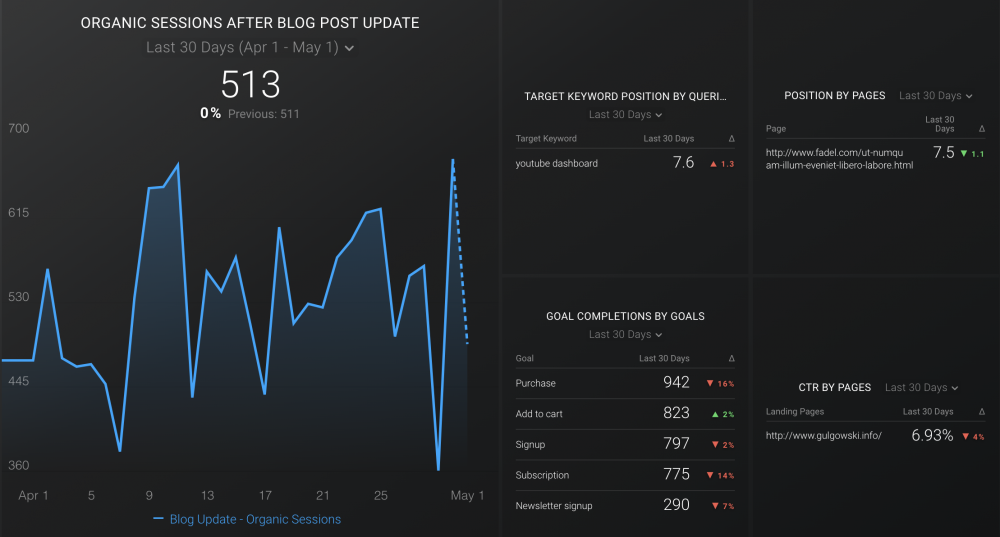
*Editor’s note: Need help tracking the aftermath of your content updates? It’s not worth updating old content if you’re not prepared to track the changes. Grab our Blog Post Performance After Update to see how your most important SEO metrics improve post editing:
10. Look at the content drilldown report
“I love the content drill down report in Google Analytics,” writes Robbie Richards.
“My agency works with a lot of SaaS companies, so using this report allows us to monitor traffic and conversion metrics across different sections of the site.”
“For example, we usually monitor organic traffic and trial signups across the /solution and /features subfolders. Then, we’ll monitor organic traffic and micro conversions such as ebook downloads, newsletter signups, etc. across the /blog subfolder.”
“This allows us to better drill in and find the source of traffic and conversion movements, and better prioritize our SEO efforts by the level of business value.”
Richard adds: “The Query Builder in Databox also allows us to visualize this easily for our clients, which they love!”
11. Integrate data with Google Data Studio
Over 60% of companies currently employ between 1 and 3 content marketers on their team:
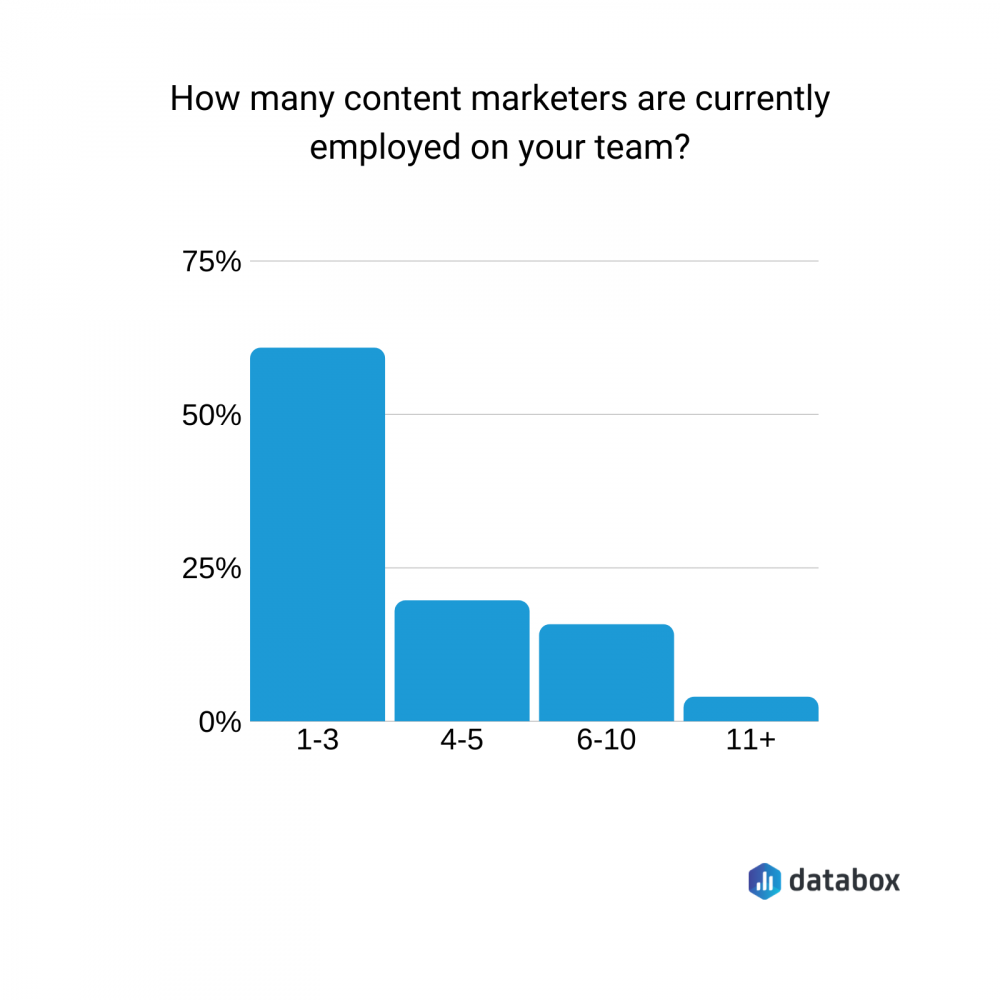
“A couple of years ago, we started creating automated reports on Data Studio with the data from Google Analytics,” says Mashvisor‘s Daniela Andreevska.
“That’s been a real game-changer for us as a startup with a very small content marketing team.”
“This strategy has allowed us to track and monitor the performance of our content on a daily basis without wasting time and effort unnecessarily.”
Emily Gorman of Foundation Marketing agrees: “The real game-changing way that we’ve leveraged Google Analytics is by pulling this data into a Data Studio dashboard that our entire team has access to.”
“Even for someone who isn’t familiar with where to find data in Google Analytics or how to understand what the data is saying, presenting it in the dashboard gives them the means to jump in and understand how our content marketing efforts are excelling or falling short.”
Maybe that’s why 86% of businesses use more than one tool to track their content marketing performance:
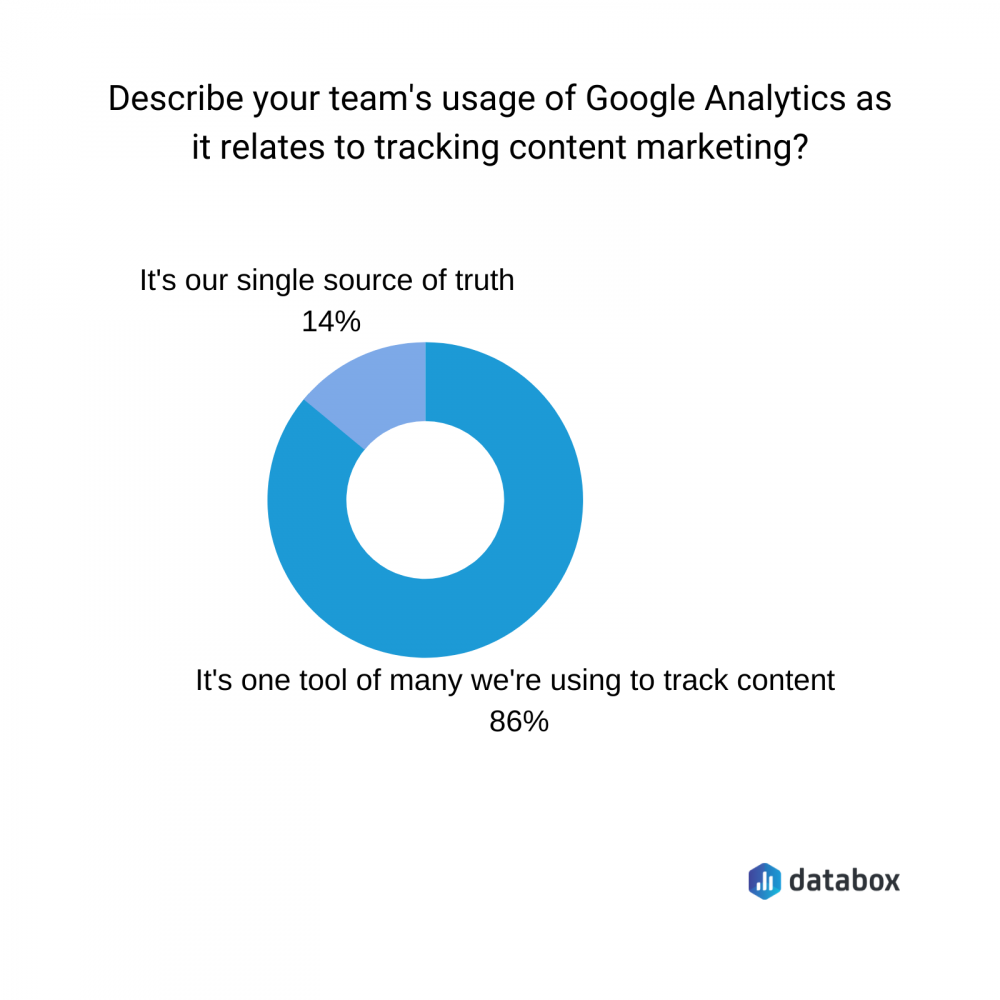
“We present this data from Google Analytics in a way that allows us to look at our efforts overall, as well as filter the data down to look at a single content asset so that we can identify actionable insights and optimization opportunities,” Gorman summarizes.
Editor’s note: Track content marketing performance in a single marketing reporting software and reduce the time to build reports by more than half.
12. Look at new vs. returning visitors
According to Mailbird‘s Andrea Loubier, “tracking new visitors is important.”
“If you’re running any type of content marketing campaign, it’s nice to know if you see new traffic or your regular site visitors. If you’re not seeing much in the way of new visitors, then it might be time to make a pivot on your content topics.”
Google Analytics makes it easy to find this information:
13. Track how audience interests develop
“If a business needs to do better communication with its customers, then marketers need to create compelling content at the customer’s level,” writes Khunshan Ahmad of InsideTechWorld.
“A Google Analytics report clearly shows how people have been reacting with your business over the period. There is an option of ‘interest’ in the Google Analytics report that lets the marketers overview the interest of their audience. The interest will be shown in different graphs like:
- Affinity Category: it tells about the general hobbies and interests of people who have been visiting your site. It identifies users in terms of lifestyle like a sports fan, cooking enthusiasts, etc.
- In-Market Segment: it shows the marketers the buying interest of the visitors. The in-market audience is composed of visitors that are actively searching the products and services like yours.
- Others: this graph in the report shows the broad category of visitors’ interests. For example, one of the visitor interests is food; then, this graph will show the in-depth of that interest like recipes, cuisines, restaurants, etc.”
Ahmad explains: “Keeping all those points of interest in mind, marketers need can keep on updating their content to boost the brand simultaneously. In case marketers want to add a new product, the interest graph can also help the research and development team to work accordingly.”
“Google Analytics lets marketers check on the daily interest of their audience and help them in producing the content at the same interest level. Content marketers will also be able to create content that attracts the audience effectively.”
14. Create a custom Google Analytics dashboard
Feeling overwhelmed with the sheer amount of data inside your Google Analytics account?
Rianna Susco says the team at Squeeze Marketing “have created a custom content marketing dashboard to analyze the data that is most important for us at one quick glance. This also helps us manage our overall client load and see everything that we need from different clients in a format that makes sense to us and our unique strategy.”
“If you want to create good content, you first need a way to measure if your content is good,” adds Affirmative‘s Alex Jolly.
“By setting up custom reports in Google Analytics we have revolutionized our quality assurance for every piece of content we produce. We have the data and now we have the means to measure it.”
*Editor’s note: It’s your lucky day! Say goodbye to pulling data into a custom-built spreadsheet month after month. That’s a huge time suck. Instead, select one of our Google Analytics templates. It pulls data from your account every month, ready for you to share with your content team:
15. Build custom segments for your personas
To create a solid buyer persona, it’s important to know how to identify your target audience.
“We use custom segments to evaluate the success of our content marketing efforts,” writes Meaningful Profits‘ Roy Morrison.
“For example, speaking of “tracking” one of the customized segments that we have set up is users who are on a Safari browser (as they have Intelligent Tracking Prevention), which makes any kind of “tracking” much more challenging.”
“This segment gives us a better idea of what percentage of the numbers we see in our Google Analytics has been compromised due to ITP.”
Morrison explains: “As such, we can a more qualified decision on whether or not our content marketing is successful or not vs just by looking at the raw data that Google Analytics is telling us.”
16. Sync your Google Search Console data for SEO reporting
“We have been using Google Analytics for a number of metrics, but the one we have adapted recently (and seen positive results from) is tracking queries,” says VPNRanks‘ Abdul Rehman.
“We keep finding new user queries and optimize our content accordingly, and then put annotations in the analytics to be able to further track the results. We have seen great improvements in our rankings and CTR.”
(Bear in mind you’ll need to sync your Google Search Console account with Analytics to see this data.)
Related: Content Strategy vs. SEO Strategy: How to Decide Which Comes First
17. Use custom UTMs in your promotion links
Google Analytics shows the site someone visited your content from. But wouldn’t it be awesome if you could find the individual place it was shared?
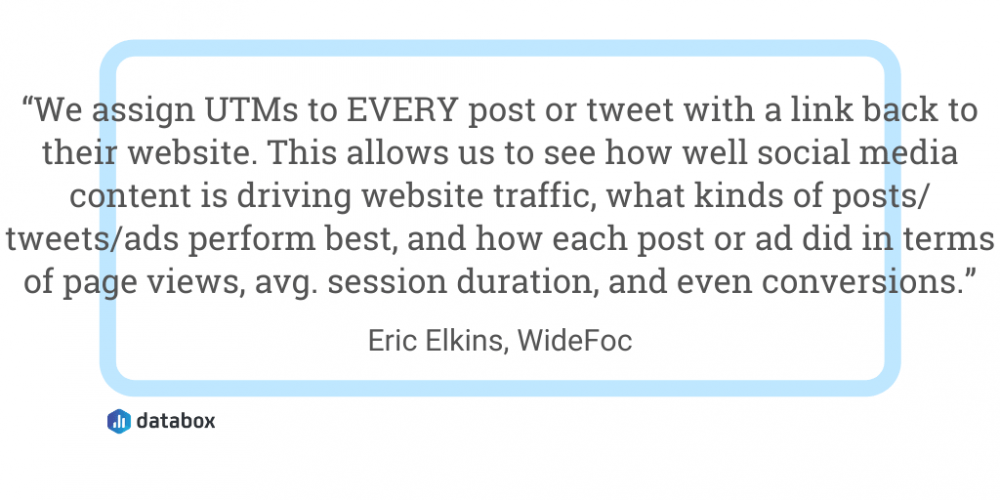
Spoiler alert: You can. WideFoc‘s Eric Elkins does this by having “a consistent set of custom UTMs we use for each client. We assign UTMs to EVERY post or tweet with a link back to their website.”
“This allows us to see how well social media content (organic AND paid) is driving website traffic, what kinds of posts/tweets/ads perform best, and how each post or ad did in terms of page views, average session duration, and even conversions.”
(You can use Google’s Campaign URL Builder to help with this.)
18. Dive into the model comparison tool
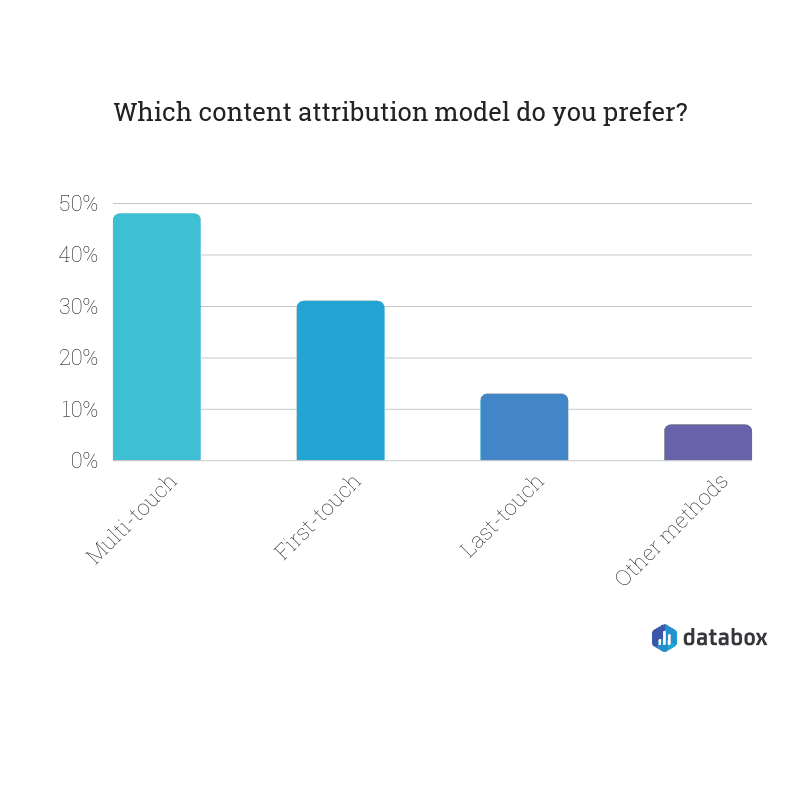
“The best way to track conversions from content marketing using Google Analytics is by using the model comparison tool to check first click attribution and last-click attribution,” according to Nate Rodriguez of LIFTOFF Digital.
“Using them both to get a much better idea of the ROI of your content marketing efforts.”
Our data shows that this multi-touch attribution model is the preferred setting to track content marketing ROI:
TwistFox‘s Daniel Young agrees, and also recommends to “use the comparison tool under the Behaviour Report to see which articles are leaking or underperforming in relation to the rest of your content. You can also use this to find winning articles to repurpose or optimize.”
Tracking content performance has never been easier
If you’re one of the 8% who doesn’t track the ROI of your content, you’ve got no excuses.
You’re probably already using Google Analytics to track website performance. With these techniques, you can use the same tool to monitor the impact of your content strategy, too.


![How to Leverage Your Website Analytics to Acquire New Customers? [Research Findings Based on 100+ Companies]](https://cdnwebsite.databox.com/wp-content/uploads/2022/10/10044001/google-analytics-4-metrics-and-dimensions-guide-1000x563.png)


