


Table of contents
There’s nothing businesses desire more than growth.
Your growth rate is a telling indicator of how far you’ve come in business and how soon you’ll be able to break even on investments. And if your company is shooting for an exit soon, your growth rate can be the difference between a few hundred thousand vs millions in investment dollars.
With SaaS, the stakes are even higher. Since the payment model doesn’t front-load all costs, the average SaaS company must sustain growth and keep customers for longer periods to break even. Hence, you need to benchmark growth to understand how you’re doing and if you need to make any adjustments.
It helps predict future growth and should influence all decisions including hiring, operational setup, and resource allocation.
Read on to learn:
- How to calculate growth rate in SaaS
- What the most important SaaS growth metrics are
- The best tools for calculating and analyzing SaaS growth rate
Let’s get started!
How Do You Calculate Growth Rate?
The formula for calculating growth rate for any metric is:
Growth Rate = (Final Value – Initial Value) / Initial Value
You’ll need two figures: your initial value, and your final value. Let’s take revenue growth, for example. If you wanted to see how far you’ve grown in the last year, you’d measure your last year’s revenue against this year’s.
So if:
- Revenue from April 2020 – March 2021 (Initial Value) = $250,000
- Revenue from April 2021 – March 2022 (Final Value) = $320,000
Your revenue growth rate would be:
($320,000 — $250,000) / $250,000
That’s a 28% revenue growth rate in one year.
You can also calculate your growth rate over the specified time period based on the initial and final value with Databox’s Percentage Growth Calculator.
What Are the Most Important Growth Rates in Saas?
In our survey, Customer Lifetime Value (CLV), Costs of Acquisition (CAC), and Monthly Recurring Revenue (MRR) topped the list of important SaaS growth metrics to measure.

Out of our 47 respondents, 35 identified as SaaS companies (54.29%) and Agencies/Consultants working for SaaS (45.71%). Here are all the metrics they voted most valuable for SaaS:
- Customer Lifetime Value
- Costs of Customer Acquisition
- Monthly Recurring Revenue (MRR)
- Signup Rate
- Annual Recurring Revenue (ARR)
- Churn Rate
- Expansion Revenue
- Net Promoter Score
- Leads Generated
- Annual Contract Value (ACV)
- Lead Velocity Rate (LVR)
- Opportunity Stage Forecasting
1. Customer Lifetime Value
The customer lifetime value (CLV) is a measure of the total revenue a business can expect from a single customer account over the course of the relationship.
It’s calculated as:
Customer Lifetime Value = (Customer Value * Average Customer Lifespan)
The customer lifetime value is an important growth metric because it indicates product quality according to Ethan Drower of CiteMed. Drower says “We focus on lifetime customer value for the long term. The idea here is that we want to always see progress with our marketing channels (topline revenue growth), but need to be mindful of product quality (churn) and, thus, the customer LTV value becomes incredibly important.
When it came to CiteMed, we knew we were on the right path when our existing marketing channels were showing double-digit percentage growth each quarter, and our customer LTV was increasing along with it. This showed us that both our marketing efforts were successfully scaling, and our product quality/customer satisfaction was at the very least keeping pace.”
2. Costs of Customer Acquisition
Customer acquisition cost (CAC) is the amount of money a company spends to get a new customer. CAC helps measure marketing’s effectiveness.
To calculate your CAC, you’ll need to add all the costs associated with winning new customers, i.e marketing, advertising, sales personnel… and divide that by the number of customers gained.
Customer Acquisition Cost = Cost of Sales and Marketing / Number of New Customers Acquired.
LuckLuckGo’s Ryan Yount says “we mainly focus on CAC when evaluating our performance. For example, we gauge how much money we spend on marketing, advertising, sales, and salaries, among others, and compare the number of customers we have gained over a certain period.”
3. Monthly Recurring Revenue (MRR)
The total amount of recurring revenue your business generates from all the active subscriptions in a given month is called monthly recurring revenue (MRR). This includes recurring charges from discounts, coupons, and add-ons, but not onetime fees.
It’s calculated as:
MRR = Number of subscribers under a monthly plan * average revenue per user (ARPU).
MRR helps you understand how well users love your product. It also helps you predict growth.
Jerry Han of PrizeRebel says “We check our monthly recurring revenue. It helps us understand if our software is truly meeting standards for not only us, but for our customers. We need our surveys to be quick and easy, and measuring our MRR gives us a good estimate of how accessible they are.”
Similarly, FindTheBestCarPrice.com’s Geoff Cudd says “For my performance analysis, I pay particular attention to the Lead Velocity Rate (LVR) and Monthly Recurring Revenue (MRR) growth rates (MRR). With the use of these analytics I’m able to see how well my business is doing in terms of revenue growth, forecasting future revenue, and tracking how many website visits become actual customers.”
Key Insights: Track your MRR with Databox SaaS MRR Drilldown for Leadership Dashboard template. This interactive dashboard is the perfect fit for financial teams and accounting professionals.

PRO TIP: Are You Tracking the Right Metrics for Your SaaS Company?
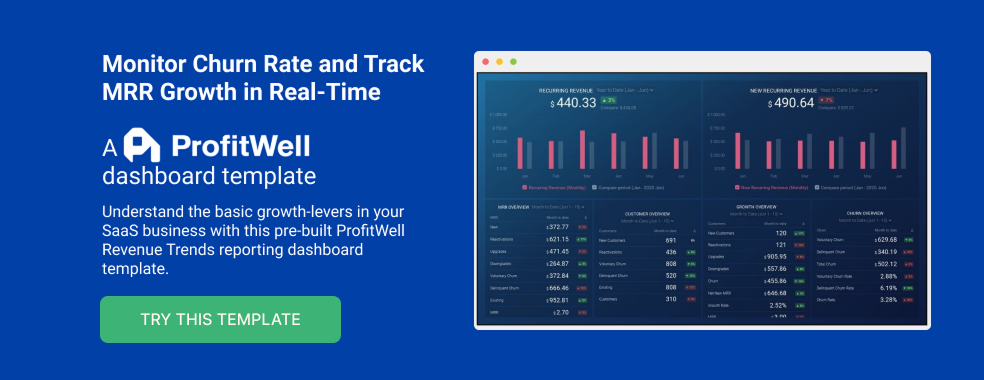
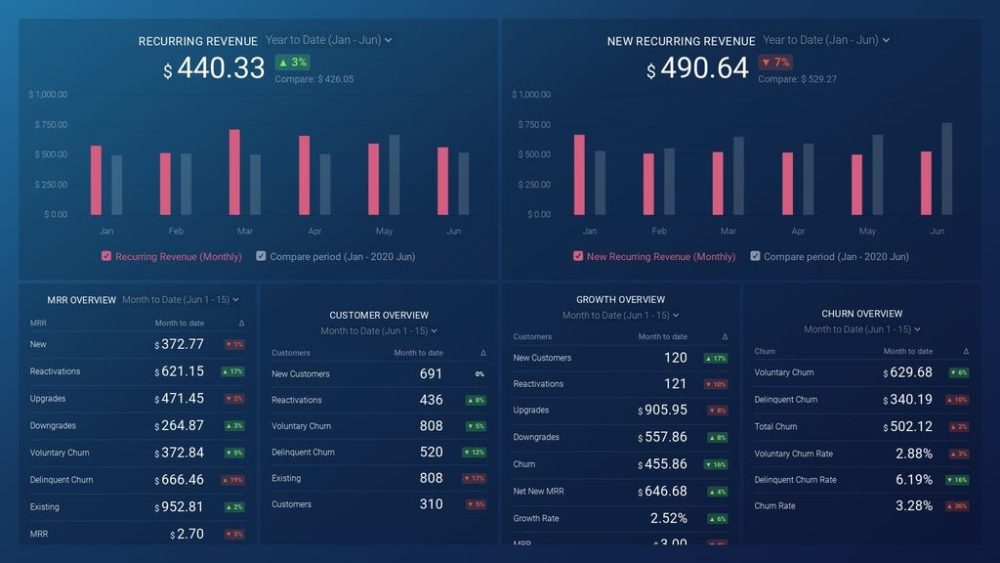
As a SaaS business leader, there’s no shortage of metrics you could be monitoring, but the real question is, which metrics should you be paying most attention to? To monitor the health of your SaaS business, you want to identify any obstacles to growth and determine which elements of your growth strategy require improvements. To do that, you can track the following key metrics in a convenient dashboard with data from Profitwell:
- Recurring Revenue. See the portion of your company’s revenue that is expected to grow month-over-month.
- MRR overview. View the different contributions to and losses from MRR from different kinds of customer engagements.
- Customer overview. View the total number of clients your company has at any given point in time and the gains and losses from different customer transactions.
- Growth Overview. Summarize all of the different kinds of customer transactions and their impact on revenue growth.
- Churn overview. Measure the number and percentage of customers or subscribers you lost during a given time period.
If you want to track these in ProfitWell, you can do it easily by building a plug-and-play dashboard that takes your customer data from ProfitWell and automatically visualizes the right metrics to allow you to monitor your SaaS revenue performance at a glance.
You can easily set it up in just a few clicks – no coding required.
To set up the dashboard, follow these 3 simple steps:
Step 1: Get the template
Step 2: Connect your Profitwell account with Databox.
Step 3: Watch your dashboard populate in seconds.
4. Signup Rate
Sign Up rate measures the percentage of website visitors who convert from your call to actions.
It is calculated as
ƒ Count(Sign Ups) / Count(Sessions)
When asked what SaaS growth rate metric gives the most valuable insight, Chosen Data’s Branko Kral says “The rate of new active users. So a conversion rate is measured as the % of people who converted from marketing to signing up but also using a feature inside the product for the first time. There are other important metrics too, of course, but this lets us decide in favor of marketing that generates people who actually use the product.”
Palkita Gautam of DataToBiz shares similar views “Acquisition – where we focus on getting more users to signup on PrepAI via paid ads and content marketing. We set and achieve a 2x target of increasing our user base each month.”
Related: How Zapier Grew Signups and Activations from their Blog by 400 Percent in 1 Year
5. Annual Recurring Revenue (ARR)
ARR is the revenue generated from recurring subscriptions for an entire calendar year. It’s calculated as
ARR = (Overall Subscription Cost Per Year + Recurring Revenue From Add-ons or Upgrades) – Revenue Lost from Cancellations.
At Explainerd, Natasha Rei says they “measure ARR to check how well our company is growing its customer base. If we see a higher ARR, that means we succeed in acquiring new customers.”
6. Churn Rate
Churn rate—also called attrition rate—refers to the percentage of people canceling their subscriptions over the course of a period of time.
Customer Churn Rate = (customers beginning of period — customers end of period ) / customers beginning of period
Measuring customer churn will help you understand how satisfied your customers are, and where you can make improvements.
“We analyze customer churn so we can calculate how many are canceling subscriptions in a given period. This metric is important because it indicates how well the company retains its customers. The lower the churn rate, the more successful the company, keeps its customers.” says Explainerd’s Rei.
Similarly, William Donnelly of Lottie says “We use Churn as the growth rate metrics to analyze the performance of SaaS.
Generally, we consider two types of churn: Revenue Churn and Customer Churn.
Customer churn evaluates the number of customers or accounts abandoning our services every month as a percentage of your overall customer count. Whereas, as a percentage of total revenue, revenue churn measures the amount of revenue paid by the customers abandoning our services every month.
As our company is in the growing phase, measuring churn becomes critical. For example, if we are experiencing a churn rate of 3% supposedly, it means that we are losing 30,000 customers every month. The replacement of such a big number of customers monthly is not at all sustainable for businesses.
Therefore, for our business, this metric becomes more important when we are losing customers. Our goal is to lower the churn rate to a point where we can start talking about this metric with respect to customers and revenue retained.”
Related: Save Your Business From Churn: 9 Churn Risk Factors to Identify
7. Expansion Revenue
When customers add new paid services to an already paid account, that extra revenue is called Expansion revenue.
Expansion MRR rate= [(Expansion MRR at the end of the month) — (Expansion MRR at the beginning of the month) / by the Expansion MRR at the beginning of the month] x 100
Expansion revenue growth will decrease customer churn and increase LTV. This will in turn improve other SaaS metrics.
8. Net Promoter Score
Net Promoter Score (NPS) is a widely used measurement that asks respondents to rate how likely they are to recommend a product, service, or company to a friend or colleague.
NPS = Total % of promoters – total % of detractors
The Net Promoter Score helps businesses evaluate how well their service compares with their competitors. Net promoter scores can be used to identify any problem areas, improve customer experience, monitor loyalty trends, and increase revenue through referrals and upsells.
9. Leads Generated
Lead generation is attracting and nurturing prospects with the goal of converting them into customers.
For Podcast Hawk, Ray Blakney and the team focus on generated leads “We are a software that helps people get booked as a guest on podcasts on auto-pilot. By tracking the leads generated — i.e. podcasts booked — we are able to track all our most important metrics (new user sign-ups, system usage, churn, user success) all by seeing just one metric.” Blakney says.
Related: Blogging for Lead Generation: 23 Best Ways to Generate Leads from Your Blog
10. Annual Contract Value (ACV)
Annual Contract Value is the average revenue per customer contract for a year and excludes one-time fees.
ACV = Total monetary value ($) of the whole contract / Total contract length in years
When one customer signs a 5-year contract for $30k, your ACV is $6,000. Your ACV would also be $6,000 if you had 100 customers paying $500 per month.
Claire Westbrook, LSAT Prep Hero says “At my company, the annual contract value (ACV) growth rate is the most important metric to track when measuring performance. The ACV growth rate indicates how quickly we are growing our customer base and, more importantly, how much revenue we’re generating from those customers. A high ACV growth rate means that we are acquiring new customers at a rapid pace and that those customers are spending a lot of money on our products and services.”
11. Lead Velocity Rate (LVR)
Lead velocity rate is a measure of the growth in qualified leads from one month to the next.
Lead Velocity Rate = [(No. of Qualified Leads This Month – No. of Qualified Leads Last Month) / No. of Qualified Leads Last Month] x 100
LVR can be an excellent predictor of a company’s growth and revenues if it is calculated from month to month.
Ian Sells, RebateKey says “Lead Velocity Rate (LVR) It gives you a clear picture of the real-time growth of your qualified leads month by month. This gives you a glimpse of the future, giving you a more accurate projection of business growth. This is very important for most SAAS companies since we rely on recurrent revenue. This allows us to plan ahead more accurately and acts as a clear signal when we should act to improve our pipeline quality.”
12. Opportunity Stage Forecasting
Opportunity stage forecasting is a technique used by salespeople to break down their pipeline into stages. It aims to calculate the probability of winning a prospect depending on each stage of the sales pipeline.
Mark Daoust of Quiet Light says “We look at Opportunity Stage Forecasting, where we look at which stage our prospects are in the pipeline and then we are able to forecast the chances of closing the deal. We break the pipeline down into several stages, and the further along the sales pipeline the lead is, the more likely it will become a successful deal.
Depending on the stage they are in, we give each lead a percentage, for instance, a very new prospect may have a 10% closing rate, while a prospect who is in the meeting stage would have a higher close rate, say 50%. Using this method, it’s crucial to keep the pipeline up to date to get an accurate forecast.”
PRO TIP: Looking for ways to visualize your sales forecast data from HubSpot CRM? Watch the video below to learn how to forecast sales using HubSpot CRM & Databox.
Best Tools for Calculating and Analyzing SaaS Growth Rate
More than half of our respondents analyze their growth rates by using a centralized dashboard, like Databox. Others use tools like Stripe, Quickbooks, Profitwell, and Xero to analyze growth rates.

Let’s take a closer look at each:
Databox
A central SaaS growth rate dashboard like Databox is the best option for analyzing your growth rates.

Databox pulls all your data into one place, so you can track performance and discover insights in real-time. It integrates with tons of other growth monitoring tools like Stripe, Xero, PayPal e.t.c.

You can track, organize, and analyze financial performance to get a clear picture of revenue growth with our custom dashboard software for example.
Get started with our SaaS dashboard templates, or build your own custom dashboard.
Stripe
Payment APIs powered by Stripe allow businesses of all sizes to accept payments online.

You can use Stripe to analyze financial growth in SaaS.
Visualize your most important SaaS metrics in Databox by connecting your Stripe account here.
Quickbooks
Intuit’s QuickBooks is an accounting software package geared toward small and medium-sized businesses. The company offers both on-premises and cloud-based accounting applications that allow users to accept payments, manage and pay bills, and handle payroll.

Some of our respondents use QuickBooks to analyze their growth rate.
Profitwell
Using ProfitWell, users can see all their subscription and financial metrics in one place.

With ProfitWell Metrics, you can track essential metrics like revenue and subscription growth rate for free.
Connect your ProfitWell account with Databox and visualize your metrics in one place.
Xero
Xero is cloud-based accounting software for small businesses. You can connect it to a live bank feed to perform bookkeeping functions such as invoicing and payroll.

Close to 20% of our respondents say they analyze growth rate using Xero. If you combine that with the insights you get from using a small business dashboard software, you’ll be setting your business up for more success.
Visualize your most important metrics from Xero in Databox by connecting your account here.
Monitor Your Most Important Growth Rate Metrics in Databox
SaaS companies must sustain growth and retain customers for longer periods of time to break even. As a result, you should benchmark your growth rate to understand how you’re doing and whether any changes need to be made.
Unlike most other tools which monitor just one aspect of growth — financial, leads, traffic, or something else — Databox integrates with all your tools to give you a holistic picture of your growth rate in one place.
Get started with Databox today.


