


Table of contents
Great business reports are clear, concise, easy-to-skim, and don’t take hours to put together.
Unfortunately, many SMBs miss the mark when it comes to putting together reports. They forget one or more of the fundamentals, like:
- Who is reading the report?
- What’s the goal you are trying to achieve with this report?
- What context does your manager need?
- What’s the simplest way to present all of this data?
Once you have the basics in place, it is critical to templatize your reports, so you don’t need to spend more than an hour creating each one (like almost 93% of the SMBs we surveyed do).

In this post, we’re taking a much closer look at essential business report templates, including examples.

Let’s dive in.
- Financial report
- Weekly sales activity report
- Marketing report
- Website traffic report
- Project management report
- Annual report
1. Financial Report
When we asked our contributors which report templates they find most useful for SMBs, financial reports came in second, right after annual reports. That makes sense since when comes to creating business reports, it is helpful to start with the big picture — your company’s finances.
Other popular responses included annual report templates, marketing report templates, and monthly report templates.

For most businesses, there are three standard financial reports that all companies should monitor, including your profit and loss statement (P&L), balance sheet, and cash flow statement.
Adam Wood of RevenueGeeks starts off by sharing, “The profit and loss (P&L) statement (also known as an income statement) displays your revenue, costs, and expenses over a specific time period. Because the P&L provides the finest perspective of your bottom line, or net income, it’s commonly used to illustrate business lenders and investors if your firm has made or lost money over time.
Your company’s net income will also be used to calculate its taxable income each year. This is computed by subtracting your company’s expenses from its total revenue, which can be found in your profit and loss statement.”
Pro Tip: How to Stay on Top of the Financial Health of Your Business
Do you own and manage a small business? Then you know how much of a struggle it can be to stay on top of the financial health of your business on a daily basis. Now you can pull data from QuickBooks and HubSpot’s CRM to track your key business metrics in one convenient dashboard, including:
- Open deals and deal amounts by pipeline stage. Get sales data directly from your HubSpot CRM and track deals, deal amounts, deal stages, and dates from your sales pipeline.
- Key financial data. Track gross profit margin, open invoices by amount and by customer, paid invoices, expenses, and income from QuickBooks.
Now you can benefit from the experience of our HubSpot CRM and QuickBooks experts, who have put together a plug-and-play Databox template that helps you monitor and analyze your key financial metrics. It’s simple to implement and start using it now!
You can easily set it up in just a few clicks – no coding required.
To set up the dashboard, follow these 3 simple steps:
Step 1: Get the template
Step 2: Connect your HubSpot and Quickbooks accounts with Databox.
Step 3: Watch your dashboard populate in seconds.
Jeroen van Gils of EcomContent adds, “Being a business owner myself, I believe that the profit and loss statement also known as a P&L or income statement is the most important report for any business. This report tells you how much money a company makes, among other things. Details on where you spend money and where it comes from being included in a well-run bookkeeping process.
For instance, I can quickly review my P&L to see how much money I make from writing, how much money I make from advertising, how much money I spend on business travel, and how much money I spend on computer and internet costs. Each business would have different accounts for its own income and spending categories.”
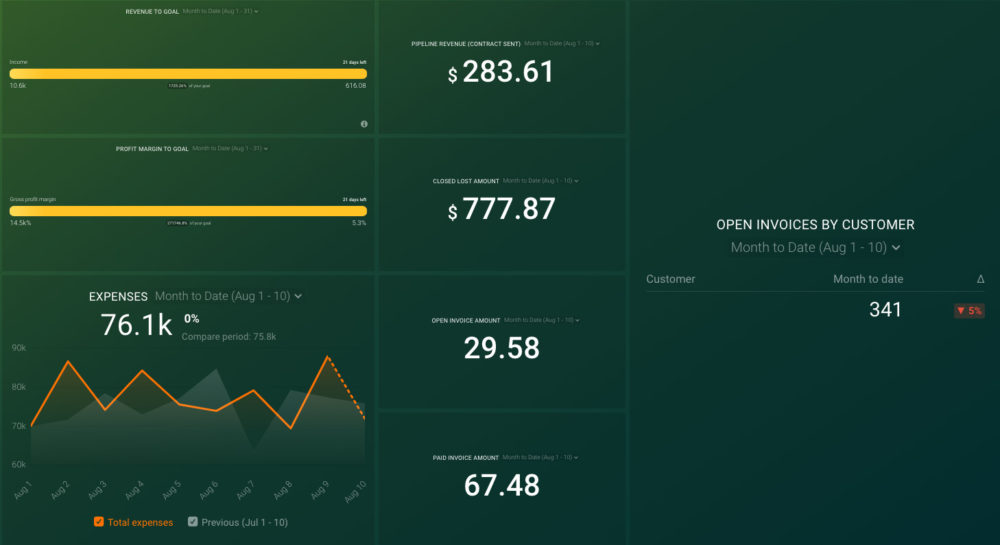
Here is an example of a financial report template from Databox. Quickbooks users rely on this dashboard to monitor business sales and expenses and stay on top of their company’s finances. You can browse more financial dashboards here.
2. Weekly Sales Activity Report
While a financial report paints a holistic picture of your business, drilling into your sales report generated from a sales dashboard software allows you to see your best and worst-performing products and services.
“A weekly sales report is so important because the management can check what the company’s weekly growth is,” says Paul Stein of Trusted House Painter. “They will be able to make informed decisions on keeping their sales force incentivized and which sales personnel need more training.”
For example, Alina Clark of Cocodoc adds, ”As a SaaS business, the Sales KPI report is the most important of all the reports we have in our business. Businesses depend on the sales team to fuel company growth.
Sales activity reports are crucial for any efficient sales team. On the other hand, the fact that sales KPIs are monitored with a business dashboard software and reported on a weekly basis creates the need for a systemized way of looking at things, and in comes the template. Having a KPI sales template eases the process of analyzing the sales process of the business. On the other, it also makes reporting easier for the sales managers.”
Here is an example of a weekly sales activity report from Databox. HubSpot users rely on this dashboard to gain insight into their sales pipeline, closed vs. won deals, and top-performing salespeople in a given time period. You can browse more sales dashboards here.

3. Marketing Report
Your marketing activity report can allow you to see which marketing strategies are generating the most brand awareness and/or leads.
Ryan Rottman of OSDB Sports explains, “Marketing report templates can be extremely useful when you’re plugging in new information on a consistent basis. Plus, your marketing strategies completely influence your ROI, as well as your bottom line. So, being able to create and understand these reports in a straightforward, simple manner can be a game-changer.”
For example, George Belletty of Mango and Coffee says, “Being a marketing specialist, I believe that marketing reports are equally important. You can argue that SMBs do not have that huge marketing budget, but they do have an online presence. Every SMB should prepare a Website Traffic and Social Media Report. These reports help SMBs analyze their consumer base and engagement levels.”
Here is an example of a marketing report from Databox. HubSpot users rely on this dashboard to get a clear understanding of how many visitors are converting into leads from their website. You can browse more marketing dashboards here.

4. Website Traffic Report
Many marketers choose to drill down further and also create a website traffic report.
“The two most consequential reports for SMB owners are website traffic + conversion reports, and social media reports,” says Jonathan Zacharias of GR0. “Specifically, website traffic + conversion reporting will help brands and companies make informed decisions on marketing strategies.
High traffic and low conversion? Try targeting your product to a different audience. High conversion and low traffic? Take your pre-existing customer persona and scale your business with digital ads.
Meanwhile, using social media reporting tools is absolutely essential to growth. Ideally, brands should be tracking weekly/monthly follower growth, weekly/monthly impressions, and likes + comments per post. As social proof is directly correlated to the overall performance of a company, aim for 5% MoM growth across all KPIs.”
Katherine Brown Brown of Spyic adds, “A Google Analytics report is a must for any SMB owner, especially in this era of digital adoption. While it may not be a requirement for shareholders or to tell you how much funds are in your account, it is vital. It lets you know your website visitors, what they search for, how many visitors are there, and demographics.
The troubleshooting indicates where most people lose interest in your website, so you make it more appealing and lead them to make purchases. Even better, small businesses will enjoy the powerful resource, set up a goal or event tracking, and get customized reports to suit your needs at no charge at all.”
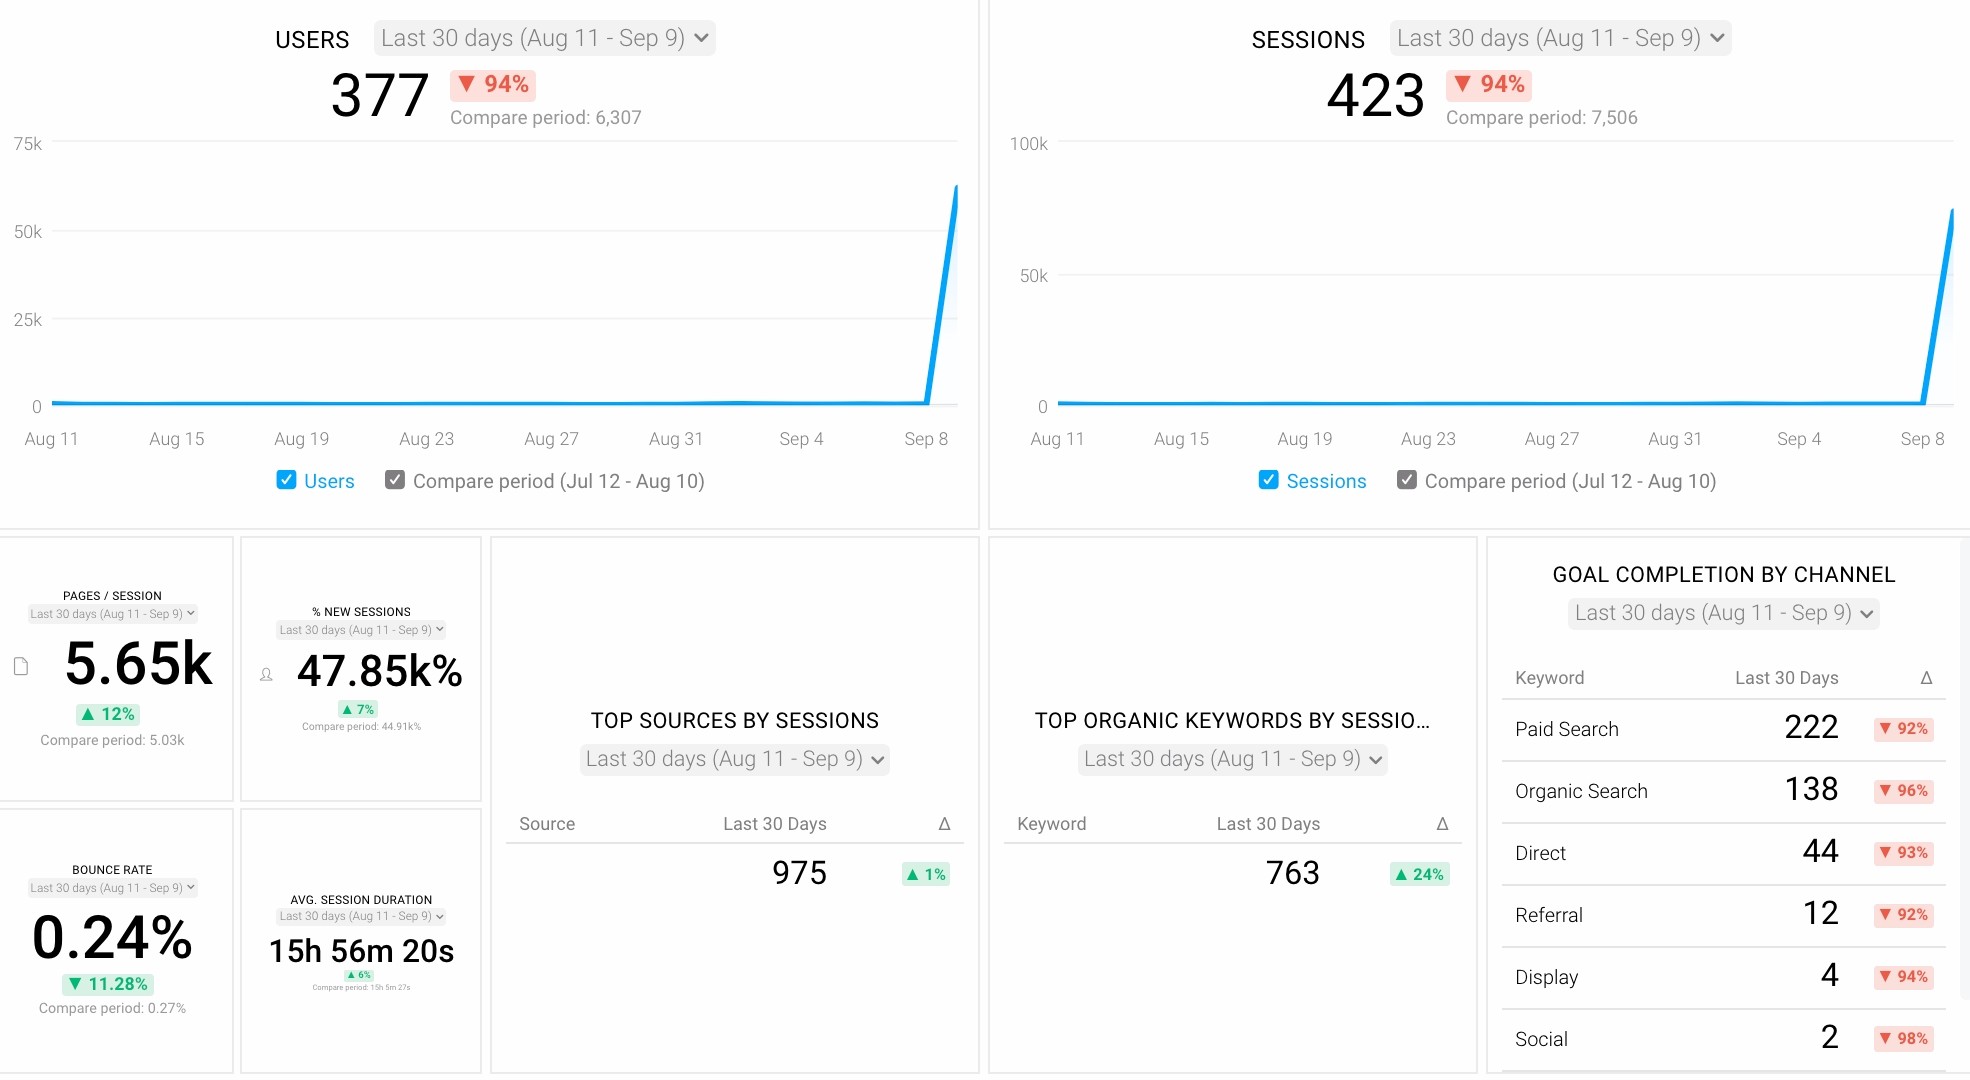
Here is an example of a website traffic report from Databox. Google Analytics users rely on this dashboard to track their most important website engagement metrics such as the percentage of new vs. returning users, bounce rate, time on page, and more. You can browse more web analytics dashboards here.
5. Project Management Report
Up until this point, we’ve only talked about report templates for specific results (i.e. finances, sales, and marketing). It is only critical to track inputs like how effective your team is working on large company initiatives and projects.
“Project status reports are critical for communicating updates on what you’ve accomplished and what’s still pending,” says Paige Arnof-Fenn of Mavens & Moguls. “They also help you highlight current and potential issues on the horizon which helps encourage transparency and build trust with both your team and clients.”
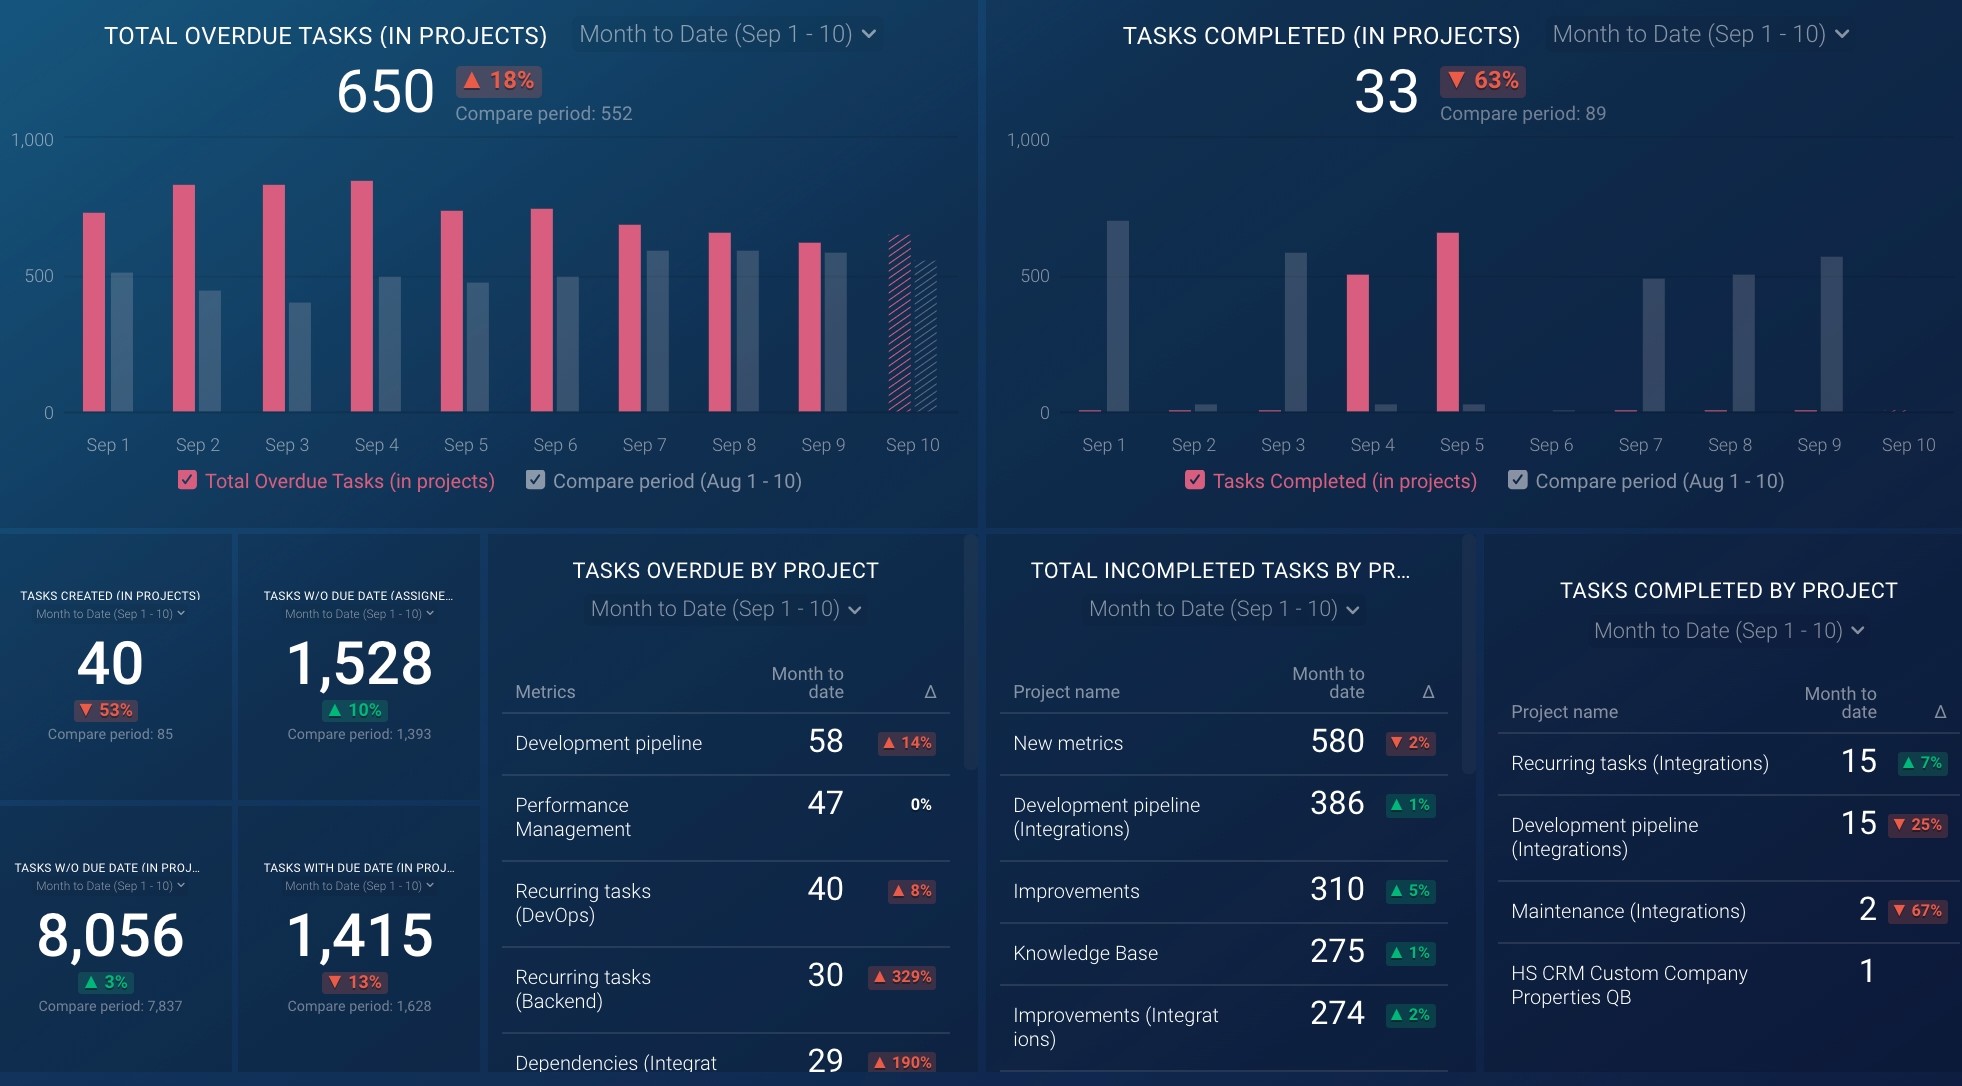
Here is an example of a project management report from Databox. SMBs that use Asana as their go-to project management software can gain visibility into all of their key milestones and tasks within projects with this dashboard. You can browse more project management dashboards here.
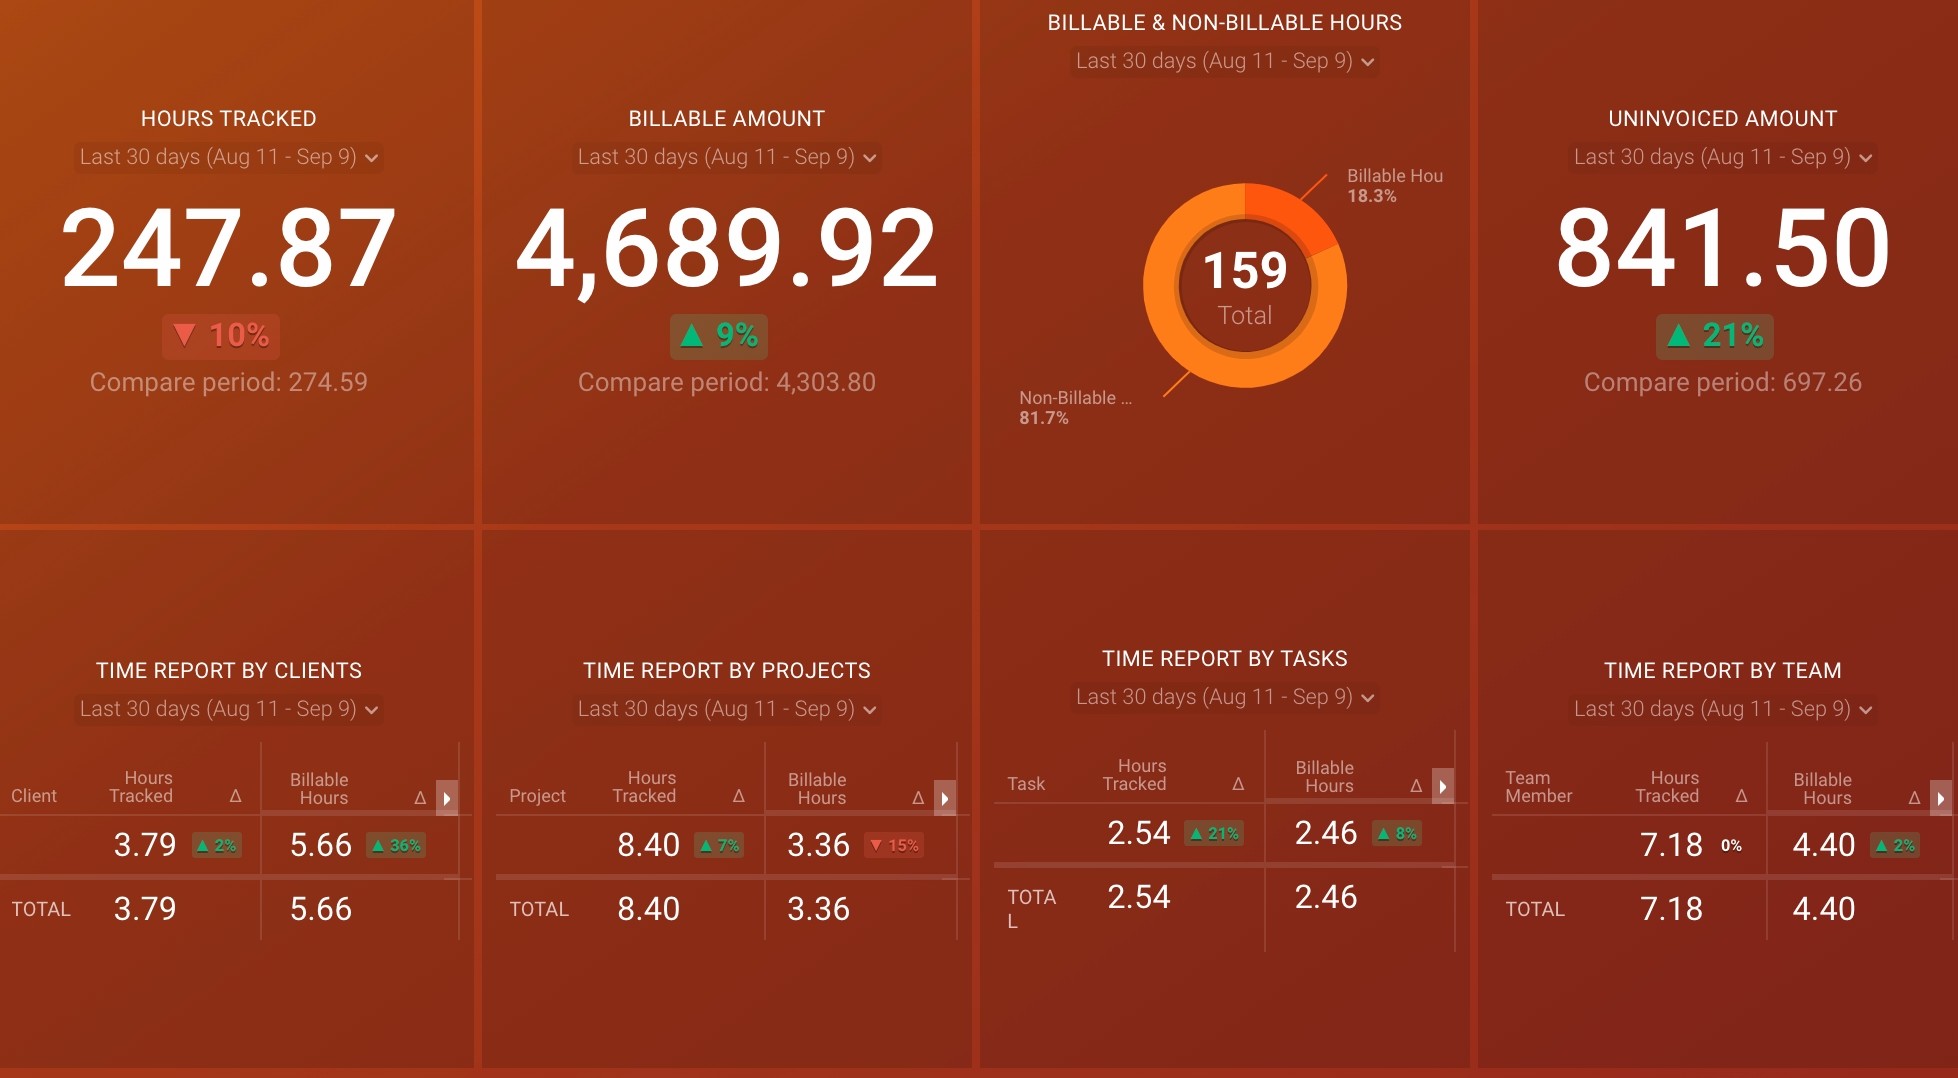
In addition, if you have a client service business, like an agency, and charge based on billable hours, you may use project management tools like Harvest to drill down even further by creating employee productivity dashboards.
This is an example of an employee productivity report that helps agencies keep track of total billable vs. non-billable hours from Harvest. Browse more employee time tracking dashboards here,
6. Annual Report
Savvy general managers, operations managers, or COO will package all of these reports into an overview report on an annual basis for the CEO and CFO. So, they can get a high-level overview of the business in just 10-15 minutes.
Alex Uriarte from 1-800 Injured shares why are annual reports important: “I believe that the most important report for SMB owners is the annual report. An annual report’s main purpose is to show you what your organization has accomplished in the previous year. If the financial data are in your favor, you may also use this type of performance report as a marketing tool to get people excited about your company, especially potential investors and customers. Annual reports to the Securities and Exchange Commission are required by law for publicly traded companies (SEC).”
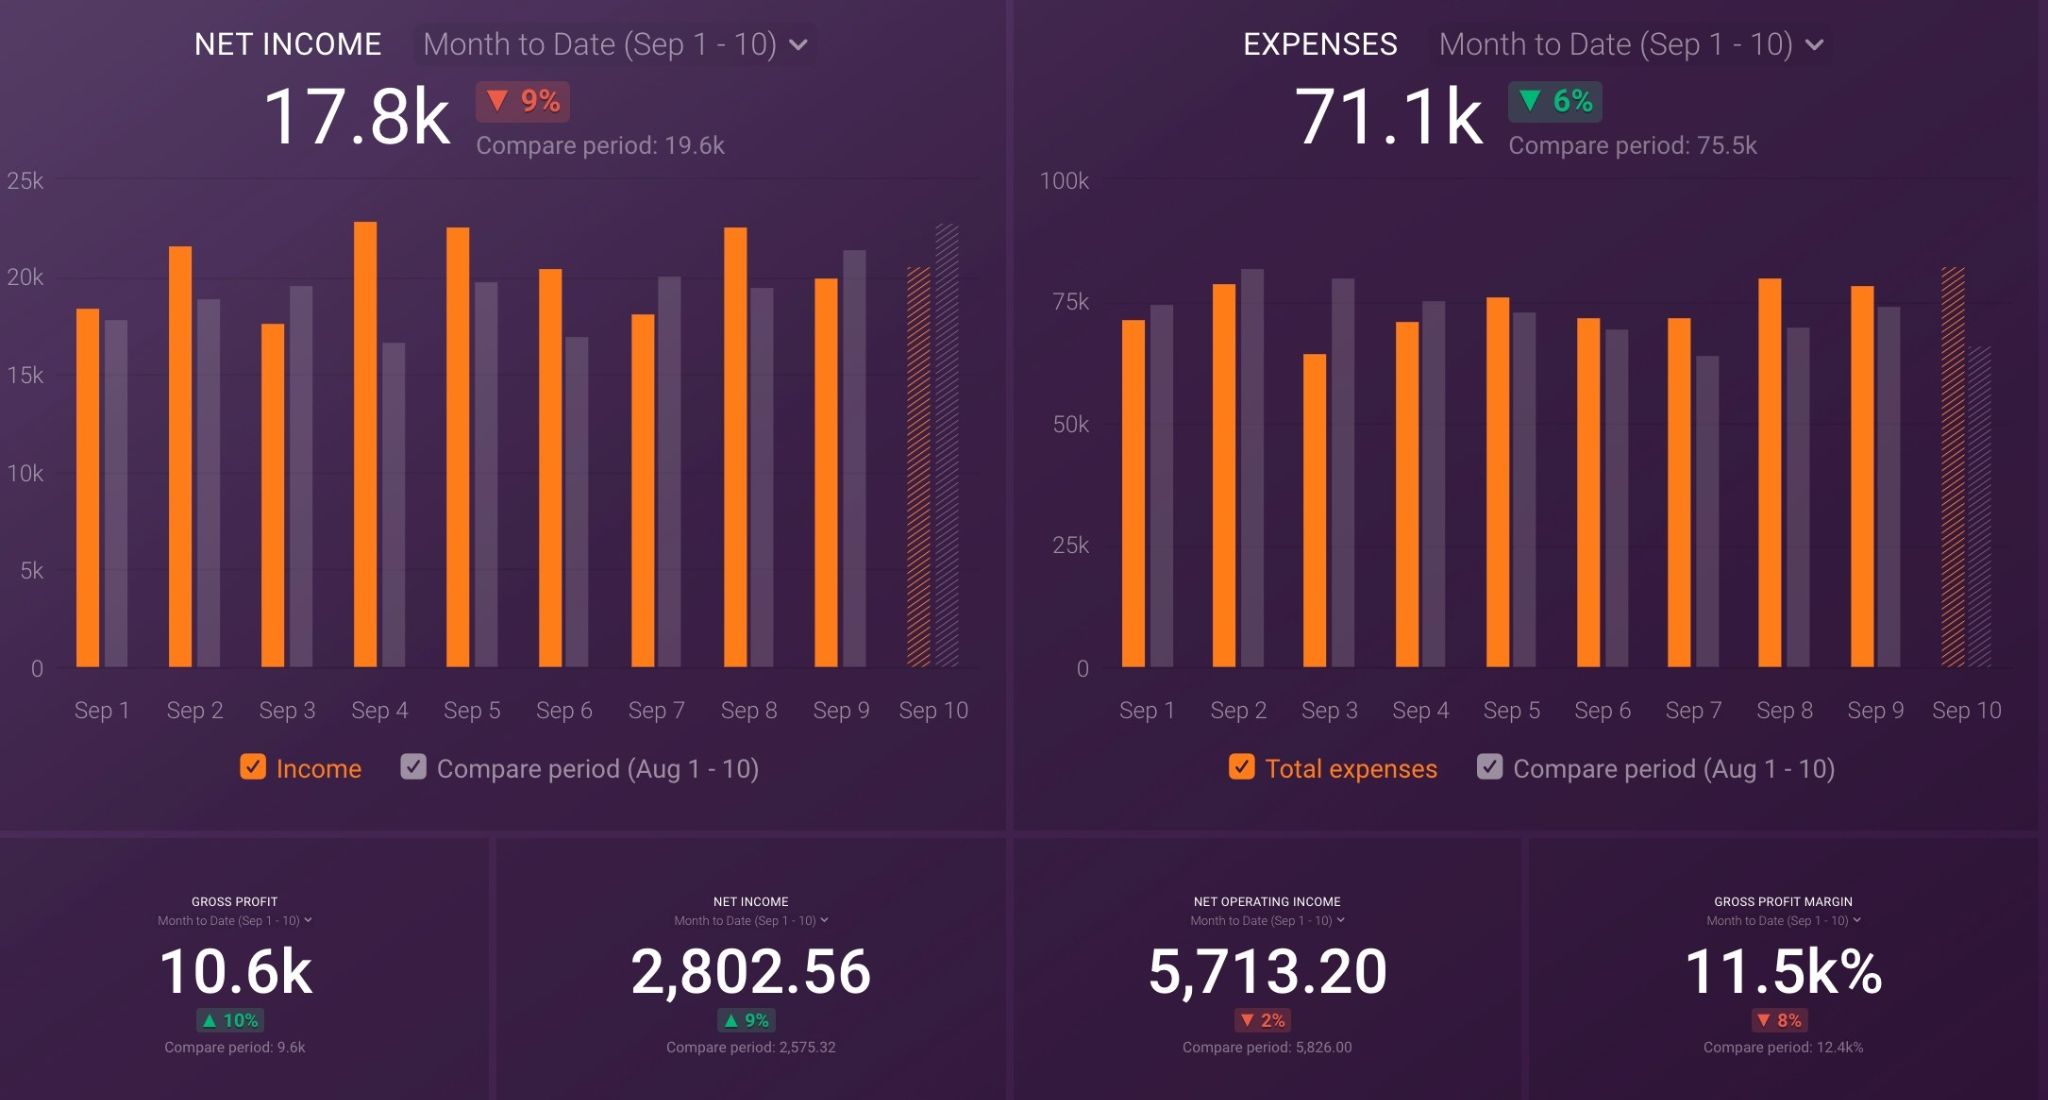
Here is an example of an annual marketing report from Databox. This dashboard gives an overview of the annual metrics from your HubSpot account, including sales, email, traffic, and contacts. Browse more business dashboards here.

In sum, getting into the habit of creating weekly or monthly business reports can give you a holistic view of the business at any given moment as well as capitalize on trends and get ahead of potential problems before they snowball out of control.
If you want to see more dashboard examples for accurate financial performance reporting, check out our public templates.


