


Table of contents
Many departments and organizations choose to keep a careful eye on marketing functions and goals through weekly reporting on one or more business metrics. Doing so not only helps teams and individuals course-correct with great agility — it can also help reveal trends in the market, and keep businesses evolving in step with their customer base. No wonder marketing is the most monitored and reported operation – as Databox’s state of business reporting revealed.
But what is the best metric to use when creating a weekly marketing report? There are many metrics available, each with different merits depending on your industry, product, business model, growth stage, and business goals. Which to use will depend upon what you’re looking to reveal or achieve.
We asked 60+ experts to discuss their number one metric for weekly marketing reporting, why they chose it, and in what context they were using their chosen method. They gave us incredible insights into how they let weekly reporting shape their decision-making and guide their marketing efforts.
The wealth of insight from our respondents broke down to several overall themes, and several include multiple of these in reports. Click the links below to explore a particular idea, or scroll through to learn everything our experts shared.
- New Leads
- Conversions
- Website, Search Rank, Email, and Social Stats
- KPI Progress, Wins, Results, and Strategy
- Statistics, Summaries, Data, and Performance
- Cost Analysis and ROI
- Customer Service and Calls

7 Metrics to Include In Your Weekly Marketing Report
1. New Leads
Of all the methods discussed by our respondents, analyzing the number of fresh leads in the week was by far one of the most popular metrics available. It makes sense: The number of fresh eyes on your product or service, the higher the pool of potential conversions you’ll have access to.
Brian Koenig of Vortala reaches for this metric to take a pulse of marketing success. “If I had to choose just one,” said Koenig, “I would say it’s the number of new leads generated from your marketing efforts. The reason it is important isn’t just to reveal how you are doing in general. It tells you whether or not the marketing campaigns you’ve been running are effective.”
Nicole Turner of Chief Martech Officer says, “Every weekly marketing report should include the new contacts created that week. This is not only essential for lead nurturing and sales, but to keep your database clean and organized.”
Some, like Rajnish Kumar of HackerEarth, want more granular data on the source of leads, choosing not only to track leads but identify their sources. “The most important thing for weekly marketing reports are: Lead generation and stages of leads (Top of the funnel leads, Middle of the funnel lead, Bottom of the funnel leads, MQLs and SQLs)
Says Kumar, “Leads from the different sources so that better strategies can be made to optimize the non-performing channels. It also keep in check where the problem lie whether it’s content, landing page, ad copy or targeting.”
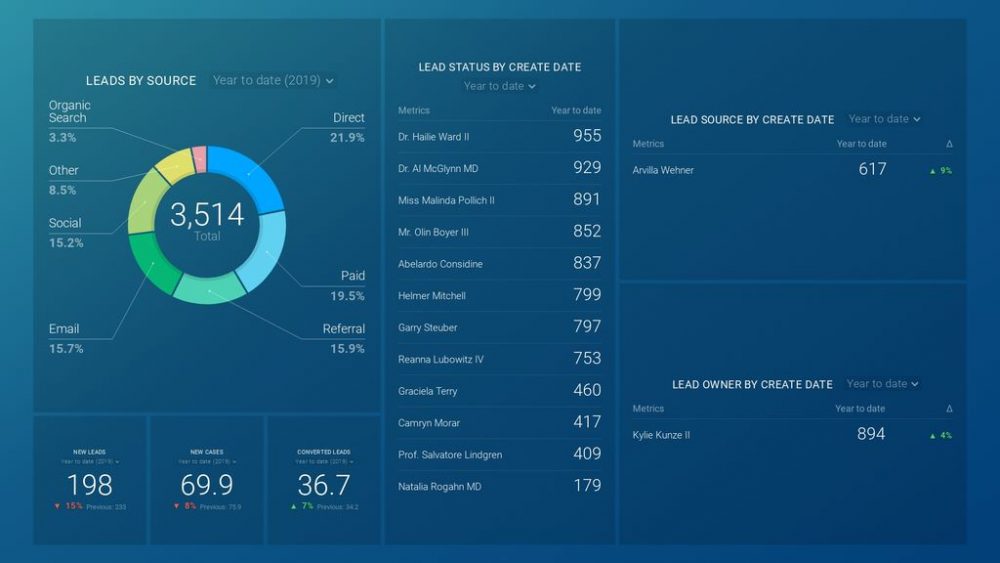
Use this marketing automation dashboard to gain valuable insights about the amount of traffic generated from your marketing campaigns.
Editor’s Note: Tracking leads for weekly marketing reports can be simple when using the Salesforce Leads dashboard. Track lead source, creation dates, and conversions to help you understand your lead generation efforts better with one informative view.
Christopher Hutchens of SmartBug Media also takes the lifecycle approach. “Leads by lifecycle stage is an important metric for weekly reports as this gives you the number of top, middle, and bottom of funnel leads, giving quick insight into conversion rates for that week. In addition to metrics, every weekly marketing report should recap which deliverables were completed that week, and what’s coming up next week.”
“Every weekly marketing report should include a section about leads, including where they are coming from and how they are occurring,” according to Lauren Gast of Truck Driver Institute. “Although this may seem obvious, it is especially important for a multi-location business like ours so you can get a better understanding of what locations need the most digital marketing help. Lower performing locations will stand out and you can use this report to give you insight as to where you need to allocate your budget for future weeks.”
Amrita Jaswal of RestroApp breaks down the leads by origin, explaining that “Differentiating the leads per channel help in analyzing which ones are bringing in the most leads that may shed light on under-performing or on the contrary, super-performing channels that may need more attention and investments.”
Lead tracking gets at the heart of what grows business, says Jonathan Aufray of Growth Hackers “What’s important for a business is to generate leads and increase revenue. The number of followers you get or your website traffic isn’t that important. For every weekly report, you want to include the number of leads you got and most importantly the growth in comparison with the previous week.”
The need to break down lead sources comes from the variability of marketing and testing strategies, says Luke Wester of Miva, Inc.“Most companies are relentlessly A/B testing. Things like copy edits, new design, new content, and new ads can impact leads—sometimes for better, sometimes for worse. Monitor your weekly leads. If you find a significant delta from the past week, dig into each channel and see where the variance is coming from.”
Richard Burns of CONTENTED.marketing and John McTigue of IntentData.io both track pipeline conversion rates on a weekly basis. Burns looks at “Marketing contributions to pipeline” and analyzes the journey from MQL, to SQL, to happy customers. McTigue goes on to say, “For an established B2B brand, it has to be the number of marketing qualified leads (MQLs) generated. Otherwise, what’s the point? There’s the saying that ‘all roads lead to Rome’, and in B2B marketing all channels should lead to the number and quality of leads generated. For B2B SaaS, you can switch MQLs for paying customers and customer lifetime value (CLTV).”
Differentiating lead sources can be a step to improving underperforming channels, says Meghan Hultquist of HQdigital, who explains that “doing so allows you to hone in on each individual channel to apply conversion rate optimization tactics, which amplifies results relatively quickly.”

2. Conversions
The other wildly popular metric for delivering actionable data on a weekly marketing report is conversion rates. Knowing how many customers moved along the funnel, and how many ultimately decided to invest is a big part of understanding the effectiveness of your marketing mix and approach.
Stuart Leung of Relaxation Company rates success by the conversion metric in weekly reporting. “Every marketing report should include the conversion rate of landing pages. This will help you evaluate the success of how many leads can be generated.” The logic of this is in the ability to course-correct, says Leung. “ If you find that your landing pages aren’t converting successful, you can make small changes and test them weekly to see what’s working and what’s not.”
Stefania Borchia of Stefania Borchia Consulting says, “In short, every report should answer the question ‘How good were the marketing tactics in delivering business results?’ In addition, the report should include follow-up actions to optimise average performances or solve poor results.”
“Therefore, every marketing report should include conversions and micro-outcomes. Conversions represent a business goal achieved via marketing tactics (for instance, a newsletter sign-up or an online purchase), while micro-outcomes could be anything that signals if the marketing campaign is heading in the right direction (for instance, bounce rate, page depth or avg. time per session).”
Tony Mastri of MARION Marketing regards the conversion metric as closely tied to fiscal health. “Every weekly marketing report should include customer conversions. Regardless of your industry, investing in marketing needs to generate a return at the end of the day. While branding, impressions, clicks, and even leads are important, your business will close without paying customers.”
Says Mastri, “Some businesses have a very long closing process that could take weeks or months to generate a paying customer (making this difficult to gauge monthly), but many do not. By tracking customer conversions weekly, you’ll know about potential deficits before your monthly or quarterly meetings. This helps you stay proactive and identify the need for strategy shifts before it’s too late.”

This sentiment also rings true for Quentin Aisbett of OnQ Marketing, who wants, “You can’t afford to wait up to a month to find out that conversions are slipping”
Kevin Olson of Capitol Tech Solutions tracks conversions with the help of outside tools such as paid ad tracking and Analytics. “Our weekly reports are usually for our paid advertisement clients. For those reports we always include number of conversions. The conversion is based on what the goal of the campaign is. We use either Facebook Pixel or Google Tag Manager to set up conversion tracking.”
This approach also works for Olan Ahern of VGW, who calls tracking conversion, “essential to your digital marketing success to account for every single conversion you get.”
“We will typically report weekly on the content that is helping us convert (new and pre-existing) and where it drew in traffic from,” says Dan Rice of iamdanrice. “From there we can drive forward not just our strategy, but get a feel for the tactics that work with our audiences.”
Krzysztof Surowiecki of Hexe Data says of this revealing metric, “Conversion monitoring is crucial in the weekly context because it shows the performance of your business. Therefore, it allows you to compare weekly to weekly results. Thanks to this, you can quickly capture negative trends and optimize your actions.”
PRO TIP: How Are Users Engaging on My Site? Which Content Drives the Most Online Activity?
If you want to discover how visitors engage with your website, and which content drives the most engagement and conversions, there are several on-page events and metrics you can track from Google Analytics 4 that will get you started:
- Sessions by channel. Which channels are driving the most traffic to your website?
- Average session duration. How long do visitors spend on your website on average?
- Pageviews and pageviews by page. Which pages on your website are viewed the most?
- Total number of users. How many users engaged with your website?
- Engagement rate. Which percentage of your website visitors have interacted with a piece of content and spent a significant amount of time on the site?
- Sessions conversion rate. How many of your website visitors have completed the desired or expected action(s) and what percentage of them completed the goals you’ve set in Google Analytics 4?
And more…
Now you can benefit from the experience of our Google Analytics 4 experts, who have put together a plug-and-play Databox template showing the most important KPIs for monitoring visitor engagement on your website. It’s simple to implement and start using as a standalone dashboard or in marketing reports!

You can easily set it up in just a few clicks – no coding required.
To set up the dashboard, follow these 3 simple steps:
Step 1: Get the template
Step 2: Connect your Google Analytics account with Databox.
Step 3: Watch your dashboard populate in seconds.
3. Website, Search Rank, Email, and Social Stats
For some of our experts in growth mode, following the website and social data tendered many insights that benefit teams on a weekly basis. There were quite a few metrics within this category, and many times users would employ several.
Many experts looked at traffic statistics and changes as a signpost of marketing health.
Editor’s Note: Concerned about the flow of traffic to your website? Get comprehensive data on your page views, visitors, organic search, and more with the Google Analytics Website Traffic dashboard.

William Chin-Fook of Pickfu says that “every weekly marketing report should include is keyword rankings for organic drivers. Obviously, this is only important if you’re running a digital campaign, but who isn’t now a day! When the keywords fluctuate, there should be a proportional fluctuation in traffic as well. Keyword ranks, are the basis of all organic drivers and therefore should be tracked very closely.”
Anand Iyer likes to analyze returning visitors for context on marketing goals and performance. “Percentage of returning visitors to your website, landing page or blog is the [metric] every weekly marketing report should include.”
As Iyer explains, “According to the rule of seven marketing principles, your prospects need to come across your offer at least seven times before they take action. Thus, the percentage of returning visitors is a great way to analyze how many users are returning visitors vs new visitors.”
Charlie Worrall of Imaginaire Digital turns an eye to the visitors who don’t stay awhile. “A weekly report should include the bounce rate of that week and have it compared to the previous period. In doing this, you’ll be able to watch the bounce rate closely and determine whether or not you’re having a positive impact on a website.”
Others, like Damien Martin Of Shufti Pro, keeps an eye on the health of email marketing campaigns in analyzing weekly success. “I try never to miss out on email marketing metrics. Click-through rates are extremely important for me to understand if we’re able to arouse interest in a prospective buyer at the awareness stage.”
Others still look at social media for answers. Luke Whelan of DFY Links says, “I always include metrics detailing brand engagement to include in a weekly report. Likes and comments on social media are the obvious ones. However, I always include results relating to story views—Snapchat, Instagram and Facebook stories are a perfect way of evaluating content engagement.”
One tip Whelan shares, “On your Instagram Business stories, there’s a bounce metric showing how many people clocked out before reaching the end of your story. While people not liking posts doesn’t necessarily mean your audience doesn’t like them, story disengagement gives you a good idea that the type of content in the story isn’t working.”
Jillian Corkin of HubSpot looks at demand and funnel performance, as well as the return on paid social, to gather intel. Corkin analyzes, “demand generated (projected – new leads created) by type + channel; demand generated (actual – of what’s closed + influenced by mkt) by type + channel + product; funnel of visitors/engagements —> demand generated –> work rates –> close rates.” Corkin says this “helps keep an eye on the ratios and identify gaps between strategy & ops early.” Corkin also looks to competitive SEO + keyword ranking/performance to assess the market + googles search algorithms”
As with leads, many experts need to know the source of their traffic in determining what steps to take and what channels to build out. Chloe Thomas of eCommerceMasterPlan examines source breakdown, explaining that “to only look at website performance overall is a waste of time, you need to see the building blocks underneath the overall performance – how much came from email, from twitter, from paid ads etc.”
By the same token, Rajat Chauhan of TutorEye Inc. recommends users look at Traffic Metrics by Channel and Device. “It’s imperative that you understand where your web traffic is coming from and how it performs so that you don’t waste time or money developing unsuccessful channels. Important metrics to include broken down by channel & device include: Bounce Rate, % New Session, Top Pages, Email Campaign Performance, Top Referrers. Moreover, It’s always a good idea to highlight any future plans you have for marketing campaigns.”
Just as important as the traffic coming in, are the links heading out, says Alexandra Zamolo of Beekeeper “If you are implementing any type of outreach or link-building strategy, it’s important to see where those links are going, including information such as their Domain Authority ranking and their social media following. This way, it can help with your outreach process in the future, as you begin to understand what’s working for you and, sometimes more importantly, what isn’t.”
Traffic volume change over time is important to Daniela Andreevska of Mashvisor says, “You should have a look at whether the traffic to your website has gone or down or stayed the same compared to the previous week, where it came from, and whether there were any major differences in channels breakdown. You first need users coming to your website in order to turn them into leads and eventually customers. If you see any major drops in sessions, you should act right away to avoid a negative impact on sales later on.”
Colin Mosier of JSL Marketing & Web Design agrees, “Including these metrics allows you to show if traffic is increasing compared to the previous week. It also will allow you to track which of your marketing efforts is succeeding. For example, if you try a new technique on social media and you notice a spike in traffic from social media channels, you have struck gold and can optimize future content accordingly. In addition to normal traffic, it can be helpful to track new vs returning visitors. If your goal is to attract new clients and you are seeing an increase in new users, you are doing something right!”
Jordan Terry of TorHoerman Law also follows the ebb and flow of traffic. “Weekly reports should include website & social media traffic fluctuations and interactions over the course of the week. This allows you to determine what actions help to increase traffic and what actions resulted in decreased traffic so that you can avoid them in the future.”
Following the customer’s path through the website can reveal pertinent info, according to Osiris Parikh of Summit Mindfulness. “A metric to add into every weekly marketing report is pages per session. This determines how many pages on average a user will visit before exiting your site. A low pages per session may indicate your website is hard to navigate, or you do not have content interesting enough to warrant attention.”
Loren Howard of Prime Plus Mortgages keeps it simple by looking for traffic indicators at the source. “A weekly marketing report should include google rankings, they need to see why your keywords are going up or down!”

4. KPI Progress, Wins, Results, and Strategy
Keeping an eye on your major marketing directives is an excellent way to deliver weekly insights on your success. For this reason, some experts choose to use KPIs, wins, results, or strategy analysis in determining success and future courses of action.
Lee Dobson of Bulldog Digital Media says, “Depending on what the main KPI of the project is, the report should focus on that. So for eCommerce,” says Dobson, “revenue and conversion rate is going to be a leading driver for performance, for lead gen, how many conversions/signups we achieved.”
Carl Pantaleon of The Kidd Group explains that “it should be your KPIs (Key Performance Indicators) which you set on your campaign. For example,” says Pantaleon, “in our campaign which is SEO, we have a weekly marketing report of how many obtained backlinks, outreached webmasters.” Focusing your efforts on the KPIs in place makes it more likely those goals will be realized.
Lisa Nichols-Calabro of Bloom Ads concurs, including in their weekly reports “insights into the campaign’s performance that ensure KPI’s are being met every week.”
Fin vs Fin’s Healy Jones agrees with examining your proximity to the target. “Progress against your sales goals – marketing is about more than just leads, you need to help hit sales targets too!”

Good news travels fast, and it can greatly improve morale. For this reason, Jeanne Hopkins of Lola.com chooses to include in weekly marketing reports, “A big win to celebrate the success of the entire team/company such as a product launch with the associated metrics that support sales, marketing, and product as the ecosystem for success.”
Sometimes a weekly sales report is as simple as outlining action and results. “Sean Si of SEO Hacker, says, “Simple enough, the marketing report should include sufficient data that highlights the results of the marketing tasks we did and effectively communicates the outcome.”
Ramey Miller of Text Request also keeps an eye on not just the goals, but the output supporting those goals, “You should always include what the marketing department has produced that week. Such as Number of videos, blogs, social posts, etc. This serves as a way to show the team and others that things are moving forward in ways of content.”
Erin Presseau of SilverTech puts it simply. “Insights! The takeaways you’ve deduced from the data. The changes, enhancements or optimizations you plan to make and why. Too often, I see reports that include just lists of numbers and metrics with no recommendations or next steps, but our value as marketers is in reading and interpreting the numbers so we can make positive changes.”
Sometimes it helps to look at progress across longer intervals, says Alice Corner of Venngage. Corner suggests that “every weekly marketing report should include [week over week] WoW improvements. Numbers are useful for the specifics but can be meaningless without context. Always include information about the previous week, or the weekly average so that you have a better grasp on the bigger picture.”
Ryan Patterson of SeniorAdvice.com also looks at the longer-term fluctuation to determine the best course. “You should always be looking at week-to-week rolling averages. This can be for web traffic, ad clicks, customer acquisitions, or any other metric. This is enormously helpful not only to see your progress (or lack of) over time, but to help detect seasonal patterns, technical issues, etc.”
For Zarar Ameen of CANZ Marketing, it really comes down to the motivation behind all the numbers. “You can choose to include whatever metrics you deem suitable in your weekly report. However, anybody can get into your ad account to peep into results.” Says Ameen, “What they won’t understand, looking at your account is the rationale behind a particular campaign. They won’t know how you think the campaign would benefit them. They won’t understand your strategy to make up for the loss if the campaign doesn’t bring the anticipated results. So, you need to include the background reason, success rate, and future corrective actions in your report.
Editor’s note: Did you know that with Looped Dashboards in Databox, you can connect multiple dashboard reports together in one centralized report and seamlessly share it with others? There is no need to present 10+ reports during your meetings. Get started today.
5. Statistics, Summaries, Data, and Performance
The numbers don’t lie, but they do tell a story. Many of our experts rely on the data obtained from their marketing reporting software to review weekly performance.
For eCommerce users like Kuri Diaz of Best Price Nutrition, this means a sober assessment of your product numbers. “I would say the top 10 performing products and top 10 non-performing. This way you can monitor your top products, change descriptions to get more clicks and sales.”
Sarah Carroll of BreakGlass Consulting looks to the traction of the marketing department through the lens of the weekly marketing report. “Weekly we need to know where momentum is. What is growing, declining, changing in conversion? Pure countable stats are not nearly as important as trendline data so that your marketing can be agile and you can adapt to what your customers are showing to be working.
“This metric could be by marketing channel but should show unique visitor growth, unique conversion growth, and unique revenue growth over time. Week/week stat will not give you as much insight as a three-month trendline looking at daily performance.”

Social Engagement stats are important to Avinash Chandra of BrandLoom, who says, “Weekly Marketing Reports should have a performance record and statistics on Social Media profiles and campaigns. There should also be tracking of web traffic via Google Insights, especially for new content.”
Reuben Kats of Falcon Marketing, LLC. reminds those reports to serving clients that transparency is important, “A summary and highlight page of what was done every day or week will keep your client or employer in the loop of things and will keep things straight forward. Make sure the analytics are always up to date and show them the results. When it comes to advertising and marketing the clientele wants to know where their hardworking dollars are going to. In order to keep their trust and loyalty, one needs to send over some kind of report or analysis.”
Laura Gonzalez of Audi Plano also takes a high-level approach, recommending “A Summary or Overview. I feel like these are often overlooked. It’s great for upper management to and those who will be reviewing the report from a holistic perspective. It gives them a good idea of the performance without all of the industry jargon and easy to understand format.”
The summary approach also works well for Colton de Vos of Resolute Technology Solutions, who says, “Weekly marketing reports should include a summary of all high-level stats from the primary marketing channels that your organization invests time and money into and more advanced insights into new leads or developments.”
“If your business invests in digital marketing, valuable stats include number of website visits, form fills, social media engagements (paid and organic), search rank change, AdWords and display advertising metrics, and email marketing subscriptions and conversions.”
“In my experience,” says de Vos, “I’ve found it essential to couple the summary of all marketing metrics with insight into that week’s outliers. If there were major increases or decreases in certain areas, use analytic tools to investigate why and then provide that insight so whoever gets your weekly report gets the full picture they may otherwise miss.”

6. Cost Analysis and ROI
The best traffic in the world loses a bit of its luster when it cost a fortune to attract it. For this reason, our experts also highlighted cost metrics in their most useful tips.
James Rice of WikiJob says that, at minimum, “Every weekly marketing report should indicate return vs marketing spend.” Anna Toletteo Synthesio looks at “Cost per lead (CPL) for ads and campaigns run that week,” and David Peterson of HealthMarkets says, “I always recommend focusing on bottom-line metrics such as Cost-Per-Sale – as opposed to vanity metrics like impressions.”
Steve Foley of Bulk Memory Cards also likes analyzing CPC, explaining, “The performance of digital marketing can change dramatically from day to day so it’s important to monitor it weekly. Doing it on a monthly basis can mean it was underperforming for three weeks without anybody knowing that was the case.”
The Advisor Coach James Pollard looks straight to the bottom line when evaluating weekly progress. “Every weekly marketing report should include is how much money was made as a result of marketing efforts. I’m a strong believer that all marketing should be tracked with a marketing dashboard software and optimized to improve ROI. For example, if you’re running an ad campaign on Facebook and it’s set to optimize for purchases, the weekly marketing report should include how many purchases were made as a result of that ad.”
7. Customer Service and Calls
If the customer is always right, then it stands to reason the data they reveal is also highly reliable. For this reason, Darrin Giglio of North American Investigations says, “I like to see the number of inquiries our offices get. This tells me so much about how our public relations and marketing campaigns are doing to make people aware of us and our services. Even if we can’t help them or offer them the type of services they want, it’s important to me that they approached us to find out.”
And Mike Golpa of G4 by Golpa agrees, saying “One thing I think every marketing report should track customer service stats. The ‘after the sale’ interactions that may point to issues with the sales, delivery, or customer education processes.”
Editor’s note: Are you constantly sharing links to multiple tools or reports for people in order for them to get a full view of how things are going? With Databox, you can stream dashboards of important metrics from any department to your TV and have all data accessible in one place, on demand.
We hope you’ll consider integrating these powerful metrics to track in your marketing dashboard and drive weekly reporting. The insights they provide can have an immediate positive impact on growth, individual contributor success, and your bottom line. Harnessing the power of insightful metrics can serve managers and organizations across every industry, stage, and business model.


