


Table of contents
How do you measure the success of your marketing team?
According to the Winterberry Group, the average marketing team uses 12 distinct tools in their daily jobs.
And according to the 2017 Internet Trends report, the average enterprise marketing team uses a total of 91 marketing tools.
Marketers have no shortage of data at their fingertips. But how they approach Marketng Reporting makes all the difference.
And therein lies the issue – the tools will not highlight the metrics that will actually grow your business. That part is up to you.
And with all the noise coming from that many tools, it makes prioritizing specific marketing KPIs that much harder.
Fortunately, a few digital marketing KPIs seem to be popular among users on the Databox platform.
We analyzed data from our own users, and mixed in some of our own domain expertise, to compile this list of 10 marketing KPIs that can form a good starting point for any digital marketing team to track in their marketing dashboards.
The Definition of a Marketing KPI
So what’s a key performance indicator (KPI) in the first place?
A KPI is a metric that will help you understand whether you are accomplishing your goal (or not.)
Let’s say that your company wants to increase revenue by 20% this year. Do you know which marketing activities will lead to that goal?
It could be, “Grow email list by 20%”, or “Grow website traffic by 30%” or even “Increase time on site by 20%”.
Those are potential KPIs– metrics that will determine your company’s future revenue.
In the digital marketing space, you can even split up KPIs into 3 categories- Acquisition, Behavior and Conversion.
- Acquisition KPIs will tell you if you are driving enough interested visitors to your site in the first place.
- Behavior KPIs show whether visitors are enjoying your website or other content.
- Conversion KPIs measure whether visitors are taking steps that will allow them to become customers
Here are some ways to measure each category in Google Analytics. But, if you use other marketing software tools, you should still be able to apply this framework to choose your own KPIs.
Acquisition
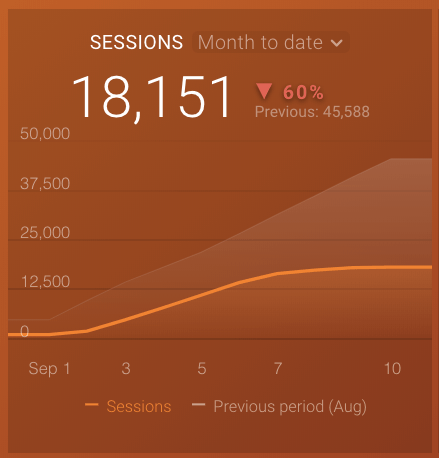
Sessions
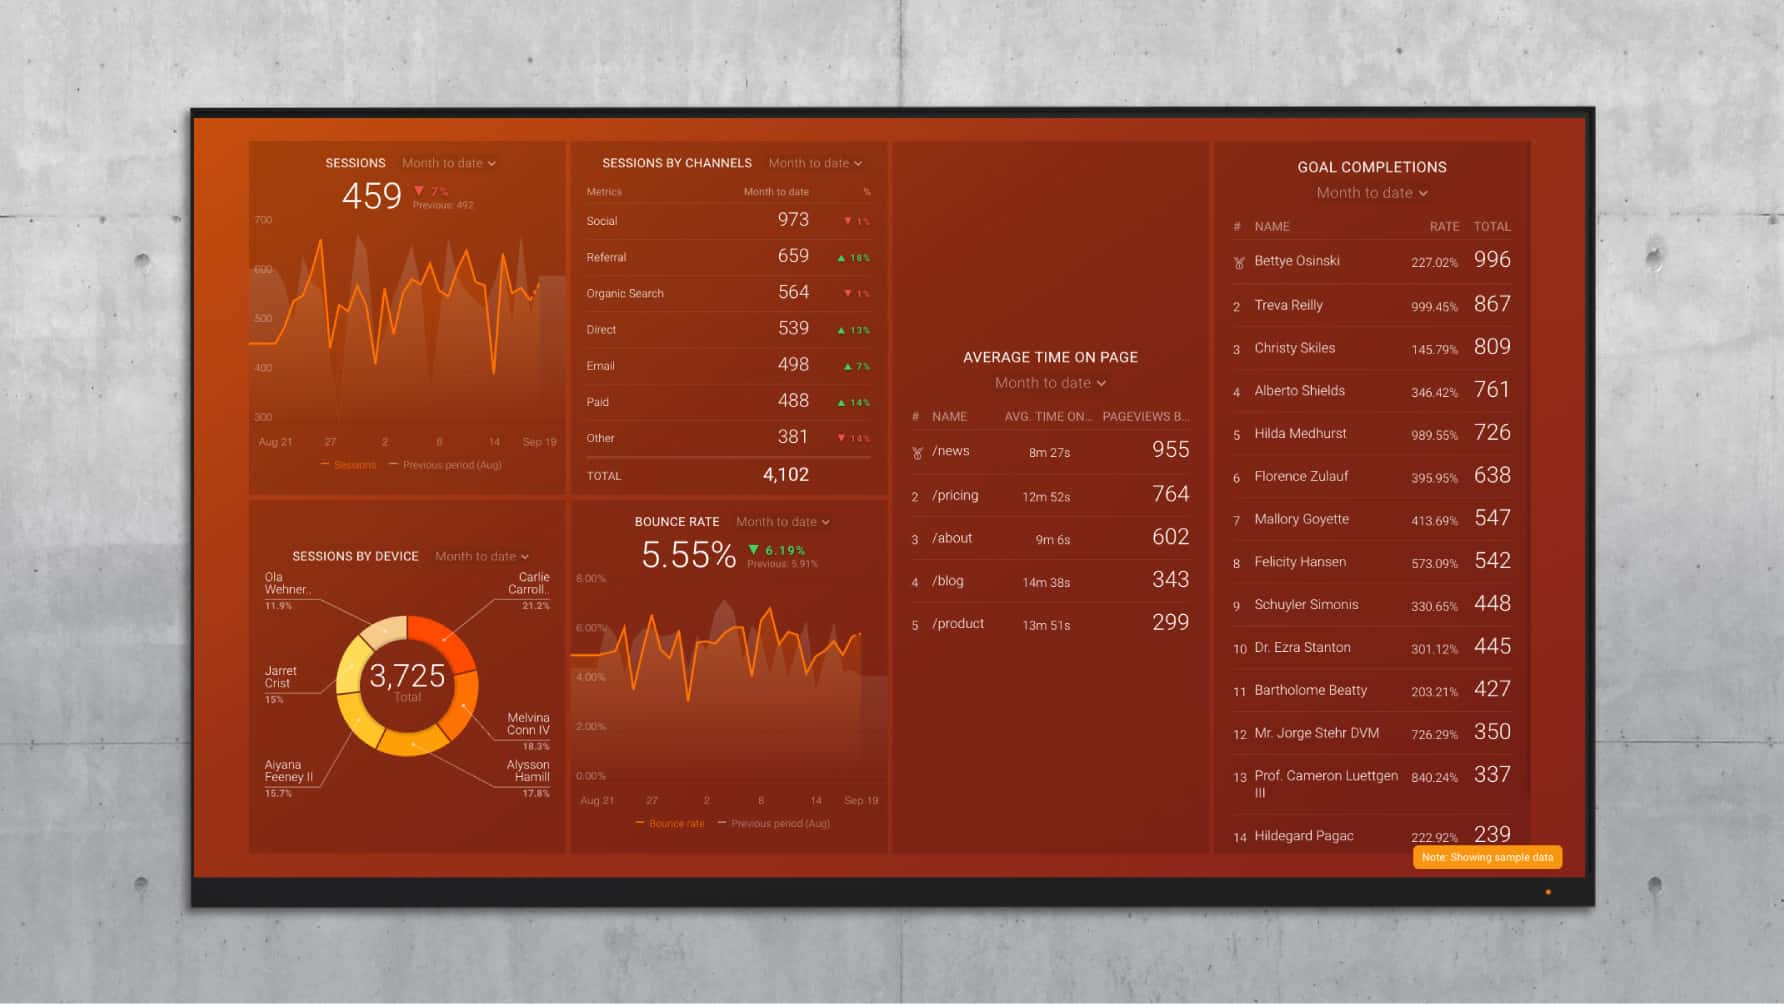
Website sessions are the number of total visits to your domain within a given period of time. Each session can contain multiple pageviews. And a user, or unique visitor, can log multiple sessions on your site over time.
Sessions are one of the most popular measurements of attention to your product or service. Sure, it doesn’t tell you much about visitor’s engagement with your brand, but it is a great KPI for determining if your brand is even getting attention in the first place and to see if your marketing efforts are paying off. Use this marketing automation dashboard to track and assess your website sessions.
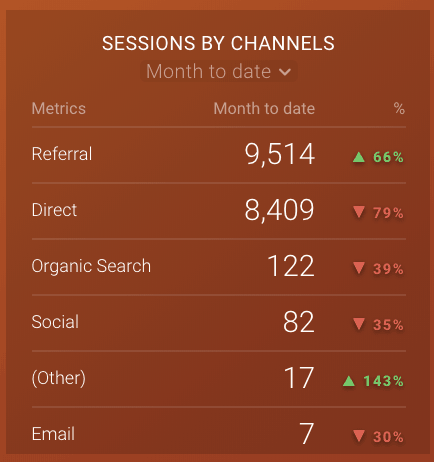
Sessions by Channel
The default Google Analytics channels include:
- Organic Search
- Direct
- Referral
- Social
- Paid Search
Let’s say that you run a marketing department, and you need to grow your sessions by 20% this year. You need to submit a plan to the CEO about how you will accomplish your goal. In order to build that report, you will need to know which channels are already driving traffic.
Are you getting most of your visits from Google?
Is your social media activity actually driving visitors?
Are people directly searching for your brand after hearing about it offline?
If you divide sessions up into separate channels, the goals becomes more actionable. You will see which channels are already working for your brand and determine priorities from there.
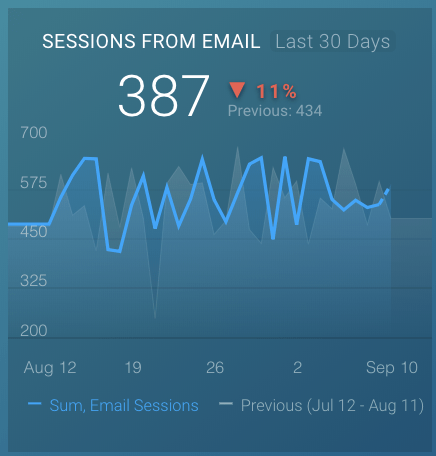
Email Sessions
Email has the highest ROI of all marketing channels, according to the Data & Marketing Association. If you can build a large, active email list, you can get instant attention to any new marketing message that you need to share.
In fact, CoSchedule chose to make the growth of their email list their “one metric that matters” (basically a KPI).
If you look at clicks to your website from emails, you can get an idea of engagement that is being driven by your e-mail marketing. Or, perhaps another company featured some of your content in their newsletter.
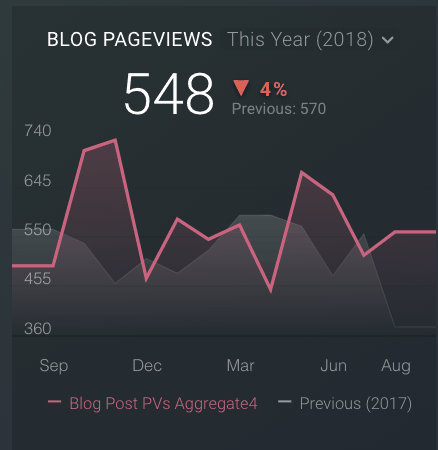
Blog Pageviews
A company blog post can be the destination for all of the marketing channels listed above, but it is especially helpful for growing organic traffic. If you want to increase your session count on a monthly basis, you will probably need a growing segment of organic traffic.
I chose to use pageviews to measure blogging efforts. Let’s say that a visitor reaches your home page and wants to learn more about your brand. They click into your “Blog” section and read a recent post. Your blog deserves credit for being a part of that visit. That is why pageviews may be a better metric than sessions here.
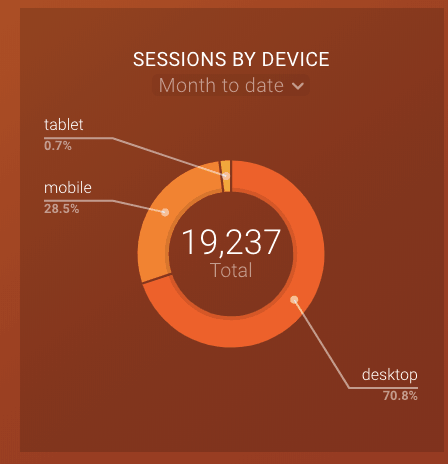
Sessions by Device Type
You have heard it over and over again- over 50% of your visitors will likely come from mobile devices (source).
Let’s say that you are trying to decide if you need to spend more resources on optimizing your website for mobile devices. You want to know how much of your traffic currently comes from mobile or tablets before you approve the project. This KPI will help you predict the impact of the optimization project on your business.
Behavior
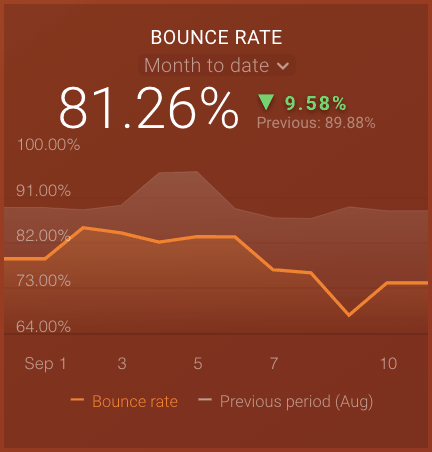
Bounce Rate
Your bounce rate is the percentage of visitors that leave your domain without clicking into a second page. Sometimes, this is no issue- they may read a piece of your content, enjoy it, and move on to something else.
But most of the time, they bounce because they got bored somewhere in the middle, or they didn’t find what they were looking for.
Bounce rate is a good measurement of whether your site “lives up to the hype”. Let’s say that you write a juicy title and meta description for a page in order to attract organic visitors. If they click on the page from a Google search engines results page (SERP), you still want them to take some sort of action on your site. The visit itself is not enough.
You can use bounce rate on a page by page basis to see which copy or videos drive engagement from curious visitors.
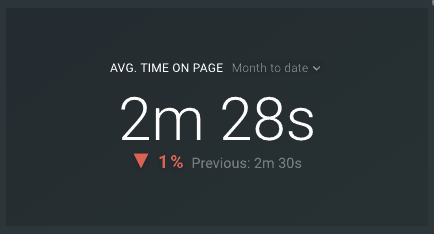
Average Time on Page
Google Analytics can only measure the time on page for visitors that click into multiple pages within a session. That’s because it’s measured as the difference between the time that the first page was visited and the last page was visited. There is one major limitation- it does not track sessions with one page visit.
Use average time on page to measure which content is actually being read or watched. This will help if you manage a blog or another web property where you would expect viewers to spend a few minutes per session.
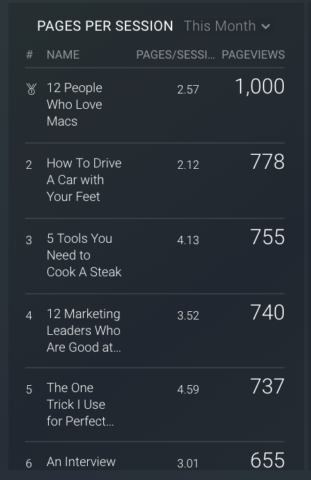
Pages/Session by Page
When you look at pages/session for each page on your site, you can learn which pages motivate visitors to keep exploring more content.
Let’s say that you run a blog for a B2B software company that sells an expensive product. Some customers may buy on the first visit, sure, but most will need to return multiple times before they are ready to consider a purchase. You can use this KPI to measure which pages actually encourage curiosity. If a page has a pages/session ratio that is close to 1, that may mean that visitors are leaving your domain after seeing the page.
Conversion
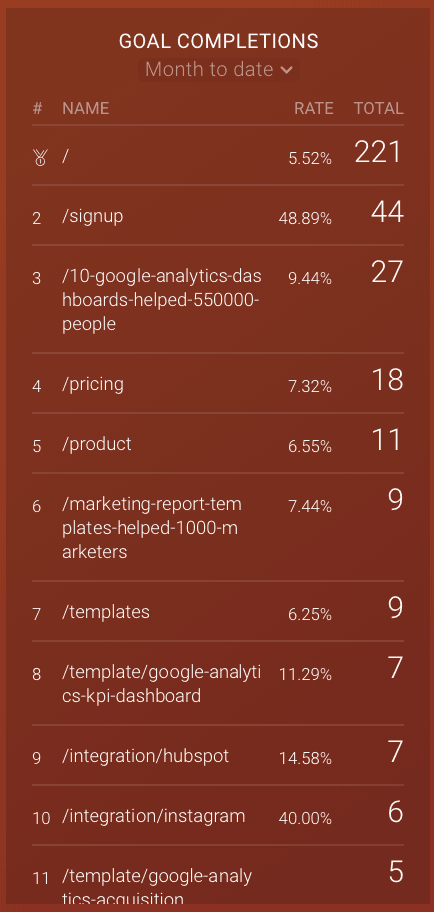
Goal Completions
The Goals tool in Google Analytics allows you to track key actions on your website at scale. For a B2B software site, this might be “demos booked”. For an e-commerce site, it might be “items added to the shopping cart”.
You will need to add some custom code to your site to indicate a goal completion. But after that, any member of your team will be able to log in to Google Analytics and track progress towards the monthly or quarterly goal.
Goal Conversion Rate by Page
This is how you can tell which pages are actually leading to goal completions. If you have one single total for the entire site, you will miss out on the actionable information. But, if you know which pages are leading to conversions, you can direct more traffic to those pages.
For example, let’s say that you have a highly trafficked page that is not driving many conversions. If you optimize the page for conversion and still only achieve an average conversion rate, you can still achieve a big jump in total conversions. That’s a lot easier than writing 10 more articles or creating 10 more videos.
Track Your Marketing KPIs
It would be wonderful if you could announce your KPIs once and then watch as your team members reset their priorities for the next quarter. But, in real life, team members need constant access to their data in order to improve their decision-making. Luckily, a marketing dashboard software makes that easy.
If you rely on digital marketing to fuel your business, you probably want to track at least one of the KPIs from each category. Here is a free Google Analytics dashboard that will help you track all 10 in real-time:
And if you want to get a quick update on your company’s or team performance, Databox scorecards send you updates on your KPIs through email, mobile push notification, and Slack every day, week or month.


