Table of contents
Which marketing KPIs are the most important to track?
This is the question we set out to answer several months ago when we began reaching out to hundreds (and hundreds) of marketers to find out their answers.
It’s one of the biggest challenges that marketers face today.
On the one hand, it has never been easier to collect and analyze data from a wide array of free and paid tools.
On the other hand, with so much data now at our fingertips, it is easy to get overwhelmed, stuck in analysis paralysis, or wind up tracking the wrong metrics.
We set out to create a comprehensive guide featuring insights from hundreds of marketers on the most important marketing KPIs they’re tracking in their marketing dashboards. However, we didn’t want to focus on general marketing KPIs, but rather dive deeper into the KPIs that are most important to track across eight functional areas in marketing, including:
- B2B Marketing KPIs
- Content Marketing KPIs
- SEO KPIs
- Email Marketing KPIs
- Social Media KPIs
- Influencer Marketing KPIs
- Brand Marketing KPIs
- Product Marketing KPIs
But before we get into that, let’s level set…

What Are Marketing KPIs?
A Key Performance Indicator (KPI) is a metric that’s used to quantify progress towards important business objectives.
Output KPIs measure the overall performance of a company or specific function, i.e. revenue, opportunities, lead, website traffic, etc., while Outcome KPIs focus on measuring the impact of tasks and projects led by individuals teams, i.e. number of meetings booked, phone calls made, blog posts published, etc.
Editor’s note: Having a hard time tracking your marketing KPIs? With Databox, you can automate performance alerts and make adjustments when they matter most.
The 20 B2B Marketing KPIs Every Business Should Track
Measuring the marketing performance of your B2B company doesn’t have to be a complicated process. It boils down to understanding a few key concepts, such as Customer Lifetime Value, Customer Acquisition Cost, and Lead Quality.
“Customer lifetime value is a crucial KPI for B2B marketing,” says Jacob Landis-Eigsti. “You need to know the lifetime value of a customer, so you can decide how much you’re able to spend to acquire a customer. For a personal injury lawyer, acquiring a customer for $175 is incredible. For a coffee shop, it’s a disaster. You should track customer lifetime value so you can see how much you’re able to spend to acquire new customers. But you also want to actively work to improve this number. You can do this by increasing referrals, reducing churn, and adding more repeat business.”
In addition to LTV, here are 19 more KPIs to keep a close eye on if you work in B2B marketing.
- Website traffic
- Organic click-through rate
- Conversions per activity
- Landing page conversion rate
- Conversions by content
- Form conversion rate
- Visitor-to-lead conversion by source
- Email sign-ups
- Leads
- Source of leads
- Lead quality
- Marketing Qualified Leads (MQLs) to Sales Qualified Leads (SQLs) conversion rate
- Performance of qualified leads
- Sales pipeline velocity
- Sales close rate
- Return on investment (ROI)
- Monthly recurring revenue
- Customer satisfaction
- Customer acquisition cost (CAC)
- Customer lifetime value (LTV)
Want to read more about B2B Marketing KPIs? Check out this detailed guide with tips from more than 40 B2B companies.
*Editor’s note: Do you know how happy your customers are with your product or service? Grab our Customer Success dashboard to see how many customers you’ve helped, support messages have been sent, and happiness percentage.

The 19 Content Marketing KPIs Every Marketing Team Should Track
With content marketing, it is very easy to fall into the trap of only measuring vanity metrics. These are metrics that may look great in a report (i.e. up and to the right) and are easy to get from Google Analytics and social media platforms, but they don’t tell the full story.
In fact, actionable metrics that tied back to revenue, lead quality, and customer retention can be notoriously difficult to measure.
Andy Crestodina, of Orbit Media, said, “The more visible the metric, the less important it is to the bottom line. And the less visible/easy to find, the more important it is.”
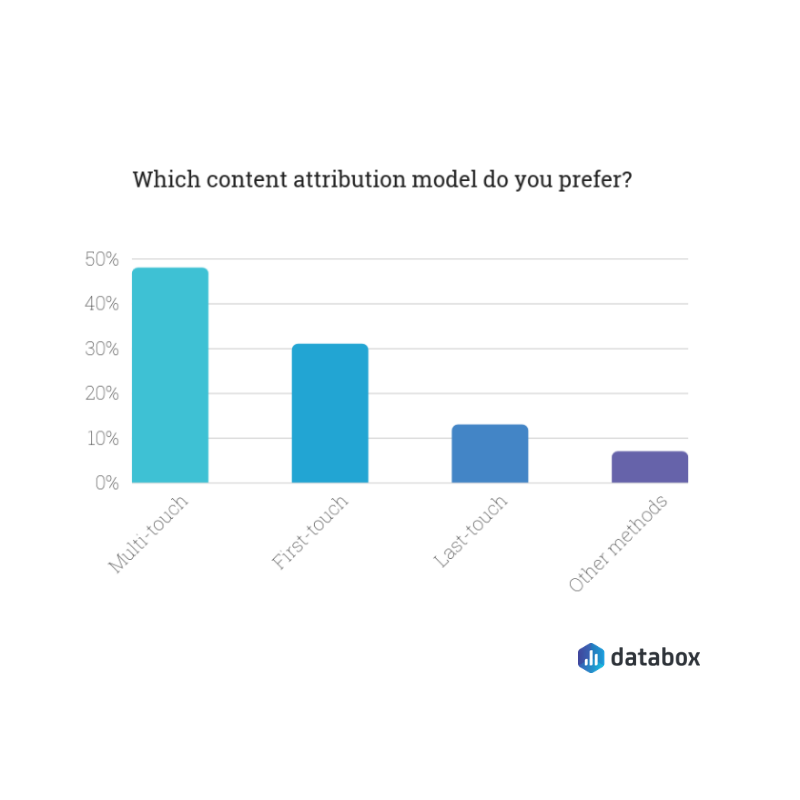
Let’s take the example of content attribution. If you are only looking at last-click attribution, which is the default in Google Analytics, and you have a longer sales cycle, you are missing out on all the things that influenced their path of the path.
Jennifer Lux of LyntonWeb says, “If you build a multi-touch attribution model that measures what percent of customers visited blogs or read offers along their path to purchase, you’ll have a better understanding of how content marketing effects the bottom line. This closed-loop, custom reporting not only measures the return on your content budget but should yield more informed, educated, and successful clients long-term.”
In fact, almost 50% of the marketers we surveyed prefer to use a multi-touch attribution model.
With all that in mind, what content marketing metrics should you be tracking? We analyzed the top KPIs, including:
PRO TIP: How Are Users Engaging on My Site? Which Content Drives the Most Online Activity?
If you want to discover how visitors engage with your website, and which content drives the most engagement and conversions, there are several on-page events and metrics you can track from Google Analytics 4 that will get you started:
- Sessions by channel. Which channels are driving the most traffic to your website?
- Average session duration. How long do visitors spend on your website on average?
- Pageviews and pageviews by page. Which pages on your website are viewed the most?
- Total number of users. How many users engaged with your website?
- Engagement rate. Which percentage of your website visitors have interacted with a piece of content and spent a significant amount of time on the site?
- Sessions conversion rate. How many of your website visitors have completed the desired or expected action(s) and what percentage of them completed the goals you’ve set in Google Analytics 4?
And more…
Now you can benefit from the experience of our Google Analytics 4 experts, who have put together a plug-and-play Databox template showing the most important KPIs for monitoring visitor engagement on your website. It’s simple to implement and start using as a standalone dashboard or in marketing reports!

You can easily set it up in just a few clicks – no coding required.
To set up the dashboard, follow these 3 simple steps:
Step 1: Get the template
Step 2: Connect your Google Analytics account with Databox.
Step 3: Watch your dashboard populate in seconds.
1. Overall traffic
2. Time on page
3. Click-through-rate (CTR) of internal links
4. Scroll depth
5. Bounce rate
6. Comments
7. Social shares
8. Links
9. Organic rankings
10. Brand market share
11. Leads
12. Conversions
13. Page values
14. Subscribers
15. Customer lifetime value (LTV)
16. Customer retention
17. Content attribution
18. Customer acquisition costs (CAC)
19. Overall ROI
If you want to dive deeper into how to measure your content marketing strategy, then read the full content marketing KPI report here.
*Editors’ note: Track your dwell time, and view the impact that your content has on your rankings, by customizing our Google Analytics SEO Dashboard.

The 49 SEO KPIs That 100+ SEO Pros Say You Should Track
For the majority of companies, the north star for your SEO strategy is revenue.
“It’s easy to get caught up in all the various metrics that are important to SEO,” says Chas Cooper of Rising Star Reviews. “But at the end of the day for most companies, it’s all about generating revenue.”
In fact, the marketers we surveyed cited more than 49 different SEO KPIs to track with an SEO dashboard software, which we’ll share in more detail below.
This included everything from goals completed and conversion rates to link velocity, bounce rate, and backlinks.
For example, “Bounce rate indicates the user-friendliness of your content,” says The Advisor Coach’s James Pollard.
“If people are bouncing from a high-traffic page, there’s no point applying additional marketing strategies to that page,” adds Ashok Sharma of Wealth Words. “Focus instead on improving the overall page structure and satisfying user intent.”
“It’s not enough to show up on page one of the SERPs,” says Chris Steele of Knowmad Digital Marketing. “You have to give users a reason to click on the link to your page. If you aren’t actively tracking CTR and trying to improve it, you’re missing the point of SEO entirely.”
So, what are all of the SEO metrics that marketers are looking at? These metrics include:
1. Organic traffic
2. Organic traffic by visitor location
3. Mobile organic traffic
4. Number of unique pages that drive organic traffic
5. New addressable organic traffic
6. Organic impressions
7. Average time on page
8. Scroll depth
9. Content length
10. Dwell time
11. Session duration
12. Pages per session
13. Bounce rate
14. Exit pages
15. Page load speeds
16. Percentage of returning visitors
17. Keyword rankings
18. Number of ranking keywords
19. Commercial intent keywords
20. Branded search volume
21. Non-branded search volume
22. Competitor rankings
23. Featured snippets
24. Keyword difficulty
25. Estimated traffic
26. Traffic value
27. Query impressions
28. Click-through rate (CTR)
29. Meta title length
30. Overall number of backlinks
31. Number of unique referring domains
32. Number of backlinks to specific pages
33. New backlinks
34. Lost backlinks
35. Backlink referral traffic
36. Backlink quality
37. Backlink reference
38. Most valuable backlink
39. Link building momentum
40. Link velocity
41. Domain authority
42. Domain rating distribution
43. Internal links
44. Crawl errors
45. Goals / conversions
46. Conversion rate
47. Revenue per visitor
48. Return on SEO investment
49. Growth
Want to learn more? Read the full SEO KPI report featuring insights from 129 marketing professionals here.
Editor’s note: If you need to track multiple SEO metrics across multiple tools, use a marketing dashboard software like Databox to consolidate all of your metrics into a central dashboard. The free SEO Overview dashboard below is a great example, showing key metrics from four different SEO tools.

The 22 Email Marketing KPIs Every Team Should Track
At its simplest, email marketing boils down to three things:
- Was your email delivered to its intended recipients?
- How many people opened it?
- Did people take your desired action?
This starts with your open and click-through rates.
Jonathan Aufray of Growth Hackers says, “The priority is to get your emails opened. Once they’re opened, you can work on other metrics such as CTR or reply rate.”
Mallory Fetchu of SmartBug Media adds, “Your CTR is the gateway to conversions–the more people clicking, the better chance you have of getting that person to take the desired action.”
While the marketers we surveyed cited 22 different email marketing metrics to look at. All of them boiled down to deliverability, open rates, and conversions.
- Open rate
- Mobile open rate
- Total opens v. unique opens
- Opening time
- Repeat opens
- Email bounce rate
- Deliverability
- Link clicks
- Click-through rate (CTR)
- Unsubscribers
- Unsubscribe rate per email
- Subscribers v. unsubscribers
- Conversions
- Purchase rate
- Return on ad spend
- Revenue per open email
- Revenue per subscriber
- Time spent viewing emails
- Active audience
- Warm reply rate
- Spam score
- Email client
Interested in learning more? Read the full Email Marketing KPI report featuring tips from a few dozen marketers.
*Editor’s note: Get a clearer picture of the activity happening on your website when subscribers leave their inbox with our Email Traffic Overview dashboard. You’ll be able to see which campaigns generate the most traffic, which subscribers clicked through, and much more:

The 24 Social Media KPIs Every Marketer Should Track
Many marketers question the effectiveness of social media these days.
Countless studies, like this one from RivalIQ, show that post engagement and referral traffic from social networks are on the decline.
As Adzerk’s Chris Shuptrine says: “You can’t only measure one social media metric to get a real sense of how your social media marketing effort is shaping up.”
Social media marketing is nuanced, and your success depends on your company’s specific goals, and you execute on your strategy.
In fact, from the marketers we surveyed, many still found Facebook to be the most effective for driving website traffic.

When it came to measuring new leads from social media, it was a first-place tie between Facebook and Linkedin.

As you can see, companies are still seeing results from social media marketing. However, with added skepticism, it is more important than ever to track and analyze your social media strategy to see if it’s worth the investment.
Here are the 24 social media metrics that matter the most.
- Engagement
- Engagement-to-reach ratio (for Facebook and Instagram)
- Click-through-rate
- Click-through volume
- Landing page views
- Referral traffic
- Demographics
- Conversions
- Leads
- Interactions
- Impressions
- Follower growth rate
- Unique visitors
- Quality Score (for Facebook and Instagram Ads)
- Influence / Share of voice
- Sentiment
- Mentions
- Return on time invested
- Ad frequency
- Cost per action (Ads)
- Most popular posts
- Branded hashtag use
- Video completion rate
- Consistency
Want to learn more? Read the full Social Media KPI report featuring tips from 95 marketers.
Editor’s note: To see follower growth on all of your social channels in a single view, download this free Social Networks Overview dashboard.

The 10 Most-Important Influencer Marketing KPIs
What marketing has the highest ROI on average – – – SEO, content marketing, brand marketing, etc?
Nope.
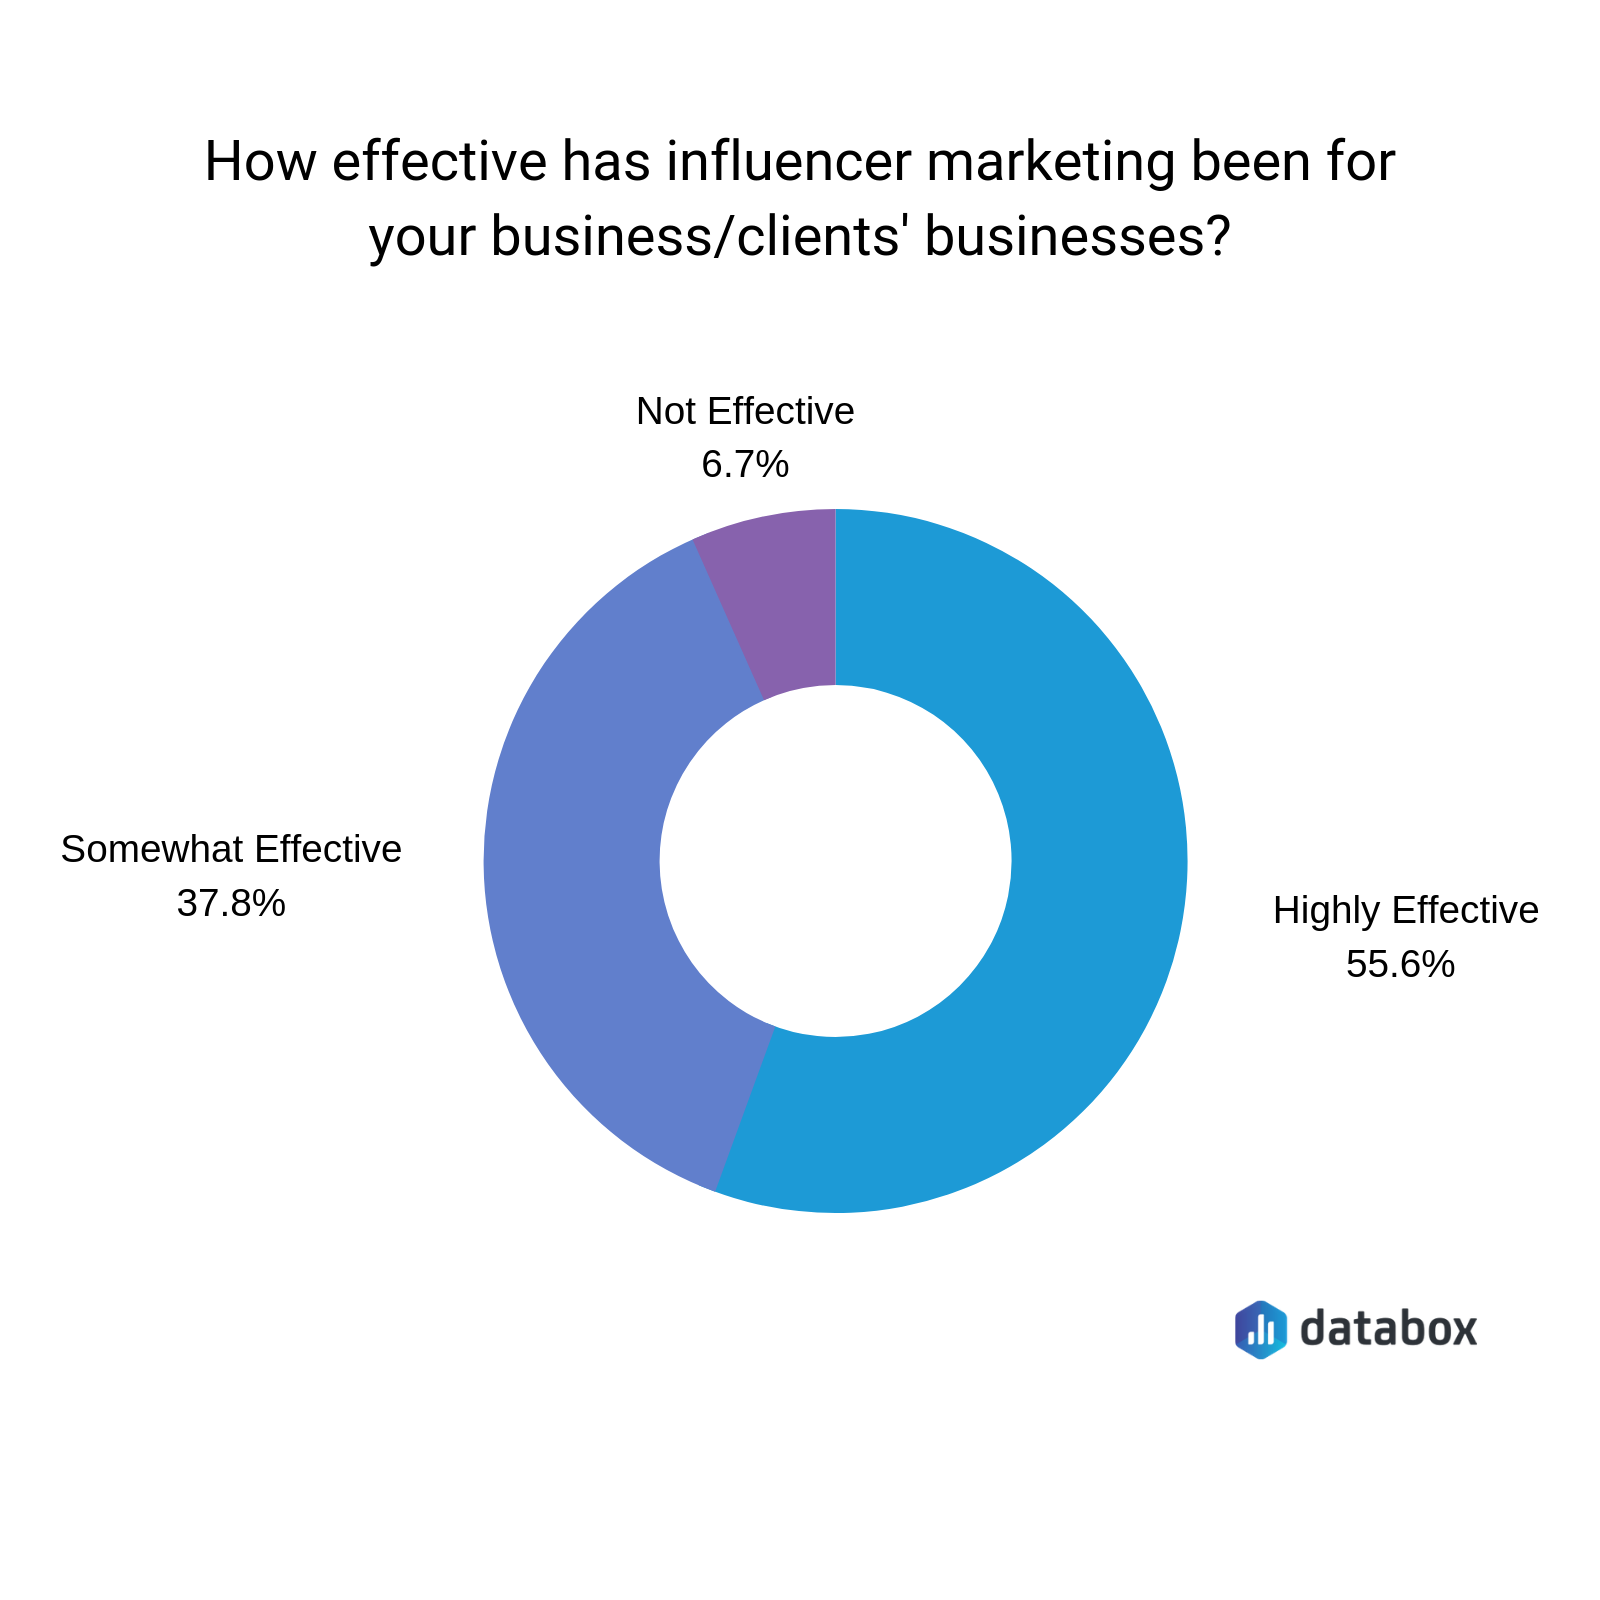
For many brands, the channel with the best return on investment is influencer marketing.
According to our survey, nearly 56% of marketers we surveyed said that influencer marketing was highly effective for their businesses.
Just like social media and SEO, the metrics that marketers are using to measure their influencer marketing campaigns varies based on their goals.
There are plenty of missteps that brands can make, especially at the start, such as overvaluing an influencer’s follower count.
Hotel Jules‘ Will Hatton says, “It doesn’t matter how many followers or likes a person has if nobody engages with the post. 0.1% of a million followers is 1000 engagements, whereas 10% of 10,00 followers is the same.”
Influencer marketing goals can range from brand awareness and traffic to new email signups, leads, and sales.
Here are the top ten metrics that marketers are evaluating, including:
- ROI
- Conversions
- Cost per Click (CPC)
- Click-through Rate (CTR)
- Referral traffic
- List growth
- Influencer audience loyalty
- Channel authority
- Engagement
- Reach
Want to learn more? Read the full Influencer Marketing KPI report featuring insights from dozens of marketers here.
*Editor’s note: If you are working with Instagram influencers, grab our Instagram Business Post Performance dashboard and see how well your influencer collaborations are impacting your KPIs:

11 Brand Marketing KPIs Worth Tracking
Can you place a tangible number on brand awareness and adoption?
This is a question that marketers have been struggling with for decades.
Kameron Jenkins of Botify says, “Some brands spend years finding their north star metric, but that’s just it – it’s their north star metric, not everyone’s. My advice for anyone looking to better measure brand marketing is twofold: 1) Give your brand goals more granularity – brand awareness as one goal, brand sentiment as another, etc. and then pick goals to match. It’ll be a lot easier! 2) Don’t rule out qualitative! Send out surveys, talk to your customers, talk to non-customers in your target audience. Are they aware of your brand? Do they know what you do? How does your brand make them feel? Use that feedback to improve, then repeat.”
In fact, it turns out how marketers are measuring brand marketing in one or more of these three ways:
- How customers spend
- What they say
- How they behave
And, these are the specific metrics that marketers are tracking on a regular basis.
- Customer Retention Rate, Loyalty, Lifetime Value
- Sales, Profit, and Revenue
- Conversions and Acquisition
- Cost Per Acquisition (CPA)
- Sentiment, Awareness, Engagement, and Reputation
- Social Mentions & Engagement
- Share of Voice
- Net Promoter Score (NPS)
- Off-page SEO, Branded Search, Organic Search
- Bounce Rate, Time on Page
- Search Volume, Traffic, and Type
Interested in learning more? Read the full Brand Marketing KPI report featuring insights from more than 60 marketers here.
Editor’s Note: Want to understand how your website sessions are contributing to your brand and pipeline? You can find data on the HubSpot Marketing Marketer Drilldown (Sessions) dashboard, and get insight into how the numbers fit together.

13 Product Marketing KPIs Every Team Should Be Tracking
Brand market share, product usage, new feature adoption, revenue, net promoter score, customer sentiment – – – what’s the most important metric for product marketers to track?
This is an ongoing debate among product marketers.
Some believe that revenue is the ultimate north star.
Matcha‘s Shauna Ward says, “The most important KPI every product marketing team should track is revenue because ultimately, product marketing is responsible for the commercial success of the product.”
Others think measuring customer sentiment is the most important.
“Tracking customer sentiment is highly important to understand how to improve a product or service and make it appealing for consumers to buy,” says Amy Hernandez of electriqmarketing.com. “This is especially important in an age where customers voice their opinions all over the internet via social media and online reviews for thousands to see. Because of this visibility, it is best to put your best foot forward and be in the know of how people are feeling.”
We took a closer look and examined the top 13 metrics that product marketers are tracking, including:
- Frequency of high-value actions
- Product usage
- Number of contacts
- Revenue
- Assisted conversions
- Qualified leads
- Cost per acquisition
- Sales close rate
- Customer lifetime value
- Net promoter score
- Customer sentiment
- Market share
- Product description clarity
Want to learn more? Read the full Product Marketing KPI report featuring the insights from dozens of marketers here.
*Editor’s note: Struggling to understand how many sales you’re getting per product? Break down your site’s revenue with our Google Analytics Product Revenue dashboard. It shows the performance of each product alongside key financial metrics like average order value and revenue by device.

Conclusion
From content marketing, social media, and SEO to brand marketing and product marketing, these are the top KPIs that marketers are using.
As you can see, there’s a lot of overlap among channels. For example, with revenue and lead generation being north stars for marketing as a whole, it is no surprise that KPIs such as revenue, MQLs, SQLs, conversion rate, and more appear across multiple channels.
If you need a quick and easy way to track your marketing KPIs, we suggest to create custom KPI Scorecards for high-level metrics and have a complete picture of how the business is performing.