


Table of contents
In my first job as a marketer, I got the opportunity to work with a SaaS-based company.
Most of the management and marketing team members were new to the world of digital marketing. To conform to the international content standard, we outsourced our content marketing to an external agency.
Things were going reasonably well, management was quite happy with the blog’s content and appealing visuals.
At the end of the month, the agency shared their performance report. It was a gigantic, 27-page PDF report, including data from Facebook, Twitter, and Google Analytics. Nobody from the management team looked into the details of the report, but everyone was optimistic about our new content marketing strategy and an increased presence on Facebook.
This pattern of end-of-month reporting continued for more than 3 months. We didn’t observe any improvement in leads, which was the metric that management ultimately cared about.
Then, we hired an external consultant to review the marketing process and ongoing marketing activities. The consultant shared a one-page weekly dashboard in an Excel sheet to track all the marketing activity, which could be regularly updated and tracked.
Here is what it looked like:
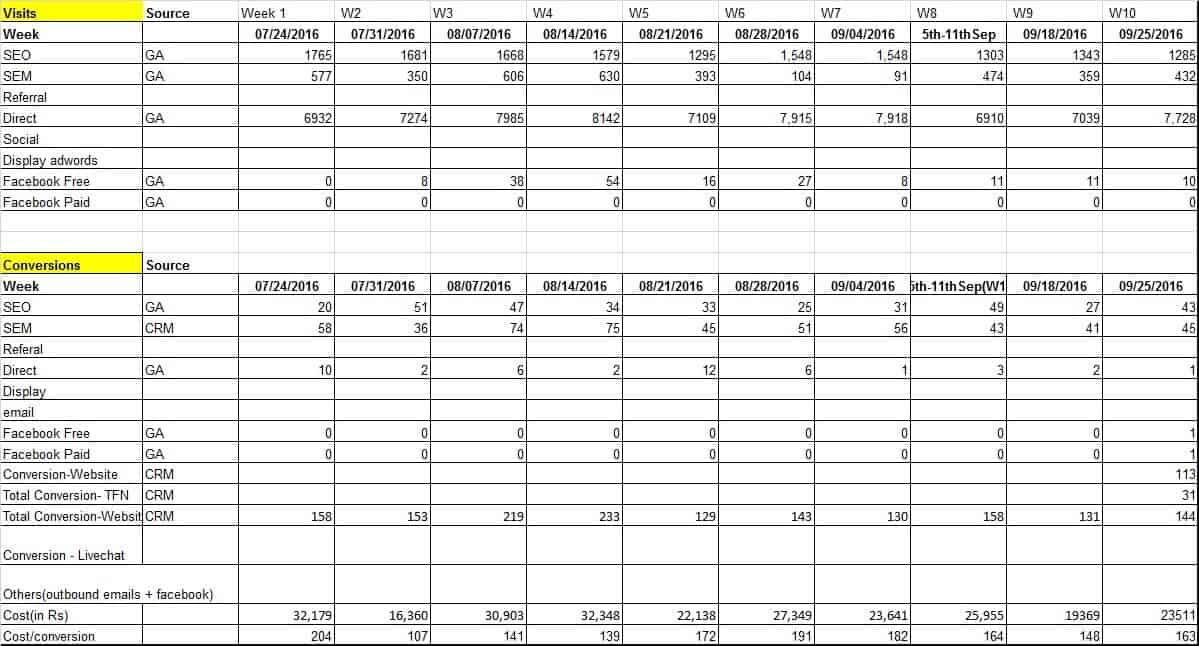
The Problem with Our Reporting System
The report was generated from the best analytics platforms, so we knew we had accurate and comprehensive data. The data points should have given direction for the business goals and ongoing campaigns.
But instead, we were overwhelmed by the amount of data. The marketing team was not in a position to make any decision based on the shared data.
A few members of management were elated, as their preferred metrics like Facebook Page “likes” and followers showed an increasing trend.
But, we didn’t really know if these Facebook metrics were bringing any tangible results to the business. If we increased our budget on Facebook campaigns, would we really get any closer to our business goals?
We lost a few months while we tried to make sense of the overwhelming amount of data. But, although we weren’t able to make data-driven decisions, we learned how to improve our marketing reporting process so that all teams were aligned.
Our New Marketing Reporting Strategy
Today, there is no lack of data to measure marketing activities. The amount of data provided by Facebook & Google Analytics (GA) is humongous. Every data point is useful in some way or another, but we don’t have the resources to look at all the metrics.
- GA provides 400+ metrics and dimensions
- Facebook provides 10 key insights report
Analytics tools like Databox business dashboards are fully customizable and you can provide generic data points for all companies. To get valuable data, we must extract the main metrics which can give insight into our business.
As we try to understand all of these marketing metrics, we must understand types of metrics.
Vanity Metrics- The metrics which look appealing but do not help you understand the performance of your business. You can’t make any actionable business decisions based on these metrics. We suggest that you avoid these metrics as they won’t help you reach the Goal.
A few vanity metrics are
- Number of Likes
- Number of Fans
- Page views
- Total Followers on FB or any social media
Real metrics or actionable metrics – The metrics give a real indication of your business performance and help in the decision-making process. These metrics give feedback on current business processes and help you understand whether marketing is going in the right direction or not.
A few key metrics are:
- Number of conversions,
- Repeat visitors,
- Number of organic visitors, etc.
These metrics are dependent on the marketing goal. Quite simply, if a metric helps you in reaching your goal, it’s a real/actional metric. Otherwise, it’s a vanity metric.
How To Discover Actionable Metrics
In my current job at Transform, I have helped the team organize metrics so they do not repeat my past mistakes.
1- Set marketing objectives. Clearly define your objective. In technical terms, the objective should be SMART (Specific, Measurable, Attainable, Realistic and Timely). The marketing team should clearly know the quarterly objective and how each campaign will help them reach the quarterly objective.
A few examples:
- Increase new customers by 25 % in the current quarter,
- Increase revenue from existing customer by 30%,
- Increase digital presence by 25 %
2- Identity the key metric. Based on the set objective, find the key metrics which can help you make decisions and track the set objective.
If the objective is to increase new customers by 25%, you can track:
- The lead generation from all the channels,
- New visitors from all the channels,
- Visitor to conversion ratio from all channels.
If outbound activity is part of lead generation plan, a few metrics to be tracked are:
- Number of contacts made per week,
- Number of leads generated from all outbound calls/email, etc.
3- Create a dashboard. A dashboard should include a collection of all the key metrics for a campaign. It combines all the metrics in one place and makes it visually presentable.
After you make one marketing dashboard, the next question that arises is how many metrics dashboards you should create in total.
I follow a two-pronged approach to track all my metrics
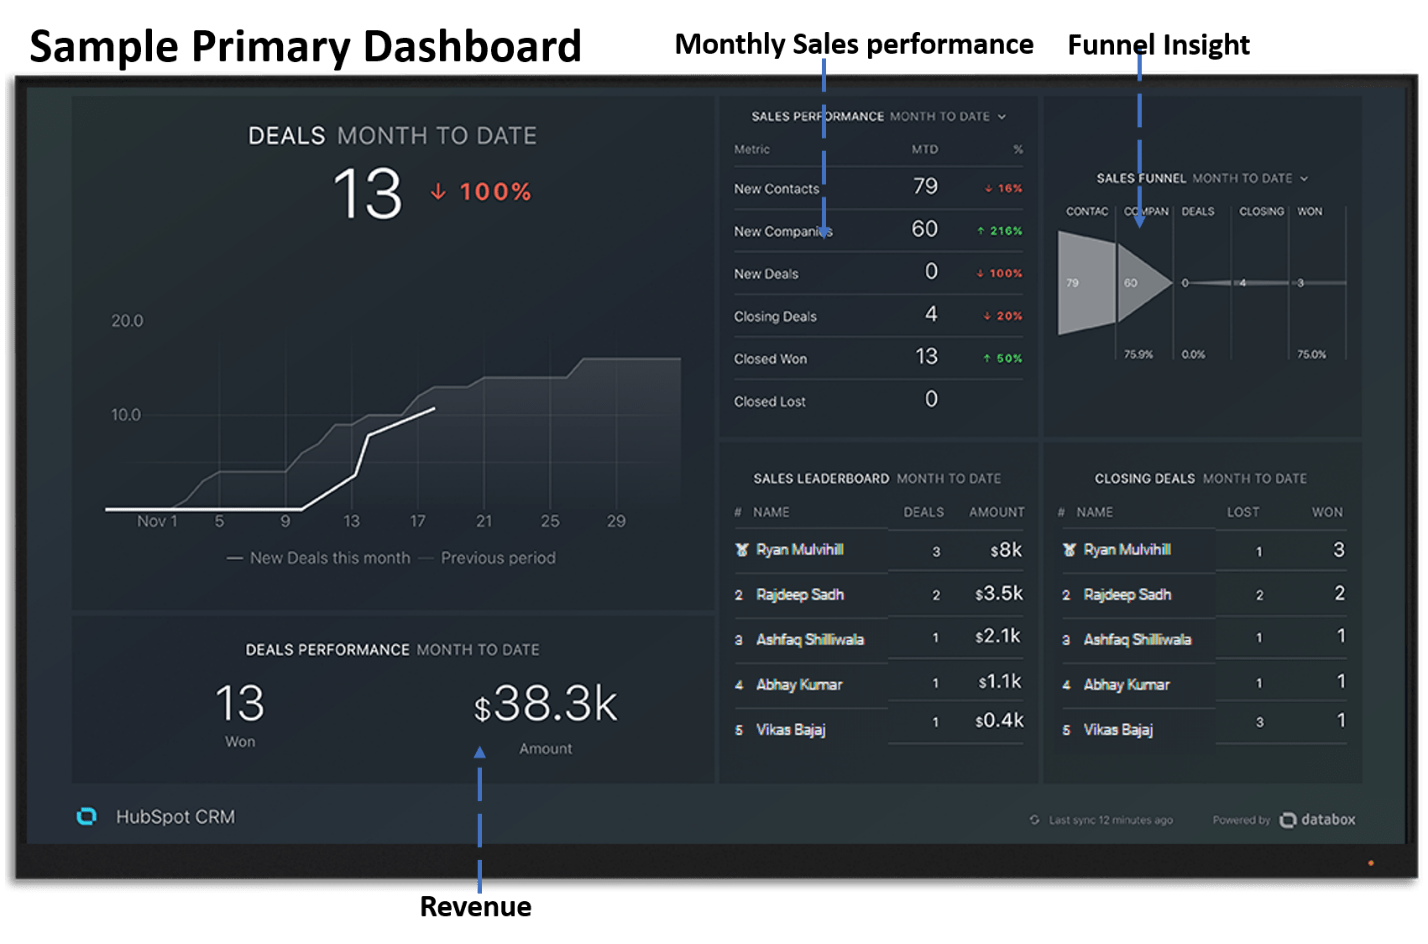
1- Primary dashboard
This KPI dashboard tracks overall quarterly goals or the main goal for the marketing team. Using the dashboard, you should able to track the progress made by the marketing team and returns on marketing investments.
A few key metrics used by most of the business are:
- Number of new leads generated,
- Number of contacts made/day,
- Leads generated from all the channels,
- Number of new visitors on the website,
- Organic traffic growth trajectory, etc.
The primary data point varies for every industry and is also dependent on quarterly marketing goal. Here are a couple examples of marketing reporting templates from different industries.
Here’s an example of a Primary Dashboard that gives a clear picture about sales, leads and funnel flow.
2- Secondary dashboard
This content marketing dashboard tracks the respective campaign objectives. These are the campaigns that you have initiated to reach the quarterly objective.
Example – If a revenue increase of 25% is the quarterly target, you would plan and initiate several campaigns, like:
- Content Marketing
- AdWords
- Social Media
- Outbound email
- Outbound calling.
All the campaign key metrics should be identified and tracked.
Here’s an example of a secondary dashboard that tracks organic growth.
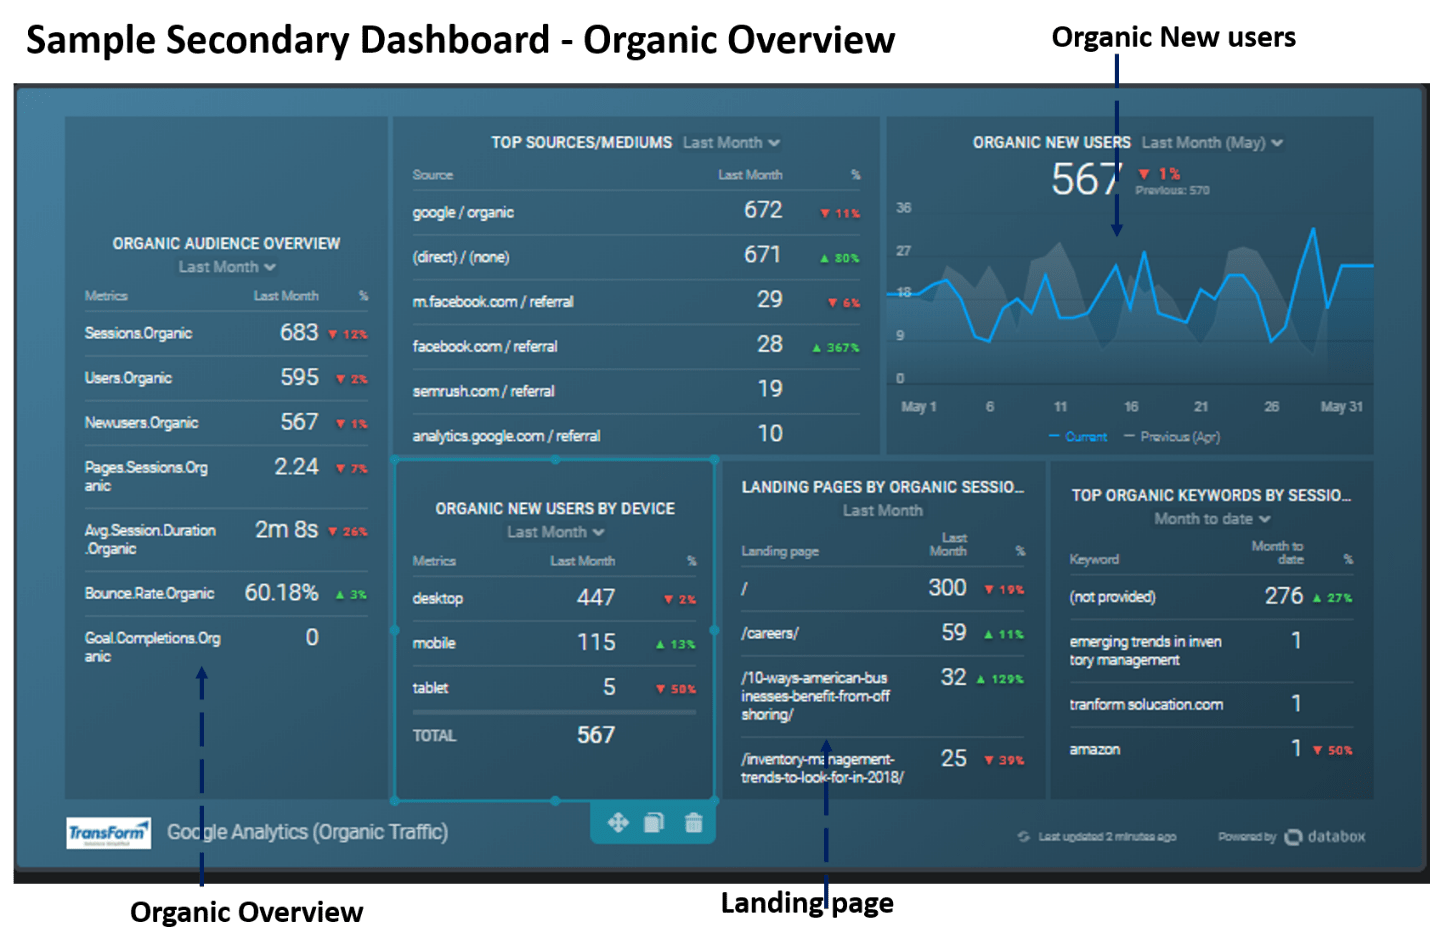
One quick insight – the number of new users is almost stagnant but there is major dip in organic traffic on the home page.
Like what you saw? Browse through all our marketing dashboard examples here. Or, if you interesting on reporting on performance in other areas of your business, like sales or finances, check our entire template gallery with over 300 dashboard examples that are free to download.
Take Responsibility for Your Reporting Strategy
We are in era of data glut.
Although Google Analytics and other analytics tools provide all the required data, it’s the responsibility of the marketing manager to find the required set of metrics to be tracked using a business dashboard software in order to make the best decision that will help him or her reach the set goal.
Fortunately, we have dashboard reporting tools like Databox which help to create a visually appealing KPI dashboard and storyboard in just a few clicks.


