


![Now You Can Track SMART Goals Automatically [New Feature]](https://cdnwebsite.databox.com/wp-content/uploads/2017/12/12102553/header_goals.jpg "Now You Can Track SMART Goals Automatically [New Feature]")
Table of contents
When we set out to build a first-of-its-kind, automated SMART goal tracking tool, we first asked our customers and partners, “How do you set and track goals now?”
In case you’ve never heard the acronym, here’s a quick explanation:
- Specific
- Measurable
- Assignable
- Realistic
- Time-bound
Unfortunately, we found very few companies doing it effectively or consistently…
When we heard people tell us over and over, “setting realistic goals is hard to do” and even confess they don’t set time-bound goals because, “they fear the consequences of missing deadlines,” we realized we had our work cut out for us.
The habits of the companies we interviewed fell into one of three buckets:
- No goal setting: They don’t set goals because they don’t know how to set accurate ones. Instead, they work towards general improvements (eg growing traffic or leads) ) rather than progress toward specific targets within a specific timeframe.
- Stupid goals: In lieu of setting SMART goals, they report output (eg I published 10 blog posts this month) or time spent (eg we spent 30 hours writing your ebook) as a measure of their success.
- No goal tracking: They do set goals, but tracking performance to goal falls by the wayside. As time goes by, predicted performance proves elusive, documents get lost and goal conversations are forgotten. They end up reporting quarter over quarter or year over year improvement as success.

“We’re afraid of setting things in stone,” said one anonymous user. “We’re smaller and can’t afford to lose clients if we miss goals. Instead, we were mostly measuring deliverables–did we hit our quota of blog posts this month? Did we finish that ebook this quarter? We tried doing scorecards before, but it never really worked because we didn’t have an easy way of getting the performance data all in one place–hence using Databox.”
We received anonymous confessions like this over and over again. Most were embarrassed to admit it but willing to do so in the hopes that we could show them a better way.
That companies struggle to set, assign, and track time-bound goals isn’t a groundbreaking discovery. For years, marketing technology companies (and the agencies and consultants that support their users) pushed the idea of SMART Goals to help counter these types of challenges. By presenting a more structured process for setting goals, the hope was that more users would do the marketing work necessary to achieve their targets, and a higher likelihood of retention for the software and consulting companies pushing the concept.
The problem? No software actually allowed marketers to set and visualize SMART goals from start to finish.
So the challenge, and fear, persisted. Until now.
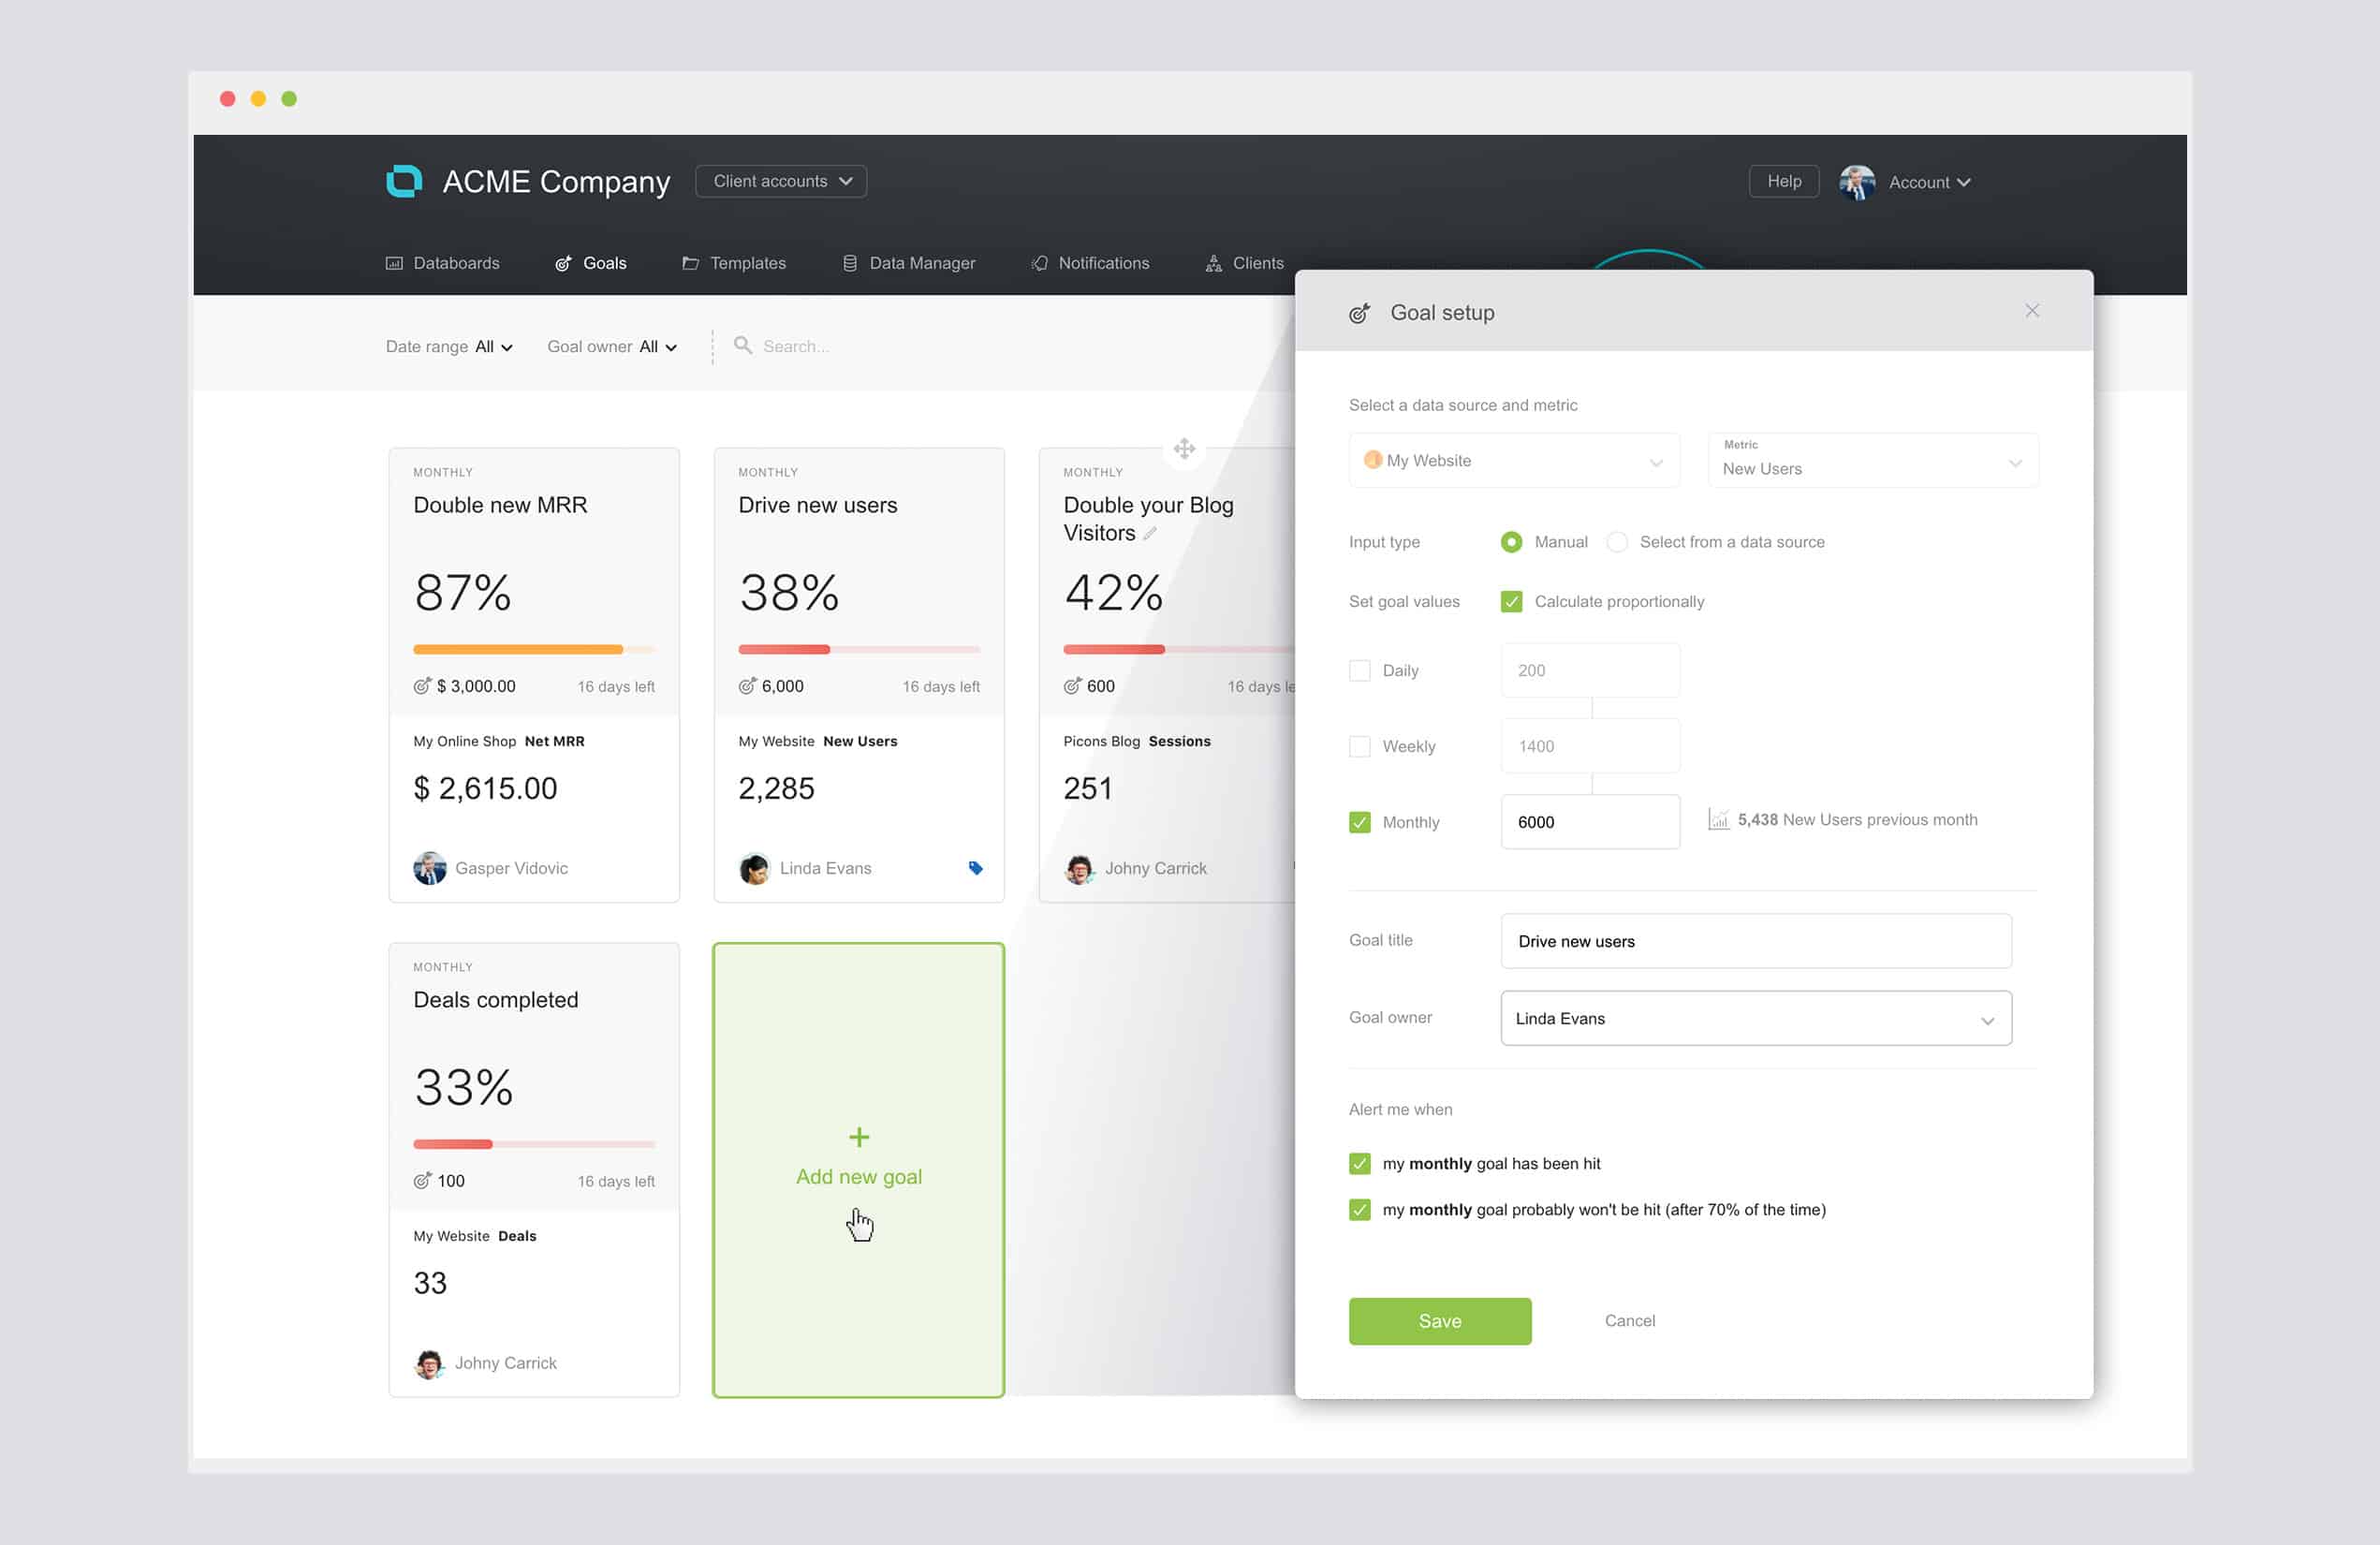
Introducing Databox’s new and improved Goals feature.
For the first time ever, you can now set goals that are specific, measurable, assignable, realistic, and time-bound, all in one place. Here’s how…
Specific: Target a specific area for improvement
Generalities are the enemy of proper goal setting.
I once had a senior executive tell me, “just double that sh**” as a goal. Said in jest, but a sincere request nonetheless.
These are good aspirations, but poor goals, as they rarely translate into productive action. The result? People, and teams, don’t know what to do to hit goals.
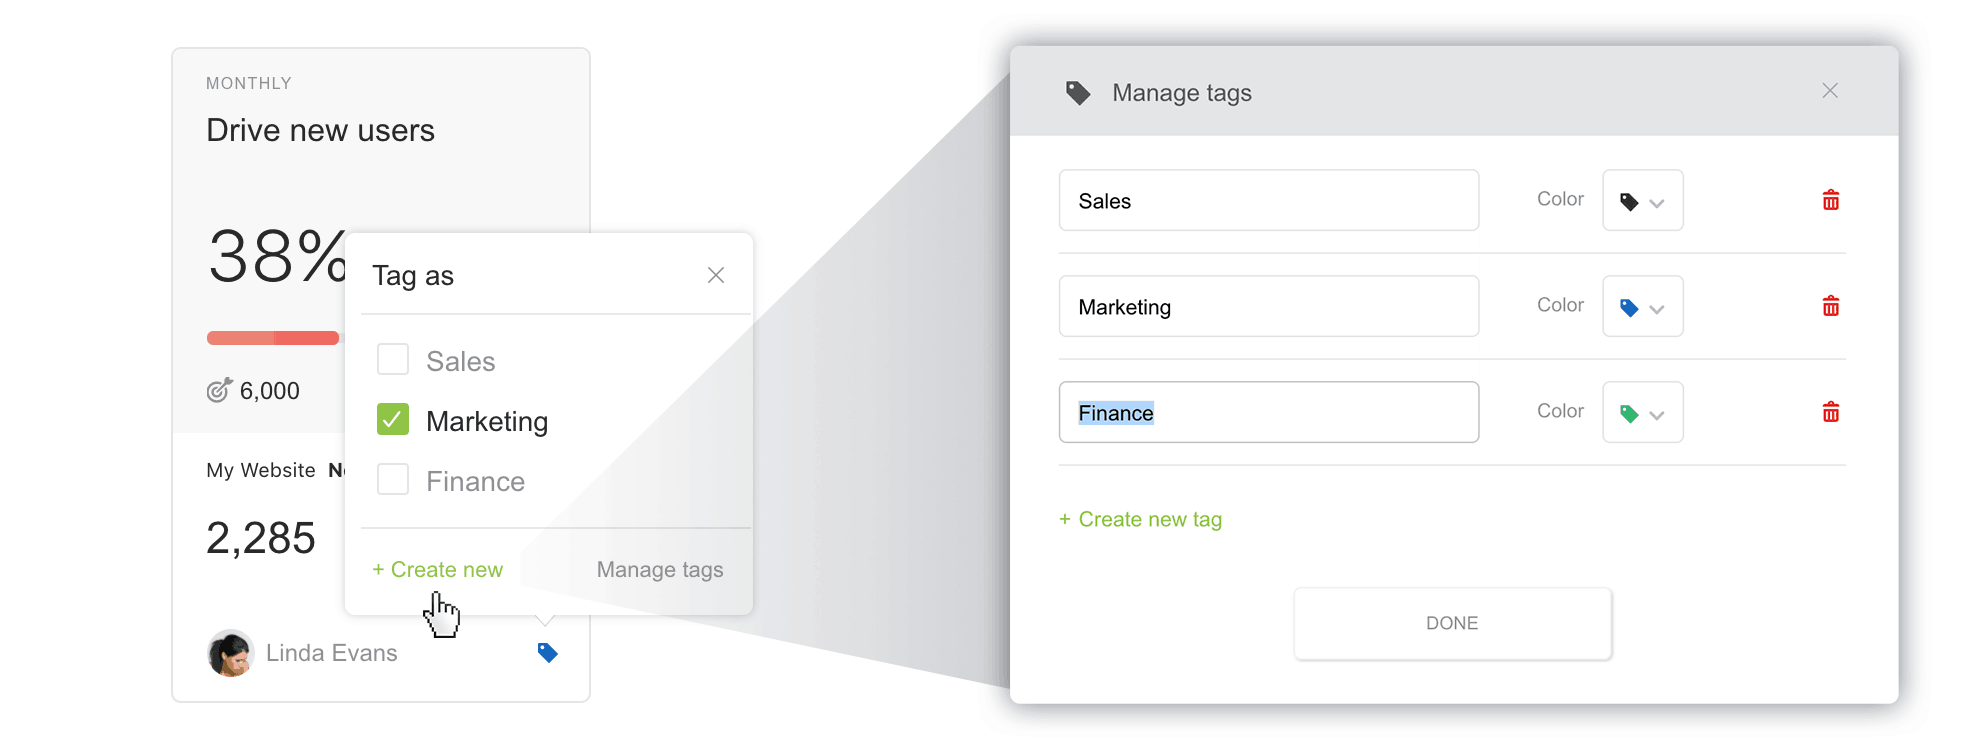
The new Goals feature in Databox allows you to get more specific. Now you can translate aspirations into specific goals across the departments that influence them.
By tagging goals by department, everyone is in the loop as to how the goal will be hit, and who they can go to for support.
Measurable: Quantify or at least suggest an indicator of progress
With any goal, there are multiple channels and initiatives that will drive progress toward achieving it.
For example, website conversions are dependent on website visits, click-through rates, form completions, etc.
The beauty of Goals is that, because Databox already pulls data from all of your data sources, you’ll now have the most accurate view on progress toward your goals.

Once you’ve set a goal for a specific metric, any Databoard that displays this metric will visualize your current progress against this goal. These visualizations allow your team to make the adjustments today in order to hit meaningful goals down the road.
PRO TIP: How Are Users Engaging on My Site? Which Content Drives the Most Online Activity?
If you want to discover how visitors engage with your website, and which content drives the most engagement and conversions, there are several on-page events and metrics you can track from Google Analytics 4 that will get you started:
- Sessions by channel. Which channels are driving the most traffic to your website?
- Average session duration. How long do visitors spend on your website on average?
- Pageviews and pageviews by page. Which pages on your website are viewed the most?
- Total number of users. How many users engaged with your website?
- Engagement rate. Which percentage of your website visitors have interacted with a piece of content and spent a significant amount of time on the site?
- Sessions conversion rate. How many of your website visitors have completed the desired or expected action(s) and what percentage of them completed the goals you’ve set in Google Analytics 4?
And more…
Now you can benefit from the experience of our Google Analytics 4 experts, who have put together a plug-and-play Databox template showing the most important KPIs for monitoring visitor engagement on your website. It’s simple to implement and start using as a standalone dashboard or in marketing reports!

You can easily set it up in just a few clicks – no coding required.
To set up the dashboard, follow these 3 simple steps:
Step 1: Get the template
Step 2: Connect your Google Analytics account with Databox.
Step 3: Watch your dashboard populate in seconds.
Assignable: Specify who will do it
Goals need owners.
The reason isn’t so much about accountability (although that’s critical) as it is to have someone actively driving progress. When goals don’t have owners, the success (or lack thereof) of that goal seems serendipitous.
Attach an owner to a goal, and you’ve also attached an evangelist to that goal that will actively put measures in place to hit it.
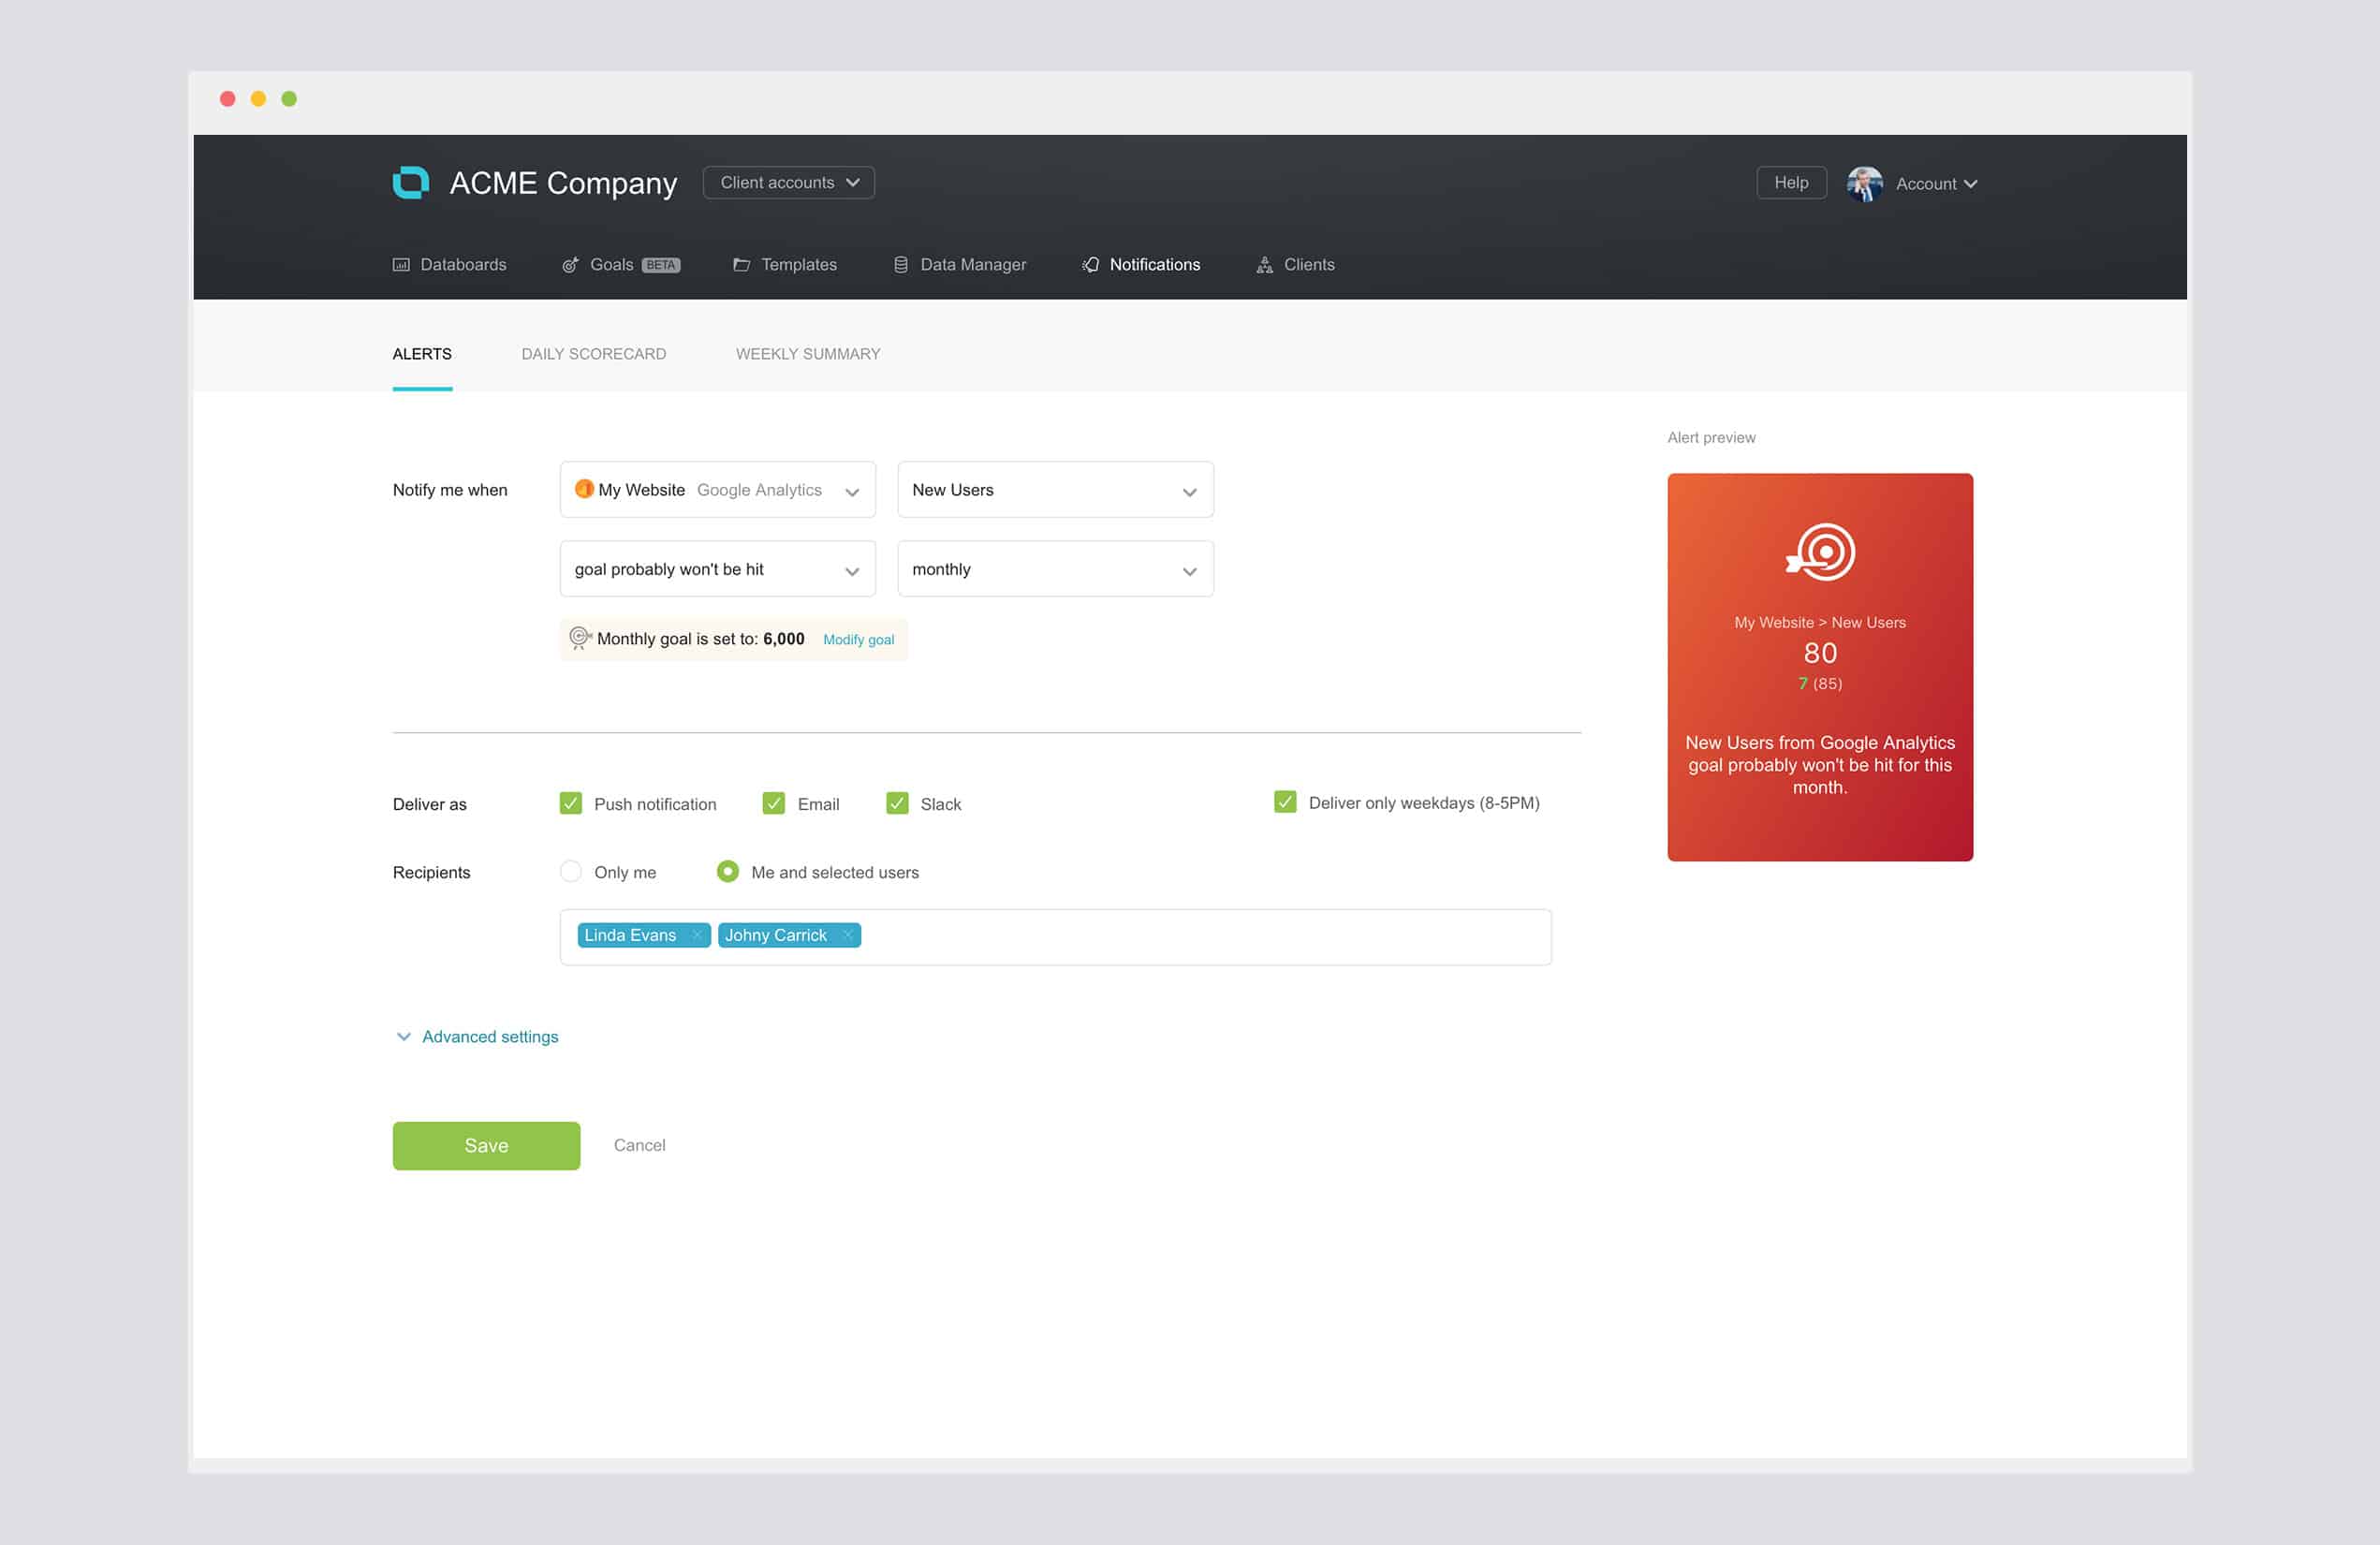
When you select a goal owner, this individual will also receive alerts when the goal is hit, or when it’s off track after a certain period of time has elapsed.
You can also add additional recipients for these alerts, and choose the medium for which you’d like them received, i.e. email, push notification via the Databox mobile app, or Slack.
Realistic: Identify results that can be realistically achieved
“Realistic” is subjective. That’s why it’s important that your team is having an open dialogue about what’s possible.
However, benchmarking current performance is a critical first step toward creating more realistic goals. By understanding current performance, you can “back into” goals that actually make sense for the business.
Now, any time you set a goal in Databox, you’ll see benchmarks on current performance for that metric, as well as daily, weekly, and monthly calculations for what you’ll need to do to hit that goal in your specific time period.
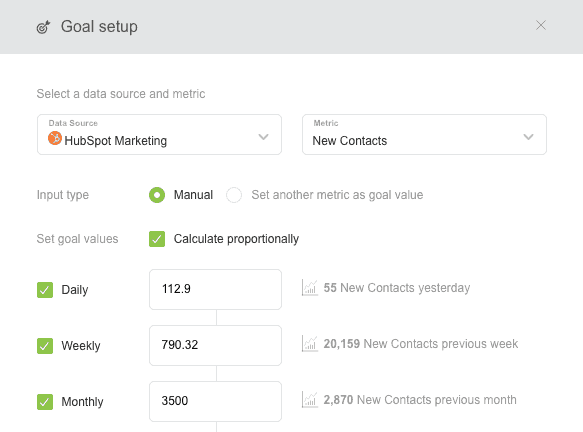
On the left, you have your goal calculated into monthly, weekly, and daily targets, as well as benchmarks for each to the right.
This will allow you and your team to have more frequent and productive conversations around realistic goals and the initiatives for driving progress toward them.
Also, by slicing your monthly, or even quarterly goals, into smaller targets, you’ll know whether you’re on or off track much quicker so you can make adjustments when they matter most–right now.
Time-Bound: Specify when the results should be achieved
Just like having an owner, goals also need a specific timeframe for being achieved.
This promotes not only a more actionable approach toward achieving the goal but also more frequent discussion and measurement for staying on track.
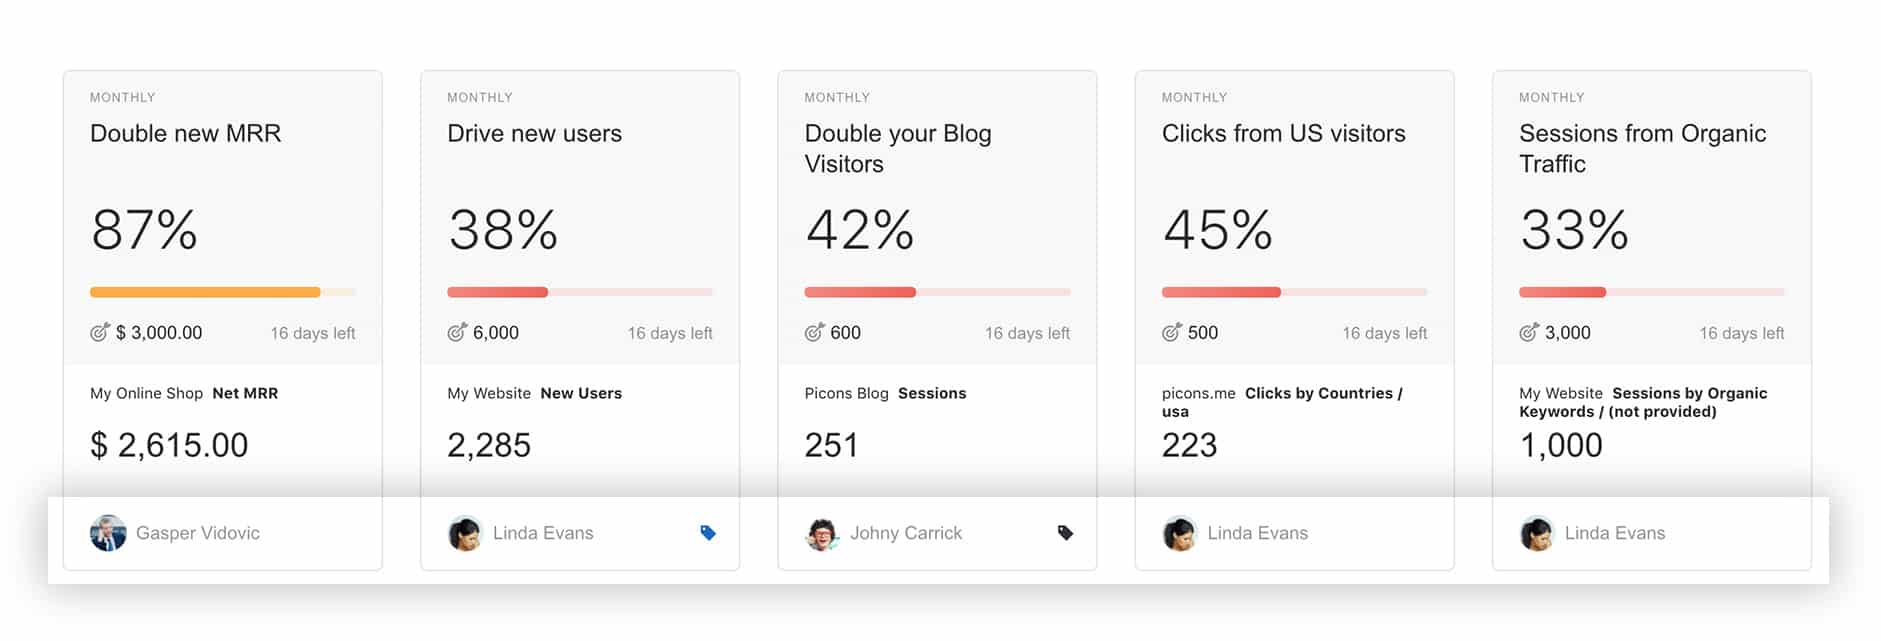
In addition to listing owners on Goals cards, you’ll also find the number of days left in the time period you’ve specified during goal set up.
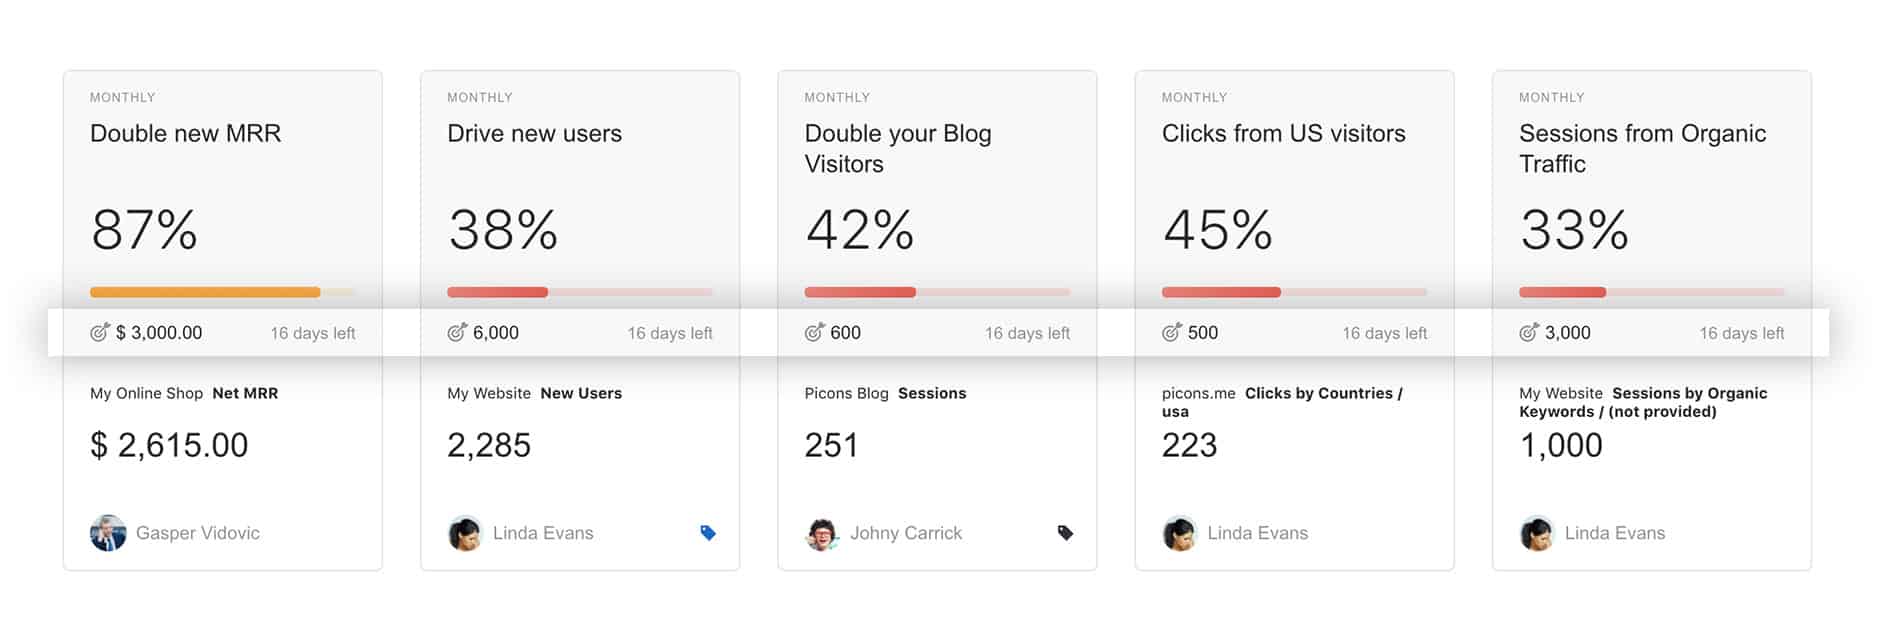
In one view, anyone can see how the entire company is progressing toward its goals, who individual goal owners are, and how much time is left to hit the goals.
This level of transparency is unprecedented but also required, for enabling people and their teams to set and track goals more successfully.
Sounds great – can I give it a try?
Current Databox users can visit the Goals section in the app to get started.
Don’t have a free Databox account yet? Sign up for a free one here.


