


Table of contents
How do you measure your sales team’s performance? Do you just rely on the number of new accounts closed or look at the total increase in revenue?
Truth be told, to get an accurate picture of how well your sales team is performing, you need to track several important metrics.
This article discusses 25 sales performance metrics that’ll provide you with valuable insights, help in decision-making, and improve your overall sales process.
Here’s a breakdown of what we’ll cover in this article.
- What Are Sales Performance Metrics
- Why Is Tracking Sales Performance Metrics Important?
- How to Measure Sales Performance Metrics
- 25 Key Metrics to Measure Sales Performance
- Free Sales Performance Dashboards to Get Started
- Streamline Sales Monitoring and Reporting with Databox

What Are Sales Performance Metrics?
Sales performance metrics are key performance indicators that determine how successful and effective your sales processes and strategies are.
The purpose behind tracking these uber-important metrics is to identify areas of success and areas that need to be improved to achieve company-wide goals.
Why Is Tracking Sales Performance Metrics Important?
You can always find the sales team constantly juggling multiple tasks at once.
From generating new leads to nurturing them to finally winning them over, should they really spend their scarce time tracking and interpreting sales metrics?
Definitely! Monitoring metrics for sales performance is worth the exercise. Here’s why:
- Shows how you’re progressing towards achieving sales targets. This helps you create an agile strategy whereby if you’re behind targets, you can tweak your strategy to meet objectives.
- Helps you make data-driven decisions instead of relying on your intuition.
- Enables proper allocation of resources. For instance, if your sales cycle length is abnormally high, you might prioritize your team members’ efforts to adopt tactics to shorten it.
- Improves sales forecasting, which leads to better financial planning.
How to Measure Sales Performance Metrics
It’s relatively easy to get started with measuring sales team performance metrics. All you need to do is open a spreadsheet, enter your sales data, and input the formulas of the KPIs you want to calculate.
However, this is the traditional way of doing things, which isn’t effective in today’s fast-paced business life. Spreadsheets are confusing, ugly to be shown to the management, and if one formula breaks, you’re a goner.
A better alternative is to use a metric and dashboard reporting tool like Databox.
Databox puts tracking sales performance metrics on autopilot so you can focus on bigger things to maximize your sales output. Here’s how Databox is a better and stress-free way to monitor sales performance:
- Connect 130+ data sources from the most popular sales and CRM tools such as HubSpot, Salesforce, Pipedrive and more.
- Select the metrics that matter to you from 4,000+ options. Display them on one screen instead of juggling between 10 different software to get the data you need.
- Visualize these metrics on attractive dashboards. No design or coding skills are needed.
- Monitor upward and downward trends and daily fluctuations on a single screen for multiple periods.
- Set goals, alerts, scorecards, and scheduled snapshots so you (or anyone in your team) always stay on top of the sales team’s performance.
From here, it’s not only easy to monitor and report on your data but also analyze it, making it easier than ever to spot opportunities for improvements.
And the best part? You can benefit from our free dashboard service to set you up with a beneficial reporting mechanism in no time.
25 Key Metrics to Measure Sales Performance
So, what are some sales performance metrics examples that’ll put you on the path to success? To find this out, we interviewed 25+ sales professionals to get their expert input.
Our survey respondents have sales teams of different sizes. Almost 60% of them have a team ranging from 2-5 sales professionals, while nearly 20% have more than 15 people in their team.

When asked how many sales metrics they track to monitor performance, 52% measure 6-10. This is followed by 37% of our respondents who track 1-5 metrics to measure sales performance.

To help you choose the right metrics for the job, we’ve curated a list of 25 sales performance metrics examples. We’ll define each metric, share how to calculate it, and mention its type so you can quickly identify which is suitable for your North Star metric or primary goal.
Each sales performance metric will fall under one (or more) of the below types:
- Quality: how consistent are you in providing positive experiences?
- Growth: how likely are you to grow your business/revenue in the future?
- Efficiency: how adept are you at managing your company’s resources?
- Inputs: which metrics do you have the most control over?
- Outputs: which metrics lead to desired outcomes?
- Outcome: which metrics have the greatest impact on business and profitability?
PRO TIP: How to Keep Track of Your Sales Team’s Performance
Sales happen every day, and if you have an active sales team, they’re busy setting up appointments, making calls, creating and nurturing deals, and closing them to generate new revenue. It’s your job to monitor their performance and work with your team to improve it. To do that, you need up-to-the-minute information at your fingertips, including:
- What’s our average deal size?
- How many open, closed, and lost deals have we seen this month?
- How much revenue can we expect to close from new deals created?
- What’s our current progress towards our sales goals?
Now you can benefit from the experience of our sales experts, who have put together a great Databox template showing all the most important KPIs for your sales team’s performance. It’s simple to implement and start using as a standalone dashboard or in sales reports!

You can easily set it up in just a few clicks – no coding required.
To set up this Sales Manager KPIs Dashboard, follow these 3 simple steps:
Step 1: Get the template
Step 2: Connect your HubSpot account with Databox.
Step 3: Watch your dashboard populate in seconds.
Let’s explore them one by one.
- Total Sales Revenue
- Net Revenue Retention (NRR)
- Average Revenue Per Account (ARPA)
- Quarterly Sales Growth
- Year-Over-Year Growth
- Repeat Customer Rate
- Average Customer Lifetime Value (LTV)
- Average Deal Size
- Average Profit Margin
- Sales Conversion Rate
- Lead Conversion Rate
- Lead to Opportunity Conversion Rate
- Market Penetration Rate
- Sales Cycle Length
- Average Annual Contract Value (ACV)
- Sales Expense Ratio
- Pipeline Coverage
- Win Rate
- Deal Slip Rate
- Quota Attainment
- Number of Meetings Booked
- Number of Sales Pitches
- Sales By Location
- Percentage of Revenue From New vs. Returning Customers
- Customer Churn Rate
1. Total Sales Revenue
Metric type: Growth and Outcome.
Formula: Total sales revenue = Number of items sold x Price of each unit
Pretty self-explanatory, the total sales revenue shows the total income generated from selling products/services in a given time period. No matter the industry or product type, this metric is universal. So, every company stands to benefit from tracking this sales metric over time.

Regarding the total sales revenue, Olivia Tan from CocoFax says, “Total sales revenue is the most important sales metric that every sales team tracks from a broader view. It is because sales revenue helps you understand the overall performance of the team and the project individually.”
2. Net Revenue Retention (NRR)
Metric type: Quality and Outcome.
Formula: NRR = [(Starting MRR + Expansion MRR – Contraction MRR – Churned MRR) / Starting MRR] x 100%
The NRR measures the revenue generated from your existing customer base. The current recession and high acquisition costs have shifted companies to focus their efforts on retaining customers and generating more income from them via upsells and cross-sells.

This sales performance metric provides a complete picture by taking into account:
- Starting MRR: recurring revenue you were generating from your customers in the previous month.
- Expansion MRR: revenue earned through upsells and cross-sells.
- Contraction MRR: revenue lost because of customers downgrading to a cheaper plan.
- Churn MRR: revenue lost because customers leave or unsubscribe from your company.
The higher the NRR, the better. To improve this metric, you must consistently communicate the product value to your users. This can be done through primary and secondary onboarding.
Primary onboarding acquaints new users with your popular features and how your product operates. On the other hand, secondary onboarding contextually announces new features relevant to one’s use case.
3. Average Revenue Per Account (ARPA)
Metric type: Growth and Outcome.
Formula: ARPA = Monthly recurring revenue / Total number of active accounts
Also referred to as Average Revenue Per User (ARPU), this sales performance metric shares how much income is generated from each account on average.

Tracking this key performance indicator is important because it shows how well-retained your users are. A greater ARPA means your customers are less likely to churn and more likely to become loyal brand advocates. And it is high customer advocacy that spreads positive word of mouth and contributes to the network effect.
The easiest way to increase average revenue per account is to persuade your customers to upgrade. However, one shouldn’t be pushy and cause friction by disrupting their workflow with promotional messages.
Prompt contextual upgrade messages when users most need them. For instance, the free plan on Loom lets one record videos for up to 5 minutes. When users reach this limit, a message from Loom pops up, asking them to upgrade to unlimited recording time.
4. Quarterly Sales Growth
Metric type: Growth, Input, and Outcome.
Formula: Quarterly sales growth = (Current quarter sales – last quarter sales) / Last quarter sales

How much do your sales grow from one quarter to another? This sales metric tracks precisely this.
You might be questioning the need to monitor this KPI if you’re measuring annual sales growth. However, tracking quarterly sales growth lets you forecast for the coming quarters and enables you to allocate your resources properly.
Say Q1 is your sales team’s busiest time of the year, considering companies have just been allocated generous budgets. You might consider adding a couple of part-time business development representatives to reap the most benefit from this time.
Adopting any sales growth strategies will improve this metric. Our recommendation is to expand your company’s use cases. You don’t need to reinvent the wheel but rather look at easy wins.
For instance, an email marketing tool can create different case studies for clients belonging to different industries. This will help in offering email marketing services to multiple industries, like real estate, fashion, and electronics.
5. Year-Over-Year Growth
Metric type: Growth and Outcome.
Formula: YOY growth = [(Current year value / Previous year value) – 1] x 100%

As the name suggests, tracking this sales metric shows the extent to which you’ve achieved yearly growth. While you can calculate the growth for any period, monitoring the yearly values helps determine whether your sales strategies are successful or need improvement.
If you want to spruce up this metric, the best approach is regularly collecting customer feedback and implementing it in your company. However, not all feedback should be followed through. Prioritize those of a pressing nature and forget those inconsistent with your business/product vision.
Related: 17 Ways to Conduct Customer Research Right Now & Collect Valuable Feedback
6. Repeat Customer Rate
Metric type: Quality and Output.
Formula: Repeat customer rate = (Number of repeat customers / Total paying customers) x 100%

The repeat customer rate measures the proportion of customers who make repeated purchases from your company. This metric directly affects retention and loyalty, so tracking and improving it is important.
To increase the likelihood of repeat purchases, ensure you offer great customer support to address any queries your users may have. Consider adding a self-service help center filled with FAQs, how-to articles, and video tutorials, along with providing live customer chat for novel scenarios.
7. Average Customer Lifetime Value (LTV)
Metric type: Quality, Growth, and Outcome.
Formula: LTV = Average purchase value x Average number of purchases x Average customer lifespan

The customer lifetime value is an important metric for any sales professional to track. It measures the average revenue a customer generates throughout their relationship with a company.
A higher customer lifetime value is an indication of a loyal customer base that is more receptive to upsell and cross-sell messages.
One tip for increasing LTV is offering personalized experiences, be it in the shape of customized onboarding or relevant feature announcements. Personalized experiences increase customer engagement which is key to keeping them retained.
8. Average Deal Size
Metric type: Efficiency and Output.
Formula: Average deal size = Total deal value / Total number of closed deals
The average deal size measures how much money you generate from closing a deal on average.

Tracking this metric on a monthly and quarterly basis shows if your sales team and processes are on the right track. It signals how effective your sales team is in persuading customers to get the higher or annual plan.
Regarding this sales metric, Natalie Slyman of Benchmark Email shares some words of wisdom.
“Average deal size is one that is super helpful when determining your upcoming sales forecast. Knowing your average deal size and contract length within a certain period of time can be used as a baseline to track against, helping your sales team determine if their future efforts are exceeding previous performance (or falling short). It can also serve as a motivator and encourage your team to shoot for closing deals that are larger.”

Want to get highlighted in our next report? Become a contributor now
9. Average Profit Margin
Metric type: Growth and Outcome.
Formula: Average profit margin = (Gross or net profit / Total profit) x 100%
This sales performance KPI measures a company’s profitability and determines how much profit is made over a few years on average.
The higher the average profit margin, the more satisfied your investors are and the more adventurous you can be with your future decisions.
Michael Sena from SENACEA believes that the average profit margin and average sales margin are the two most useful metrics for forecasting sales performance.
He says, “Combined, they enable the business to understand how many sales have to be finalized to cover the fixed cost (break-even point) and how to optimally structure sales commission plans. They also allow informing pricing decisions such as volume discounts and competitive analysis.”
Related: Ecommerce Profit Margins: 15 Ways to Improve Your Store’s Gross Profit
10. Sales Conversion Rate
Metric type: Growth, Efficiency, and Outcome.
Formula: Sales conversion rate = (Total number of closed deals / Total number of leads) x 100%

The sales conversion rate is a commonly tracked metric amongst teams of different sizes and industries. This is because it shows the proportion of leads that were successfully converted into paying customers.
Measuring this metric is essential since it shows the effectiveness of your sales strategies. Not only this, but it identifies which sales representatives have had more success in converting leads than others. The entire team could then be trained by that employee and the processes they take.
Efforts should be made to consistently improve this metric as it greatly impacts sales targets. A high sales conversion rate starts with the right prospecting. Look at your best customers, their industry, company size, and decision-makers, and then look for similar companies to reach out to.
11. Lead Conversion Rate
Metric type: Growth, Efficiency, and Outcome.
Formula: Lead conversion rate = (Total captured leads / Total visitors) x 100%

How effective is your marketing communication, like ebooks, white reports, and website copy, in generating leads? This is what the lead conversion rate tracks and can help you determine the mediums that bring in the most leads.
To improve the number of leads, strategically add social proof throughout your website. Add case studies for different industries and third-party review ratings next to call to action buttons to increase the possibility of capturing greater leads.
12. Lead to Opportunity Conversion Rate
Metric type: Growth, Efficiency, and Outcome.
Formula: Lead to opportunity conversion rate = (Total number of opportunities / Total number of leads) x 100%

The sales process looks different for each company, but generally, it follows the process of capturing leads, qualifying them as opportunities, and converting them into paying customers.
The exercise of converting leads into opportunities is an important one, and this is what this metric finds. How you qualify top-of-the-funnel leads into opportunities depends on your product and sales process.
For instance, someone signing up for your newsletter might be considered a lead. When the latter takes a demo call, s/he will be regarded as an opportunity.
Tracking the lead-to-opportunity conversion rate also shows the effectiveness of your sales team in nurturing leads over time to become opportunities. Hence, if you want to enhance this percentage, consider training your sales team.
PRO TIP: Learn how Jonathan Bland (Co-Founder, Omni Lab Consulting) grew a client’s Lead to Opportunity Conversion Rate from 25% to 74%.
13. Market Penetration Rate
Metric type: Growth and Outcome.
Formula: Market penetration rate = (Total customers / Total market size) x 100%

The market penetration rate tracks how big (or small) the size of the market pie you occupy. In other words, how much of the total market has adopted your product or service?
This a rather generic metric where the total market size is a subjective figure. While one should calculate this metric to gauge market potential, one shouldn’t rely on it solely.
If you want to increase the ‘slice of the pie,’ identify and target new segments within your existing market. For instance, a product onboarding software targeted to customers can offer an employee onboarding variant to occupy a greater market share.
14. Sales Cycle Length
Metric type: Efficiency and Output.
Formula: Sales cycle length = Total number of days it takes to close a deal / Total number of deals

The sales cycle length metric tracks the number of days it takes to convert leads into customers. The shorter this number, the better. However, this figure will change for different products and also for different sales representatives, as some are better at closing a sale than others.
Generally, free or lower-priced plans witness a shorter cycle length, whereas enterprise clients take longer to convert because of the legalities and complexities involved. In any case, one should strive to optimize the sales cycle length by reducing the number of days.
One tip to speed up this metric is to be open and transparent about your pricing from the get-go. This will ensure that no time is wasted by either party and only those leads progress through the sales funnel who are willing to pay your price.
15. Average Annual Contract Value (ACV)
Metric type: Growth and Outcome.
Formula: Average contract value = (Total contract value – One time fees) / Contract term length

This sales performance metric example spans out the total value of a customer’s contract into an average value per year.
Providing a good customer experience is key to increasing the ACV. Happy and satisfied customers would upgrade their plans when the need arises. Hence, increasing their contract value.
16. Sales Expense Ratio
Metric type: Efficiency and Input.
Formula: Sales expense ratio = (Operating expenses / Net sales) x 100%

What’s the cost of making a sale? This is what the sales expense ratio tracks. Since this is money flowing out of your business, you want to pay attention to any inefficiencies and remove them accordingly.
Choosing an affordable sales tech stack is one way to reduce the sales expense ratio. With so many sales scheduling, email automation, and dashboard reporting tools (among others) available today, it should be easy to select an effective yet affordable sales tech stack.
17. Pipeline Coverage
Metric type: Growth and Input.
Formula: Pipeline coverage = Total pipeline size / Sales target

Pipeline coverage is another commonly tracked sales performance metric. It measures the number of opportunities you have in your pipeline compared to your sales target or quota. A healthy pipeline coverage has 3 to 4 more times opportunities than the sales target.
This shouldn’t mean that irrelevant opportunities are consistently added to the pipeline. Give your sales teams a few requirements, behaviors, and expectations to look for in the right leads.
Related: Sales Pipeline Report: How to Build One, What to Include In It, Benefits, and Best Practices
18. Win Rate
Metric type: Growth, Efficiency, and Output.
Formula: Win rate = (Closed deals / Total deals) x 100%

The win rate refers to the proportion of closed, aka successful, deals out of the total deals pursued. You can track the win rate on a team and individual level to gain valuable insights into your sales practices and what can be improved.
A deal is closed when a sales representative shows how effectively your product solves the problem that the customer is facing. It takes some persuasion, showing social proof, and highlighting the product value offered. To close more deals and get a higher win rate, train the sales team on your ideal customer profile, product functionality, and what sets you apart from others.
19. Deal Slip Rate
Metric type: Efficiency and Output.
Formula: Deal slip rate = (Number of deals lost / Total number of deals pursued) x 100%
The deal slip rate is the percentage of lost deals.

Although it’s impossible to win every deal, it’s crucial to consistently track this metric to detect any potential increases in the deal slip rate. You should look out for what changed (did you target a new segment or adopt different strategies) and take corrective action.
You can lower this percentage by effectively qualifying leads. Ensure only relevant leads enter the sales pipeline so any efforts to nurture them don’t go wasted.
20. Quota Attainment
Metric type: Growth and Output.
Formula: Quota attainment = Total sales / Sales quota

Was your sales team successful in meeting your sales targets, or did the target exceed the actual sales by a long shot? The quota attainment metric answers such questions.
Monitoring this metric is crucial since it shows individual team members’ performance and helps forecast future growth.
To help your team achieve the desired sales quota, you must choose the right targets. It should be achievable but slightly challenging so it motivates them to perform better.
21. Number of Meetings Booked
Metric type: Efficiency, Growth, and Output.
Formula: Meetings booked = Number of meetings scheduled / Total number of replies from prospects

Booking a meeting is the first step towards higher conversions and sales. Whether inbound or outbound, tracking the number of meetings booked over time helps forecasting sales for the future.
For outbound marketing, measuring this KPI for individual sales representatives shows their effectiveness in prospecting and communicating with potential clients. This also highlights any gaps in employee training that need to be met.
Alex Birkett, a content agency founder, says, “Meetings booked is the big one. Obviously, it should be with sales-qualified leads – lead quality is incredibly important at any company, but especially a small agency like I run. But at the end of the day, we trust our sales process, social proof, and value proposition, so if we can simply get more people on calls, that’s the best leading indicator of our future sales performance.”
22. Number of Sales Pitches
Metric type: Efficiency and Input.
Formula: Number of sales pitches = Total product demos / Total sales outreach emails and calls

A sales pitch is an attempt by sales representatives to convince potential customers to buy a product or service. Tracking the total number of sales pitches during a certain time measures how successful your sales team has been in resource and time allocation, as well as the individual performance and efficiency of sales representatives.
Matt Seaburn from Rent A Wheel shares why monitoring this KPI is important. He says, “Keep track of how many sales pitches you’ve been giving. Utilizing this information, you can gauge how many opportunities (on average) you will have to convert leads into customers.”
23. Sales By Location
Metric type: Growth and Outcome.
Formula: Sales by location = (Total sales of a location / Total sales) x 100%

Some locations generate more revenue than others, and this metric tracks exactly that – which country or region rakes in the most sales.
Tracking this metric is important because you can adopt strategies to maximize sales from high-converting areas. You can also identify areas with low sales and take corrective action. Mary Berry from Cosmos Vita reinforces this.
“Monitor which geographic locations bring in the most sales. By analyzing these statistics, you can then consider targeting these locations more often in your marketing to ensure strong sales. On the other hand, you could also choose to do more marketing towards locations that have been bringing in fewer sales in order to help increase your brand awareness.”

Want to get highlighted in our next report? Become a contributor now
24. Percentage of Revenue From New vs. Returning Customers
Metric type: Quality and Outcome
Formula: % of Revenue From New vs. Returning Customers = (Total revenue from existing or new customers / Total revenue) x 100%

This sales performance metric measures how much revenue is generated from new and existing customers. If you witness greater revenue from existing customers, this means your retention strategies are effective, and your customers are experiencing value from your product.
On the other hand, greater revenue from new customers means your acquisition strategies are successful in bringing new customers. However, it can be an indication of high customer churn and disengaged users.
Andre Oentoro of Milkwhale shares the importance of this KPI, “Revenue on its own is already an important metric to track, but the percentage of revenue from new vs. existing customers will help you set targets and forecast future sales performance. If your existing customers are making most of the revenue, then it might be time to focus on gaining new customers.”
25. Customer Churn Rate
Metric type: Quality and Outcome
Formula: Churn rate = (Total lost customers / Total number of customers at the beginning) x 100%

The customer churn rate measures the percentage of users who stop using your product or service. These are lost customers and shouldn’t be confused with revenue churn. In the latter case, you might still have a customer, but they would’ve downgraded their plan.
Measuring churn is critical for the overall profitability and growth of any company. Acquisition is expensive and not scalable in the long-run. While some churn is inevitable, you should reduce this percentage as much as possible.
The best way to lower churn is to identify early signs of it. Analyze product usage data and identify where customers drop off from the customer journey. You should engage them here and move them along the journey by sharing helpful resources or getting in touch with them directly to address their concerns.
Related: Save Your Business From Churn: 9 Churn Risk Factors to Identify
Free Sales Performance Dashboards to Get Started
Now that you know some commonly used sales performance metrics, it’s time to implement them and take action.
The easiest (and quickest) way to do so is by customizing a readymade sales performance dashboard to your liking. Fortunately, there are a number of dashboards to choose from in Databox. Below are our top-performing ones:
Sales Overview Dashboard
This free Sales Overview Dashboard shows a monthly overview of your sales team’s performance.
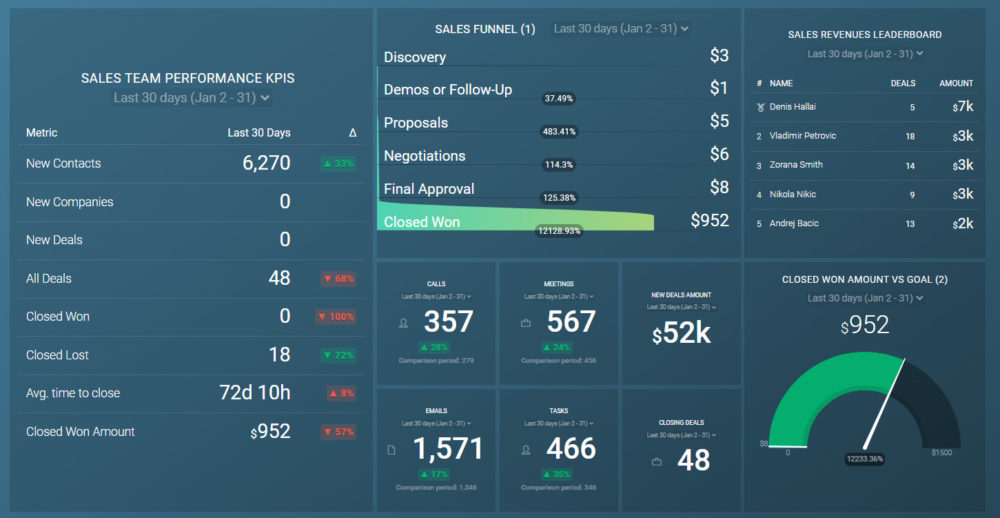
Use this dashboard to:
- Understand your current sales pipeline
- Track sales rep performance
- Compare team results to revenue goals
Marketing and Sales Pipeline Performance Dashboard
This Pipeline Performance Dashboard gives you an in-depth look of your marketing and sales pipeline and helps you understand how well your marketing efforts translate into actual sales and revenue.

Use this dashboard to understand:
- How healthy is your sales and marketing funnel?
- What are the key conversion rates between lifecycle stages?
- How well are your landing pages and CTAs performing?
HubSpot CRM Dashboard
This free HubSpot CRM Dashboard provides HubSpot CRM users with data concerning deals and pipeline performance.

Download this dashboard to get an instant snapshot of your deal flow and progress toward your monthly sales goals:
- Get a live funnel with MQLS, SQLs, Opportunities and more
- See which team members are active the most and have most deals won
- Compare this month’s activity to last month
- Get a better understanding at which stages of the funnel leads drop off the most
Pipedrive CRM Dashboard
This Pipedrive CRM Dashboard gives Pipedrive CRM users visibility into their sales pipelines and how deals are moving through different stages.

Get full visibility of your team’s activities and efforts toward winning more deals by understanding:
- What’s the value of all won deals?
- How many deals have my sales team closed this month?
- Who is my best-performing sales rep?
- What are the most common reasons for lost deals?
Sales Activity Dashboard
This HubSpot (Sales Activity) Dashboard tracks each stage of the sales funnel for HubSpot users.

Get an Instant snapshot of your top-of-funnel sales goals, activities conducted by your sales reps, and much more.
Sales Team Drilldown Dashboard
This Sales Team Drilldown Dashboard helps to compare each sales representative’s performance and productivity.

Download this dashboard to understand:
- How your sales reps are performing comparatively
- How many new deals were created and calls logged by sales rep
- How many deals were closed and what is the close rates for each rep
Monthly Sales Activity Dashboard
This Monthly Sales Activity Dashboard tracks monthly activities concerning emails, calls, and deal stages.

Track sales reps monthly progress in multiple areas and understand:
- The level of progress in a sales rep’s sales and deals pipelines
- How do the sales rep’s monthly activities compare to last month?
- What is the rate at which the sales rep is creating and closing deals?
Salesforce Leads Dashboard
This Salesforce Leads Dashboard gives detailed insights into your leads in Salesforce.
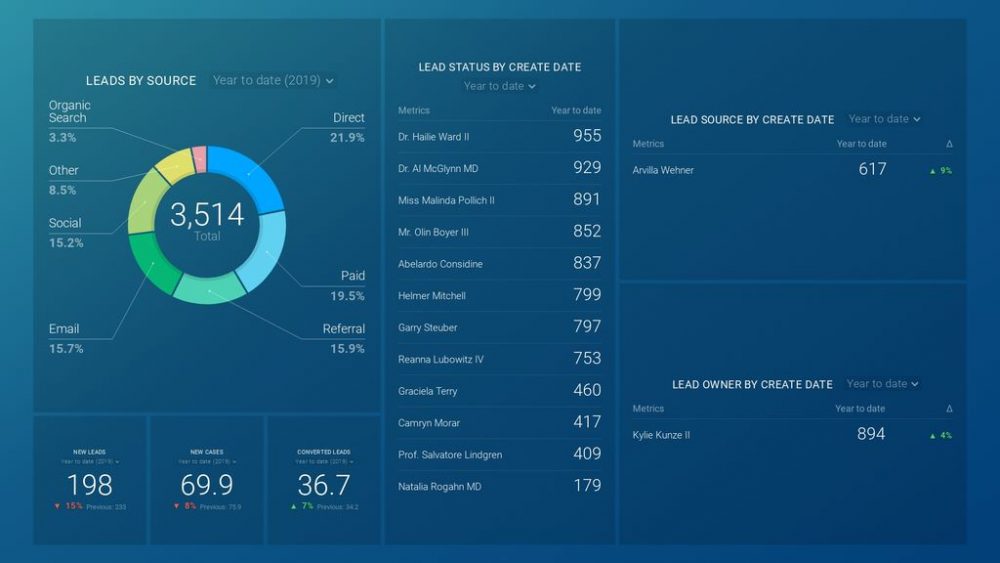
Track your sales progress without hassle by understanding:
- Where your leads come from
- How many new and converted leads you have
- What stage your leads are in
- Who is managing a particular lead
Streamline Sales Monitoring and Reporting with Databox
If there’s one thing you learn from this article, it should be that to completely understand the effectiveness of your sales team and processes, you must monitor multiple sales performance metrics.
However, tracking them can be a hassle, especially if you gather these sales metrics from different sources. For peace of mind when monitoring and interpreting data, you need Databox by your side.
Databox combines all your essential sales key performance indicators into one single screen. Set goals, spot trends, and view data updated in real time. You can choose from more than 4,000 metrics, so there’s something in store for everyone.
You can then visualize and report your team’s performance through attractive dashboards. Create one from scratch, choose from our library of existing dashboard templates, or ask our team to create one for you.
Ready to give Databox a go? Sign up for a free account today and unleash the power of meaningful data without losing your mind.


