


![Marketing KPI Dashboard: How to Create One and Which Metrics to Include [12 Free Templates]](https://cdnwebsite.databox.com/wp-content/uploads/2022/06/18061530/marketing-KPI-dashboard.png "Marketing KPI Dashboard: How to Create One and Which Metrics to Include [12 Free Templates]")
Table of contents
Are your marketing and sales efforts bringing you enough qualified leads? Are there leaks in your funnel that you can fix? Are you contributing to your company’s high-level goals?
These are only a few of the important questions your marketing and sales teams need to answer to make sure they’re spending their budgets optimally and that their strategies are effective. To answer these questions, most teams use KPI dashboards with the most relevant metrics to track and measure their success.
Our survey showed that all companies, whether they’re agencies or B2B or B2C services or products, use at least one marketing dashboard to monitor their KPIs. Over 51% of respondents have up to four dashboards, while around 8% of them have more than five.

In the following sections, we’ll discuss the benefits of using marketing KPI dashboards, the metrics you should include, how to build an efficient marketing KPI dashboard, and more.
Jump to the section you’re most interested in:
- What Is a Marketing KPI Dashboard?
- Benefits of Using a Marketing KPI Dashboard
- What Metrics Should You Include in a Marketing KPI Dashboard?7
- How Often Should You Monitor Your Marketing KPI Dashboard?
- How to Build a Great Marketing KPI Dashboard?
- Marketing KPI Dashboard Templates
- Build Your Marketing KPI Dashboard in Databox for Free Today

What Is a Marketing KPI Dashboard?
A marketing KPI dashboard is an analytics tool that allows you to track and report on relevant marketing metrics and KPIs. Based on the analysis of these metrics, you can evaluate your marketing activities and make informed decisions about how to proceed with your marketing strategy.
Marketing KPI dashboards are commonly used by marketing and sales departments. These dashboards contain different data visualizations, which allow you a quick, at-a-glance overview of your KPIs in real-time.
Benefits of Using a Marketing KPI Dashboard
Introducing a marketing KPI dashboard can have multiple benefits for your whole business, not just your marketing and sales teams.
Here’s what may happen when you start tracking your KPIs in a dashboard:
- You may be able to forecast sales and revenue with more accuracy
- You can save valuable time and resources
- You will be able to present your data to other teams more efficiently
- You will be able to gain real-time insights to modify your activities as you go, and more.
We asked more than 35 experts to share their perspectives on the benefits of using marketing KPI dashboards, and the top two answers we got were:
- Marketing KPI dashboards allow you to measure multiple KPIs and metrics simultaneously.
- Marketing KPI dashboards make data easily accessible.

8 Metrics Should You Include in a Marketing KPI Dashboard
A marketing KPI dashboard is only as good as the metrics you choose for it. Here’s what marketing KPIs experts from around the world choose for their marketing dashboards.
- Traffic
- Conversion Rate
- Customer Retention Rate
- Bounce Rate
- Customer Lifetime Value
- Customer Acquisition Cost
- Cost per Click
- Cost per Lead
Traffic
Website traffic indicates how successful you are at your attempt to drive internet users to visit your website. Tracking traffic helps you understand:
- How many new users visited your website in a time period and
- How they found your website (through social, direct, organically, etc.)
For many, traffic is the number one KPI that should be included in your marketing dashboard because you’ll want to know “how many people are actually seeing your marketing messages and whether or not they’re engaging with those messages”, according to Luke Lee of Ever Wallpaper.
Some marketing pros even have a dashboard dedicated completely to traffic:
“We have a separate digital marketing dashboard that measures site traffic, including source data like organic search and social media vs. paid search and other channels that drive traffic and inquiries,” says Kent Lewis of Anvil.
Conversion Rate
Conversion rates indicate how many of your website visitors take the desired action on your website: make a purchase, sign up for a newsletter, schedule a call, and so on.
Ivan Andrianko of Rocketwheel Productions says that conversion rate, other than traffic, is one of the two main marketing KPIs you should track in Google Analytics: “It’s important for us to know if a particular campaign is getting the results we need, but ultimately what really matters is 1. if more people are coming to our site and 2. if they’re signing up for sales calls and quotes.”
Conversion rates are essential for any business as they indicate how well your campaigns, website copy, design, and overall experience can move the visitor toward the bottom of the funnel and generate new leads.
Erin Neumann of Be Aligned Web Design says she loves to track conversion rates: “The reason to include it on our marketing KPI dashboard is that it helps understand the percentage of visitors that turn into leads and leads into customers.” Along with return on investment (ROI) and Customer Lifetime Value, tracking conversion rates helps Neumann and her team improve their sales methods and customer acquisition process in the long run.
PRO TIP: Whether you’re investing time and resources into content and SEO or rely heavily on paid search and paid social, all that website traffic won’t mean much if the landing pages you’re driving traffic to aren’t converting well. So how successful are your landing pages? Watch the video below to find out how to conduct a thorough landing page analysis.
Customer Retention Rate (CRR)
Customer retention is more affordable than customer acquisition, so it’s no wonder marketing professionals pay attention to this metric. Businesses may track their overall retention rate, or monitor each customer individually, like Chris Gadek of AdQuick.
“We keep a close eye on our Customer Retention Rate (CRR) as it measures the number of customers that our team retains over a given period. Each customer is tracked individually, with one record per period. And widening your data set to include additional information such as email engagement, contract type, number of users on the account, and response time can help you determine the driving factors impacting your retention rate,” says Gadek.
Bounce Rate
“Bounce rate measures the percentage of visitors to your website who do land on a page but don’t navigate any further and leave,” explains Jessica Robinson of Speaking Nerd.
Tracking your bounce rate can help you identify effective and ineffective ways to keep the visitors on your website with persuasive copy, quality content, and a pleasant user experience. You may discover that your website navigation is confusing, or that your content doesn’t match the user search intent.
“We have included this KPI on our KPI dashboard as it helps us know whether a page is able to withhold the visitors and direct them forward towards the intended call of action,” says Robinson.
PRO TIP: Watch the video below to learn how to properly track Bounce Rate by Blog Post so you can see which posts are most relevant and engaging to your audience.
Customer Lifetime Value (CLV)
How much does a customer spend on your products or services over their entire relationship with you? To answer this question, you need to track Customer Lifetime Value. Tracking this metric and comparing it to your Customer Acquisition Cost (CAC) helps you determine how profitable your business is.
Also, it can help you forecast your company’s future growth: “Customer lifetime value is one of the factors that determine the long–term future of a company. If customer lifetime value is high, the company is expected to grow and flourish. If it is low, it clearly indicates that something needs to be done to enhance customer loyalty,” explains Jessica Robinson of Speaking Nerd.
Robinson adds that tracking CLV helps her team track customer loyalty. “We have included this KPI on our KPI dashboard to keep a direct check on customer loyalty and measure the impact our efforts for boosting customer loyalty are having on our clients.”
Customer Acquisition Cost (CAC)
To be on top of your marketing costs, you need to measure how much you spend on acquiring new customers. Experts agree that customer acquisition cost is an essential KPI, not only for inbound marketing but for outbound marketing as well.
“I calculate my CAC not only for digital marketing, but also for outbound marketing. This way, I can see the full scope of my efforts and which ones are most effective. I determine the time frame in which I will evaluate this cost when calculating this metric i.e monthly I further subdivide that component by campaign type, and then evaluate how successful and profitable each activity is,” says Leslie Radka of GreatPeopleSearch.
Jessica Robinson of Speaking Nerd adds that it’s one of the most critical KPIs for all marketing teams who aim to “reduce the cost per customer acquisition and enhance the return on investment.”
When your marketing efforts and messaging are right and resonate with your audience, your CAC will go down, especially if you keep an eye on this metric in correlation to other KPIs. Mike Perez and his team at Spacelift recently discovered that their CAC was going down when they included data from their retargeting campaigns.
“This means the retargeting ads lower the CAC. After some calculation and analyzing the stats, we realize that the cost of retargeting ads is worth it compared to the CAC it reduced. In an interactive dashboard, changing one data source affects the behavior of other charts and tables. We use it to plan the next step. Once the target is set, like reducing the CAC, we find the metric that needs to be changed to bring the reduction in CAC – and work on it. It is reverse engineering and can only be done if your KPI dashboard includes CAC,” shares Perez.
Cost per Click (CPC)
If you regularly run campaigns on social media, you should make sure your social media ads aren’t eating away at your budget. You can do it by including the cost per click metric in your marketing dashboard.
Social media cost per click indicates how much money you spend every time a user clicks on your social media ad. If this number is too high, it means something in the campaign isn’t working well. It can be wrong targeting, unattractive design, ineffective copy, etc.
“This metric helps us understand whether our investment is generating good returns or not. If it doesn’t, then obviously there is something for us to do in this regard,” concludes Jessica Robinson of Speaking Nerd.
Related: Facebook CPC: 17 Ways to Reduce Your Advertising Costs on Facebook
Cost per Lead (CPL)
Cost per lead allows you to identify your most profitable marketing activities and redirect your budget accordingly. For example, by tracking cost per lead, you can identify marketing channels that don’t generate many leads and stop investing too much of your budget in it, while focusing on more effective channels. Sometimes, the results may even surprise you.
“Through this metric, we understood whether we should expand our marketing efforts for acquisition or focus on a consumer retention strategy. We figured out that the marketing channels with the least investment, generated significant results, making them effective,” shares Rodney Warner of Connective Web Design.
“Our venture followed a pretty straightforward process when calculating CPL, taking total expenses incurred in a specific marketing campaign divided by the number of leads generated. This formula allowed us to make an informed decision when investing towards a marketing channel. We were efficiently able to allocate our budget through this metric which meant that no resources were going to waste.”
PRO TIP: How Well Are Your Marketing KPIs Performing?
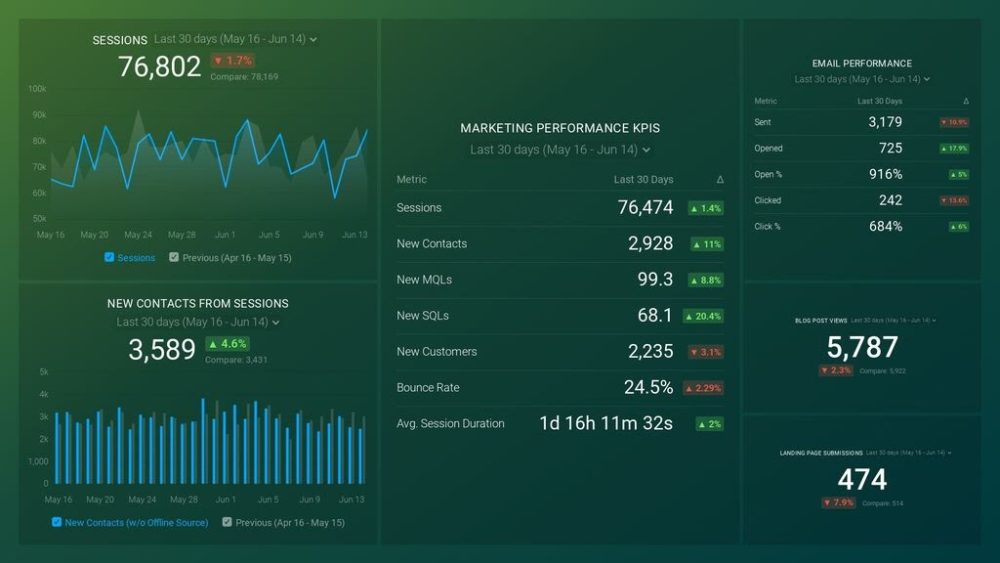
Like most marketers and marketing managers, you want to know how well your efforts are translating into results each month. How much traffic and new contact conversions do you get? How many new contacts do you get from organic sessions? How are your email campaigns performing? How well are your landing pages converting? You might have to scramble to put all of this together in a single report, but now you can have it all at your fingertips in a single Databox dashboard.
Our Marketing Overview Dashboard includes data from Google Analytics 4 and HubSpot Marketing with key performance metrics like:
- Sessions. The number of sessions can tell you how many times people are returning to your website. Obviously, the higher the better.
- New Contacts from Sessions. How well is your campaign driving new contacts and customers?
- Marketing Performance KPIs. Tracking the number of MQLs, SQLs, New Contacts and similar will help you identify how your marketing efforts contribute to sales.
- Email Performance. Measure the success of your email campaigns from HubSpot. Keep an eye on your most important email marketing metrics such as number of sent emails, number of opened emails, open rate, email click-through rate, and more.
- Blog Posts and Landing Pages. How many people have viewed your blog recently? How well are your landing pages performing?
Now you can benefit from the experience of our Google Analytics and HubSpot Marketing experts through a plug-and-play Databox template. It includes key metrics for tracking your leads and can be used as a standalone dashboard or as part of your marketing reports. You can try it during your free trial no setup headaches.
You can easily set it up in just a few clicks – no coding required.
To set up the dashboard, follow these 3 simple steps:
Step 1: Get the template
Step 2: Connect your HubSpot and Google Analytics 4 accounts with Databox.
Step 3: Watch your dashboard populate in seconds.
How Often Should You Monitor Your Marketing KPI Dashboard?
According to over 48% of the experts who participated in our survey, weekly or bi-weekly dashboard monitoring allows you to stay up-to-date with any important changes in your marketing performance. Only 20% of survey respondents monitor their dashboards daily, while around 31% of them do it on a monthly basis.

How to Build a Great Marketing KPI Dashboard
What KPIs you’ll include in your dashboard depends on many factors, starting with your marketing goals. The following steps will help you build a great marketing KPI dashboard.
- Identify Your Audience
- Set a Reporting Goal
- Select the Appropriate KPIs
- Connect Your KPIs with the Right Data Sources
- Choose a Dashboard Building Tool
Identify Your Audience
Think about who you’re going to present the report to. Different audiences will care about different metrics and have different marketing knowledge.
Your teammates have great marketing knowledge so you may be able to include more detailed marketing metrics in the report. They will be interested in the website traffic to lead ratio and the customer lifetime value.
However, if you’re presenting to the management, they may need revenue and sales-related marketing metrics because they’re not familiar with everything you’re tracking for internal purposes. They’ll want to know about ROI and similar metrics.
To make your dashboard report understandable for everyone in the room, make sure you write down everyone who will have access to the report and create the dashboard accordingly.
Related: Reporting Strategy for Multiple Audiences: 6 Tips for Getting Started
Set a Reporting Goal
Before you present your dashboard to the audience, determine what your main objective is. Do you want to present your results to the leadership so they approve a budget increase? Or you want to show your teammates how a recently updated strategy is performing?
Write down your goals before you start putting together the dashboard, so you can choose the appropriate KPIs and data visualizations.
Related: Goals Based Reporting: Everything You Need to Know
Select the Appropriate Marketing KPIs
Depending on your audience and goals, choose the KPIs to include in the dashboard.
Don’t forget to keep the report streamlined and concise, even if you’re presenting to people with great marketing knowledge. The point of your data dashboard is to provide a clear picture of your performance without getting too complex. Your data should tell a story, so make sure you present the visualizations in a logical order.
Connect Your KPIs with the Right Data Sources
Google Analytics is probably your go-to data source for tracking website analytics, but is it the only one to help you evaluate your efforts?
If you invest in SEO, you may want to check out Google Search Console, as well. If you run an e-commerce website, you may need data from Shopify to track your success, and so on.
Choose a Dashboard Building Tool
Your dashboard efficiency depends largely on the automated reporting software you choose.
A good dashboard builder should offer templates, so you can save time instead of building reports from scratch, support a wide range of integrations, offer customization options, automated reporting, and more. Google Data Studio and Databox are great examples of such tools.
Marketing KPI Dashboard Templates
To get a better idea about what your marketing KPI dashboard should look like, we’ll share a number of examples below: you can download the templates or use them as an inspiration for a customized dashboard you’ll build on your own.
- Google Analytics Landing Page SEO Dashboard
- Facebook Ads Dashboard
- Social Media (Awareness & Engagement) Dashboard
- Google Analytics Content Analysis Dashboard
- HubSpot Email Campaign Dashboard
- YouTube Channel Performance Dashboard
- HubSpot Lead Generation Dashboard
- Blog Performance Tracking Dashboard
- Google Analytics Traffic Growth Dashboard
- Instagram Business Dashboard
- Google My Business Dashboard
- Google Analytics Site Performance Dashboard
Google Analytics Landing Page SEO Dashboard
Your landing page’s main task is to convert visitors into leads. If you want to evaluate the performance of your landing pages, this free Google Analytics Landing Page SEO dashboard template will help you do just that. By tracking organic sessions, goal completions, bounce rate, and other metrics, you’ll learn which landing pages generate the most signups and which need to be optimized.

Facebook Ads Dashboard
Monitoring your Facebook ad campaigns is critical if you want to ensure you’re not wasting your budget. Keep a close eye on your campaigns with this Facebook Ads dashboard template, where you can track all relevant metrics, such as impressions, engagement rate, amount spent, frequency, cost per click, and more.

Social Media (Awareness & Engagement) Dashboard
Is your social media marketing strategy contributing to your overall marketing goals? You can easily learn this by using the Social Media (Awareness & Engagement) dashboard template. Here, you’ll have an at-a-glance overview of metrics such as likes, followers, and sessions, so you can measure your social media growth and identify the content that resonates best with your audience.

Google Analytics Content Analysis Dashboard
Is your website content valuable enough to attract clicks? Where do your visitors come from and how do they engage with your content? You can use this Google Analytics Content Analysis dashboard template to find out. By tracking pageviews by page, bounce rate, goal completions, and other available metrics, you will learn more about your audience and identify best-performing content and pages that need optimization.

HubSpot Email Campaign Dashboard
Do you regularly send newsletters, drip campaigns, and nurture other types of email marketing? With this HubSpot Email Campaign dashboard template, you can track and measure the success of your email marketing efforts. Track your open rate, CTR, and other metrics to learn more about how you can engage and convert your email audience.

YouTube Channel Performance Dashboard
How’s your video content performing? You can find the answer to this question in our YouTube Channel Performance dashboard template. It allows you to track relevant metrics such as gained and lost subscribers, total watch time, likes, comments, shares, and more. By monitoring this dashboard, you will learn if your video marketing strategy is working or if it could use a boost.

HubSpot Lead Generation Dashboard
Marketing and sales often work together to generate qualified leads, but you don’t need separate dashboards to track those leads. This HubSpot Lead Generation dashboard template allows you to track MQLs, SQLs, sessions, leads by source, and other important KPIs that help you identify which of your lead sources is the most effective one.

Blog Performance Tracking Dashboard
Quality blog content can help your brand establish authority within your industry. That’s why it’s critical to track your blog performance—by using this Blog Performance Tracking dashboard template. You can easily stay up-to-date with your most relevant metrics such as blog subscribers, top blog posts by pageviews, top blog posts by CTR, and more.

Google Analytics Traffic Growth Dashboard
When you can identify your best performing traffic sources, you can adapt your strategy to fully leverage the potential of those channels. To be able to do that, you need to monitor your traffic closely. We suggest doing it with our Google Analytics Traffic Growth dashboard template. Here, you can keep an eye on all relevant metrics, such as sessions by location or source, mobile traffic quality, social referrers, bounce rate, and more.

Instagram Business Dashboard
Is Instagram one of your main business channels? This Instagram Business (account overview) dashboard template enables you to gain insights into your overall account health and plan further actions to grow your follower count and engagement rate. In this dashboard, you can track your reach, impressions, profile visits, see the breakdown of your followers by country or gender, and more.

Google My Business Dashboard
Do you want a comprehensive dashboard that combines your Google Analytics account with data from Google My Business? This Website & Google My Business – Goals & Conversions dashboard template enables you to get a more granular view of your business performance by tracking a wide range of metrics: views, searches, phone calls, session sources, goal completions, photo views, and more.

Google Analytics Site Performance Dashboard
Numerous factors may affect your ranking on Google—one of them is page load speed. Is your website loading fast enough? You learn this (and so much more) by setting up this Google Analytics Site Performance dashboard template. Track metrics like average server response time, mobile page load time, load time by browser, lookup time by country, and more to ensure the best user experience on your site.

Build Your Marketing KPI Dashboard in Databox for Free Today
What channel generates the most traffic for your website? Where do most of your qualified leads come from? What subject lines have the best open rate? Does your audience watch your video content?
Questions are numerous, but the good news is that you can find the answer in one simple marketing reporting software.
Enter Databox, with all its handy features that allow you to track and measure your performance hassle-free.
We offer:
- 130+ integrations with the most popular CRM, marketing, ecommerce, accounting, analytics, and other tools
- Built-in data visualizations that perfectly fit the data you want to display
- Automated alerts that notify you about any unusual occurrences in your metrics
- Looped dashboards that you can connect for more comprehensive reports
- Freedom to create your own metrics and measure what matters to you
And so much more.
Have all these features sparked your curiosity? Wait no more and create your free Databox account in less than five minutes.


