


Table of contents
Keeping an eye on changes in trends and data is one of the most effective ways to ensure the ship stays on its charted course.
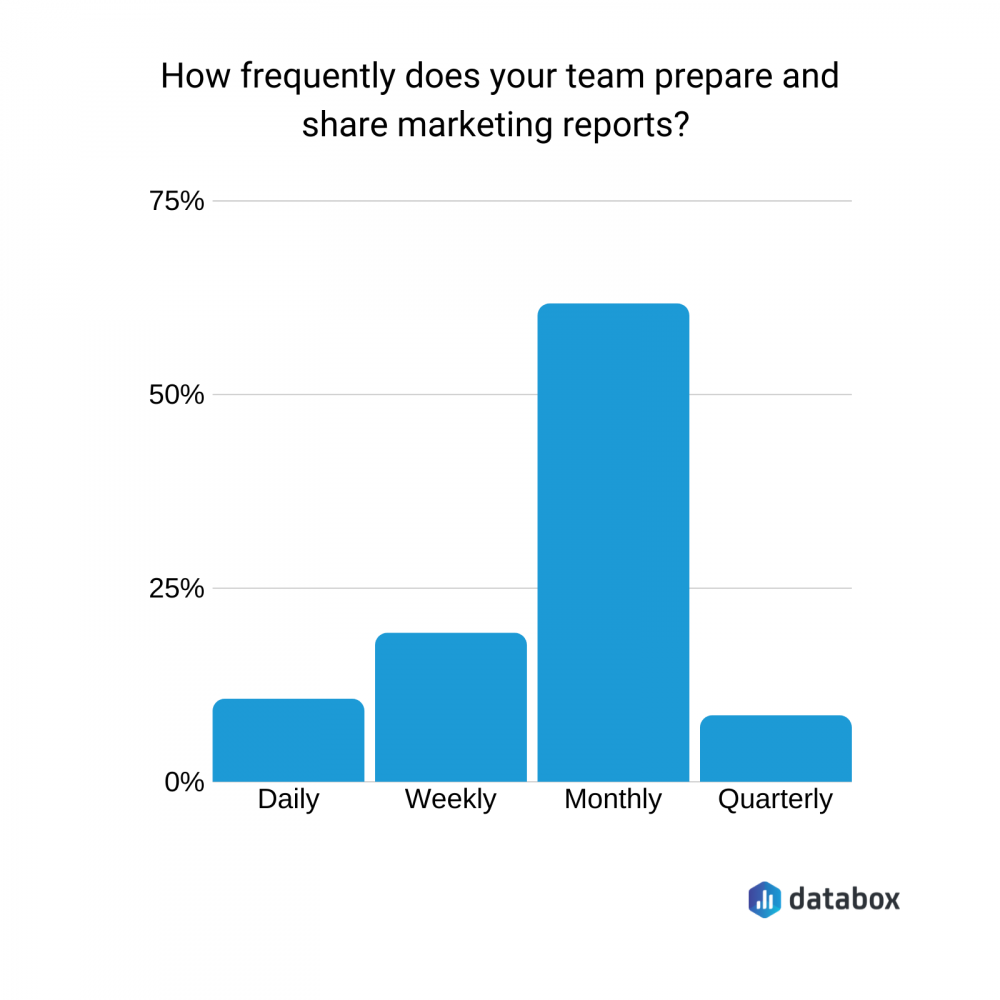
For most companies, this means the creation and presentation of marketing reports to bring departments and clients into the loop, help steer decision-making, and prove (or disprove) the viability of changes in approach post-mortem. And for the majority, marketing is the most monitored and reported operation, according to Databox’s state of business reporting.
But how can you be sure you’re getting the best, most actionable data out of your reports? There’s a lot of ground to cover, as omnichannel marketing encompasses a host of moving parts, platforms, and rationales. You can’t expect to develop a report that tackles all of it. So what do you include?

We went to some of our favorite marketing professionals for the answers. They provided us with several different perspectives and over 40 actionable pieces of advice for how to craft a useful, insightful marketing report that will move your efforts in the right direction.
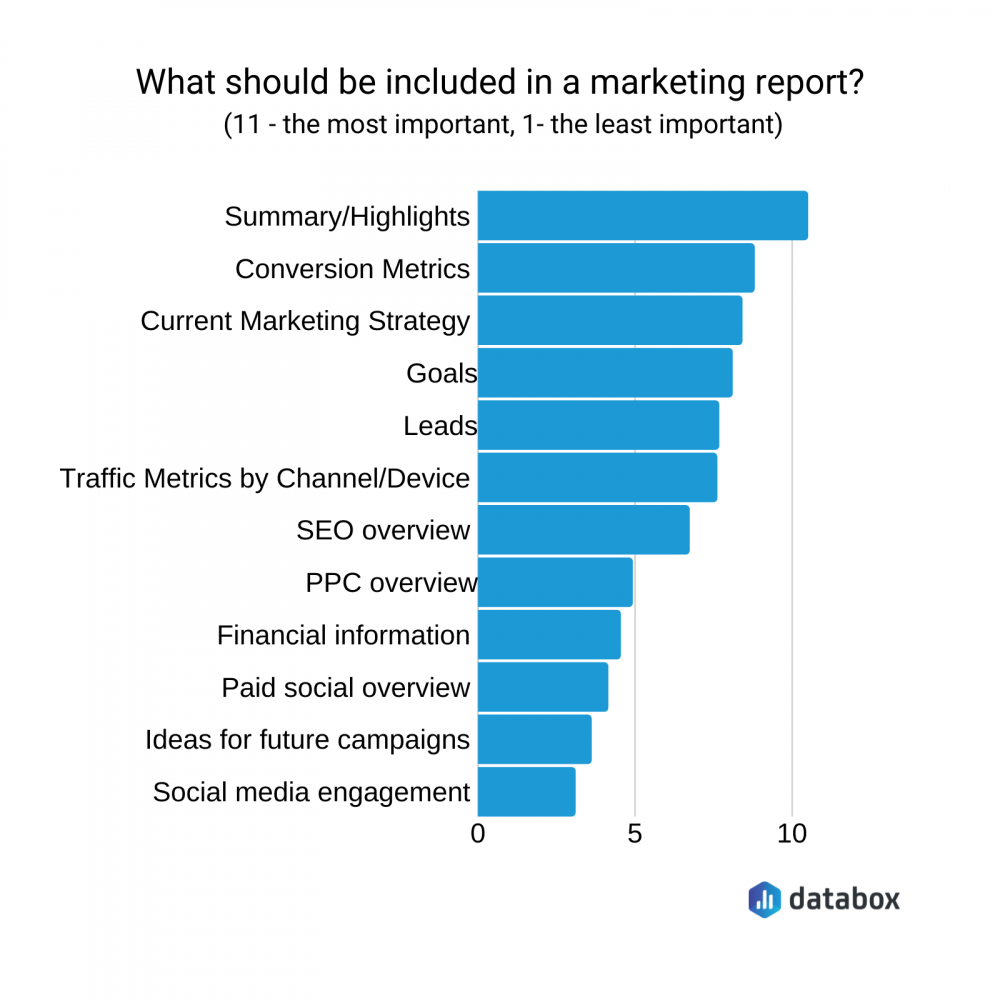
While most of our experts focused on different tips with regard to their report development, much of the insight they provided could be separated into four general types of advice:
- Narratives, Summaries, Overviews, and Action Plans
- Focus on Specific KPIs, Metric, or Goal
- Data Analysis and Historicals
- Use Good Data Tools
Click on the links above to jump to a specific section, or read on to get every tip and observation on this important reporting practice.
Narratives, Summaries, Overviews, and Action Plans
Getting a full picture of the campaign, its goals, outcomes, and plans of action serve as the most prevalent piece of advice. From tip to tail, creating a quality report becomes much easier when integrating these elements into your reporting.
Ernie Santeralli of ActiveCampaign gets things off the ground by establishing the reason at the outset. “Start by determining the purpose of the report. What story do you want to tell? Include the metrics and numbers that add details or context to the story. Don’t include metrics just because you have access to them.”
Simon Nowak of 3 Credit Scores gets information from the internal stakeholders that matter most. “Consult with your sales team. They’re on the front lines when it comes to things like leads and revenue. Their input on the data has value.”
Sales isn’t the only important department for quality reporting, however. As Deepshikha Dhankhar of Transfunnel Consulting explains. “ Don’t forget to include content marketing efforts. If your content has helped solve your prospects’ pain points, then it deserves a place in your overall marketing report.
Says Dhankhar. “Consistent content strategies and measuring the impact is imperative in identifying where you are in your overall marketing journey and how much of those goals you are achieving on a regular basis. Many businesses miss out on this crucial element and the impact it’s making on their overall growth.”
Once you get this input, says Dwayne Hogan of Evie Digital, it’s time to turn your attention to the data. “Remove black holes in data by explaining the full search marketing funnel, starting with rankings, impressions, CTR, sessions, behavior (bounce rates, exit rates, cart additions, etc) and conversions.”
Melanie Musson of 360quoteLLC then suggests getting the report off on the right foot by arranging those findings in a digestible format. “Make the first page visually-based. A good summary of the past quarter (or whatever timeframe you’re looking at) with tables and charts indicating trends is easy to understand and will help the explanation and data throughout the report make sense.”
From thee, tackle what’s happening right now, says Andrea Cruz of KoMarketing “Always start with current strategy, goals, and performance. These steps will layout where we didn’t hit the mark, what was learned and what we should be doing next.”
When you make your overall marketing strategy, you definitely make a multi-channel plan.” Says Zarar Amen of CANZ Marketing. “You, as the planner and executor, can see the bigger picture and how the channels fit together, working for the common goal.
For the reporting to be useful, however, you have to be able to translate that vision and goal, reminding us, ”others can’t see the integration. They don’t know the impact of the results of an Adwords campaign over your Facebook campaign. So, while you make a report, make sure to include the complete picture for the readers, whoever they are. Show them how the pieces of your jigsaw puzzle (campaigns of your strategy from different channels) fit in together.”
Colin Harrison of Nivo Digital recommends using “80/20 rule” in developing your reporting. “Focus 20% of your attention on what happened —whether positive or negative— and 80% to what you learned and what the next actions are to improve performance.”
Alysha Schultz of Intuitive Digital agrees with this bias to action. “You should already be prepared to present your strategy and the next steps to reach these goals (or exceed them) to the partner based on your expert analysis of the data. You should come to the meeting prepared to explain how the work your agency has done has produced the current results, and what work you’re going to do in the coming months to push ahead.”
Thomas Astrup of We.Care says that in high-quality reporting and planning, “For every 10 insights, there should be at least 10 actions. If that is not possible, it’s not a useful insight and it should be left out of the report. Focus should be on actions that lead to more conversions.”
Don’t get bogged down, though, says Charly Mostert of SmartBug Media “I’ve seen a lot of marketing reports (including some of my own in the past) go so far into the weeds that even explaining the report becomes a slog.” To avoid this issue, “Be sure to keep your marketing report story-driven and simple, with plenty of links to more drill-down reporting you can point to if questions pop up. This will also ensure you have time at the end to cover those all-new initiatives you’re trying to get buy-in for.”
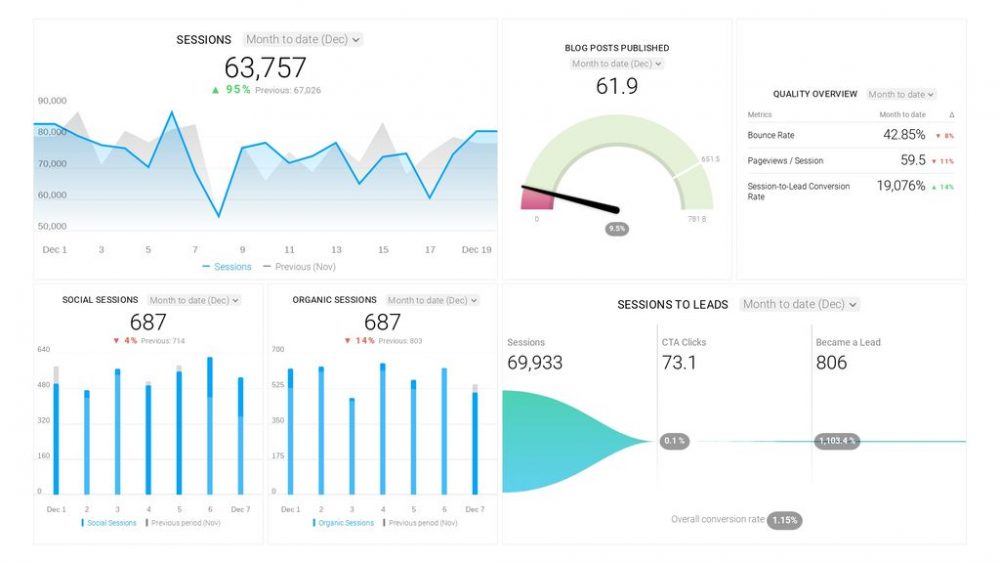
Editor’s Note: Want to know if your hard work is translating to sales from your marketing efforts? Get the Hubspot Marketing – Marketer Drilldown (sessions) dashboard to understand the relationship between content and conversions.
This narrative should be cohesive and easy to follow, according to Christina Hunt at Haus von Albe, who recommends having “a red thread throughout the entire report – meaning all data points, summaries, and learnings center around ONE point. That point can be sales, it can be audience demographics, it can be the change in user behavior. Whatever it is, remain consistent on that point or risk others having no take away from your work.”
Hunt observes, “As marketers, it’s key to remember who will be reading this report as often times it’s not another marketer, it’s finance or sales or another department. Think of how they can best take your findings and create actionables.”
Toni JV of JVT Media has a different word for this important concept. “Empathy. As a marketing expert (especially in the digital field) you have to have empathy for the fact that a lot of business owners don’t understand what all this technical mumbo jumbo means and what it’s about.”
“So to combat this,” JV recommends, “keep it simple and explain things in layman’s terms, and most importantly talk about what actually matters to the business owner.”
“So if you’re doing Facebook ads, talk about how many clients it got them, and how we can increase that number to get them even more clients in the future. They don’t care how many impressions you got or what someone’s dwell time was on your video ad, they care about results.”
Vishal Rewari of Innovation and Research Foundation recommends to then “summarise the key metrics (leading and lagging indicators) in a manner that clear action can be deduced.”
And Nick Hollinger of Visitor Queue Inc. reminds us to wrap it up well. “Ensure that you have a conclusion section that summarizes key insights and action items. From this conclusion section, create and communicate your plan of action, time frame, cost, etc.
Where you’re headed is more important than where you are (or have been) according to Tasmin Lockwood of Radial Path. “Don’t just report on what you’ve done, but suggest next steps. Pulling together reports is important to highlight what you’ve achieved, but so many people stop there and don’t use it as an opportunity to present next steps. So what, that CTA wasn’t as effective as it was the previous month? What are you going to do about it?”
Focus on Specific KPIs, Metric, or Goal
After you’ve framed a great report, use that framework to draw attention to a specific KPI or metric that will best serve the overall reporting structure and planning.
Manny Zarate of MDZ It Solutions Inc. likes to get right to the most recognizable metric! “Show what is important to the client! How your work is making them money, money!”
“Tie it back to the big picture,” says Tina Arnoldi of 360 Internet Strategy. “If your goals are direct conversions, a high volume of traffic is not necessarily a success”
PRO TIP: How Are Users Engaging on My Site? Which Content Drives the Most Online Activity?
If you want to discover how visitors engage with your website, and which content drives the most engagement and conversions, there are several on-page events and metrics you can track from Google Analytics 4 that will get you started:
- Sessions by channel. Which channels are driving the most traffic to your website?
- Average session duration. How long do visitors spend on your website on average?
- Pageviews and pageviews by page. Which pages on your website are viewed the most?
- Total number of users. How many users engaged with your website?
- Engagement rate. Which percentage of your website visitors have interacted with a piece of content and spent a significant amount of time on the site?
- Sessions conversion rate. How many of your website visitors have completed the desired or expected action(s) and what percentage of them completed the goals you’ve set in Google Analytics 4?
And more…
Now you can benefit from the experience of our Google Analytics 4 experts, who have put together a plug-and-play Databox template showing the most important KPIs for monitoring visitor engagement on your website. It’s simple to implement and start using as a standalone dashboard or in marketing reports!

You can easily set it up in just a few clicks – no coding required.
To set up the dashboard, follow these 3 simple steps:
Step 1: Get the template
Step 2: Connect your Google Analytics account with Databox.
Step 3: Watch your dashboard populate in seconds.
It’s all about knowing where the movement needs to be, according to Dominic Kent of Mio. “Know what your company needs to measure most effectively. It’s no good presenting 20 slides of stats if the one thing you genuinely need to grow your business is hidden away or still needs to be worked out after.”
Editor’s note: Want to stay updated on your teams’ performance without scheduling extra meetings or sending long emails? Keep everyone in the loop on your most important KPIs with Databox Alerts feature.
Romy Fuchs of BEE Inbound AG agrees. “Before you can create a marketing report, you should be clear about the goals of marketing, which in turn is derived from the company’s objectives.” Goals aren’t nebulous, however. “Only if there are smart goals (Specific, Measurable, Achievable, Reasonable, Time-bound) a report can be compiled. The goals can be used to define the appropriate key figures and KPIs, which are a basic component of the report.
“In addition, you should never lose yourself in a multitude of KPIs. Less is more!”
Stating goals and accomplishing them should be the main focus, says Julia Tiedt of SmartBug Media. “Every strategy and tactic in your marketing plan and report should revert back to your goals. How are each of the items you are reporting on helping you accomplish each of your goals? I typically break down my reporting into high-level goal dashboards and then have subsequent KPI dashboards following.
“But remember, these dashboards are living things,” says Tiedt. “Continue to update them and make them even better and more useful for your team.”
Some experts we interviewed chose to focus on a specific metric, based on the type of reporting they needed to accomplish, and for what purposes. “
Faizan Ali of WPBeginner looks at SEO. “I’ll always include the SEO goals report in my actionable marketing report. The report is not just about rankings; we also analyze our content and outreach approach. We look for improvements based on our KPIs and take it up from there in the next quarter.”
Andrew Ruditser of Maxburst also regards SEO as an MVP metric. “It is very important to keep track of your website metrics and what has increased/decreased over that period of time. This will help you see what strategies you used helped benefit your company on the web and those that did not. Knowing those that helped your company will give you an advantage by continuing to use those same strategies and help your metrics continue to increase over time.”
Meanwhile, Pete Watson-Wailes of Tough & Competent focuses on the buyer. “For us, it’s about tying the report back to user personas. All marketing activity, whether it’s comms, pricing, product, experience or distribution-based, should be geared around positively affecting the journey of a segment of either current or potential customers.”
“Therefore,” says Watson-Wailes, “it should be tied back to a specific KPI with defined success and failure criteria, chosen to show first or second-order effects on effectiveness, judged by revenue. Without a hard metric tied to a group of users that demonstrates actual business value, it’s impossible to say that movement on any metric in any direction is positive. It’s about making reporting specific and actionable, and showing effectiveness as well as efficiency, so you can see the effect of any work, whether positive or negative.”
Alicia Mayle of InnerAction Media goes by a user request for. “Oftentimes, we find that our clients are most interested in customer geographic and demographic information. I would recommend including this information at the beginning of your report to catch your stakeholder’s attention.”
Lauren Walter of Social Media Optimism In order to prepare a complete and actionable marketing report, it’s important to determine your goals and KPIs. Make sure you’re tracking and reporting on metrics that will inform you about your progress toward your goals, how you can adjust to better meet your goals, and when your goals have been completed.
“For example,” says Walter, “If you are creating content on your website and promoting it on your social media in order to collect interested users’ emails, then you will want to set up conversion goal tracking for email sign-ups and include that in your report. Not only that; you will also want to track which content is performing best and leading to the most conversions.”
“You may want to include information from your goals in Google Analytics to see which content pieces are resulting in the most conversions. This can help inform your content strategy by telling you which types of content work best, as well as your social strategy by indicating which content pieces should receive more promotion.”
Jonathan Aufray of Growth Hackers takes a hard look at how marketing is integrated into the business and its success as a whole. “When preparing a complete and actionable marketing report, you need to highlight how marketing is impacting the business, especially how it impacts the KPIs. If your main KPI is to generate leads, you want to show how each channel (Content, SEO, emails, Ads, etc.) moved the needle.”
All that data is useful, but only if it’s in a useful format, says Caroline Scholten of Chocolate Films. “Keep a spreadsheet with data on your main Key Performance Indicators, to be able to compare your Marketing performance through time and make the right decisions based on that.”
It’s not just about the hard numbers, either, says Alexander Lewis of Paessler AG. “It’s important to track what people are saying about your company. Not everyone will link back to your website or email you about features in the media. Sometimes, you have to track that information down yourself.”
“One easy way to find mentions of your company,” recommends Lewis, “is to use Google search. Simply type your company name (with parentheses) into Google, like so: ‘Paessler.’ Then, sort your results by News instead of All. You should see a simple list of publications and blogs that have mentioned your brand recently. You may discover mentions your team didn’t even know about.”
Jane Prizer of Hausera looks at win/loss numbers to gauge things, as well. “Be sure to constantly monitor customer/client retention to make sure your ratio between loss of customers/clients and the acquisition of new clients/customers doesn’t sway too far in favor of the former’s direction. Whatever methods you are using to monitor this, make sure there is a strong sense of consistency, or else you’ll be making comparing data points down the road much more difficult.
Ed Loyal Entrepreneur of Loyal Entrepreneur says, “Focus on behavior stats. This is the key to creating a great user interface and a fantastic user experience.
Keep it simple, says Kenneth Zhu of Complete Business Online “An overwhelming report with 100 different metrics does not help your client in reading your report. You want your client to understand your importance in generating tangible results for them to build a close, long term relationship.”
“For example, if your goal is to tackle conversions, you should be addressing only conversions data and metrics that influence or are being influenced by conversions. For instance, relevant metrics to track with the help of a marketing dashboard software could include cost per click, cost per conversion, conversion rate, interaction rate. Total cost should be highlighted separately and not be combined with conversion data & recommendations.”
Data Analysis and Historicals
When all else fails, you can always rely on the data. Several of our experts dig into the numbers first from their marketing dashboards for guidance on what comes next.
Natalia Luneva says, “Compare the numbers to the previous month, previous quarter and previous year to get a full picture of where we are and to avoid the numbers to be skewed.”
Storm McManus of Virtual Storm also looks at historicals, comparing apples to apples. “In it’s simplest form, keep your headings the same each month and report on the same data points, modifying the date range for each. This will help when it comes to reviewing metrics over a long period of time to inform any change in strategy or new action plans.”
Varun Celly of Geeks Of Digital reminds us that data is not just an inbound phenomenon. “To take more actionable steps, have all your data from different sources come to a central platform. Your measurement should be in 2 formats – Output metrics and Input metrics.”
As Celly explains, “Output metrics are outcomes like traffic increase or drop, conversions, etc. Input metrics are those metrics that were done in order to achieve output metrics. Like content update, page-level optimization, etc.”
“If you use a top-bottom approach you will be able to define actions for every analysis you do. That said, it is important to have scalability for analysis that can help you implement changes at scale.” You don’t have to go it alone, however. “At this stage, automation plays a huge role.” Check out these free marketing automation dashboard examples.
Editor’s note: Are you tired of digging around to find the data insights that you need? With Databox’s integration with Slack, you can schedule dashboard snapshots and performance alerts to any Slack channel.
Juli Durante of Impulse Creative gets deep into the data as a way to look under the hood. “I’ve found that the best marketing reports don’t just show what happened, they dig in several layers to uncover *why* something happened. For example, if organic traffic has decreased 5% month over month, you know that you have less organic traffic. But is that decrease the result of seasonality, or trending keywords? Change in organic rank? A tweak in your meta description or page title that decreased your click-through rate from organic? A combination of all of these? An actionable marketing report will look at historical data to inform next steps and pivots that may need to happen with future tactics.”
Giselle Bardwell of Kiwi Creative agrees. “Here at Kiwi Creative, we strive to always use the “W4 formula” in every report; What the numbers are, Why the numbers are, What the numbers tell us about the business results, and What we can do in the future to improve the numbers.”
“The best tip we can give is to keep the methodology simple,” says Bardwell. “In our reports, we begin with the raw data, followed by analysis as to possible causes. Then, and perhaps most importantly, we explain the significance of this data tied to the business objectives or overarching goals. This helps clients understand when there might be an incentive to implement revisions and improve results or move away from particular marketing activity. Our final step is to offer executable solutions. By guiding clients through this funnel in a marketing report, you guarantee that they understand the data, why it is important, what it tells us about the larger picture and what needs to be done next.”
Use Good Data Tools
While several of our experts have spoken on the merits of manual reporting, sometimes to get a better look, you need some help. This is where having access to great analytics tools and reporting software can help.
Nirmala Santhakumar of WPGlossy keeps it basic. “Integrate Google Analytics to gather data like Traffic Sources, Conversions, and bounce rates.”
For SEO, Daniel Tannenbaum of Tudor Lodge Consultants say,s “Finding a good reporting tool (such as SEMrush and AWR) and being able to explain this report such as keyword positions and manage expectations for the client.”
“SEO is a very long term game,” observes Tannenbaum, “and you need to put results into perspective over the course a 1-month, 3-month or 6-month period. e.g ‘This is what to expect after 3 months, and by 6 months, we will be at…’”
Shawn Lim of New Age Polish uses these tools to get the best possible view in overall reporting. “Beware of the unknown unknowns! You may be so used to looking at a certain set of data that you might miss something simply because you didn’t know about it. Make use of intelligence tools that are available to avoid this scenario. For example, in Google Analytics, you can make use of Google Analytics Intelligence to get insights into your data.”
With these new tools and tips in hand, you’ll be able to create marketing reports that give you the best possible visibility into your marketing efforts and outcomes. Combining one or more of these actionable tools, you’ll be able to demonstrate the growth from your current efforts, and plot the course ahead in confidence.
Are you ready to track the performance of your department wherever you are? With daily or weekly scorecards, you can select up to 15 metrics and automate performance updates of those metrics to your whole company or specific departments.


