


Table of contents
If you didn’t already know, there are a ton of insights you can learn from your Google Analytics’ exit pages.
From identifying what interests your target audience to figuring out culprits that are pushing people to leave your site, studying your exit rate is a must.
Not sure where to start and what exactly you can learn? We’ve got the answer for you as we dive into:
- What Are Exit Pages in Google Analytics?
- How to See Exit Pages in Google Analytics
- 8 Insights You Can Gain from Analyzing Your Exit Pages

What Are Exit Pages in Google Analytics?
Exit pages are pages your site visitors view last and leave from.
For example, if a user is reading your blog content and visits a product page on your site after that but leaves your site from there, your exit page is the product page.
But what’s the average exit rate? We asked our contributors the same and concluded that the average exit rate is 26-40% for about 44% of our contributors.
For 15%, it’s between under 25% and 41-55% each. For 10%, it’s 56-70% with only 55 saying their exit rate on average is over 70%.

How to See Exit Pages in Google Analytics
To find out which pages your users are exiting from, head to Google Analytics and the menu on the left.
From there, select Behavior, followed by Site Content. Now select Exit Pages.

You can also get a day’s, a week’s, and a month’s overview by changing the setting from the graph’s upper right corner.
8 Insights You Can Gain from Analyzing Your Exit Pages
Now for exactly what you can learn:
- Find strategic positions for CTAs
- Figure out your CTA message too
- Add new CTAs
- Understand how well your content is engaging readers
- Learn what’s making your pages slow to load
- Optimize website architecture
- Optimize product pages
- Learn what interests your audience
1. Find strategic positions for CTAs
Call to action messages are only as effective as their relevancy. Meaning: not only should the message be uber-relevant to the page but it should also be positioned in a spot where the reader is ready to take action.
For example, if you place a CTA before making a case for your product feature, it’s likely to go to waste. Similarly, if you add it where your reader isn’t likely to see it, you’ll miss an opportunity to convert them.
However, finding the ideal position for CTAs can be tricky. Luckily, it’s where Google Analytics’ exit pages’ insights come in handy. Numlooker’s Lynda Fairly, in particular, has found success with it.
“Exit page analysis helped me understand the problems that my website has, but most importantly, it helped me understand where should I add the most CTAs.”
“For example, there were exit pages with a good average session duration on those pages,” says Fairly. “As people were exiting from such pages after several times of reading, our team decided to add action elements like buttons and live chat option.”
The result, you ask? “It helped us improve our conversion a lot. For the lengthy pages, we added a few CTAs in the form of hyperlinks too. It worked pretty well.”
2. Figure out your CTA message too
Not only do Google Analytics’ exit page insights help you identify spots to add your CTAs to, but thery’re also a good indicator of whether your message itself is effective.
The Mobitrix team, for instance, learned that “Getting to users’ pain points in interactions, rather than focusing on the product itself, was the most important insight I gained by identifying and analyzing our exit pages,” writes Jonathan Tian.
“For example, we recognized that our call to actions were too commercial, leading 30% visitors to exit directly upon getting to this part.”
Their reaction? “We adjusted our tone in CTAs to make it more resonating to users’ key needs, rather than endlessly depicting how amazing our product is.”
“This move simplified the checkout process and enhanced the number of clients using our services,” Tian explains. “We were also able to capture our leads by increasing exit-intent pop-ups to add figures to our email list. These actions boosted the number of our conversations with prospects.”
In short, remember to focus on the reader, not your product. Always ask yourself: what’s in it for the user – not what’s in it for me. It’s only when your readers see the benefit in your CTA message that they’re likely to click and convert.
Related: How to Write a Call to Action: Increase Your Conversions with 16 Proven Tips for Crafting CTAs
3. Add new CTAs
To add, studying the exit pages’ report can help you see if you need a new CTA to nurture – not convert a visitor.
Netpaths Design’s Cayley Vos, for example, admits they added a CTA with “a special offer in exchange for an email submit” to add potential buyers to their pipeline.
Related: B2C Lead Generation Strategy: Key Differences and Best Approaches
Vos adds, “We found out that people were leaving the product pages and on an e-commerce site. The reason was price comparison with other websites. So we made the ‘save for later’ button prominent on the page.”
Together this new site feature and CTA has helped them generate a “15% boost in purchases, with no increase in traffic.”
4. Understand how well your content is engaging readers
Although studying your exit pages doesn’t give you one answer but you can tweak a couple of things about your content (one by one) to understand what’s a hindrance or vice versa.
A few things that might be pushing all your content efforts down the drain include:
- The content doesn’t thoroughly answer readers’ questions
- It’s not written using simple and easy enough language
- It’s not easy to read – it’s coming across as hard to dive into, for example
Interestingly, fixing readability has a significant impact on improving your exit rate as 80% of our respondents agree.
77% say it’s also essential to match content with user intent and 75% suggest improving page load time is essential. On the same note, approximately 60%, 55%, and 50% say using compelling CTAs, optimizing for mobile, and improving internal linking structure helps.
Others recommend removing popups and ads, adding related posts sections, ensuring cross-browser compatibility, and more.

Case in point: the Enventys Partners’ team learned their content wasn’t conversational enough. Says Roy Morejon: “The most important insight we gained by analyzing our exit pages was that we learned we needed to make our content more conversational, and less intellectual.”
“Scholarly language serves a purpose and isn’t always bad, but on a site where you’re trying to engage potential clients, the content often should trend more conversational,” Morejon observes.
“Language is important, and we realized we didn’t sound as authentic as we could, so we reworked our content a bit.”
Keep in mind: the ideal tone or brand voice for you is one that speaks directly to your target persona. This means if you’re lacking in this department, you need to go back to audience research to come to grips with your audience profile.
Want a quick, try-today tip? Hop on a call with your customers and pay attention to the words they use and the way they describe your brand. Use those words in your marketing copy.
PRO TIP: How to track these 10 popular Google Analytics 4 metrics
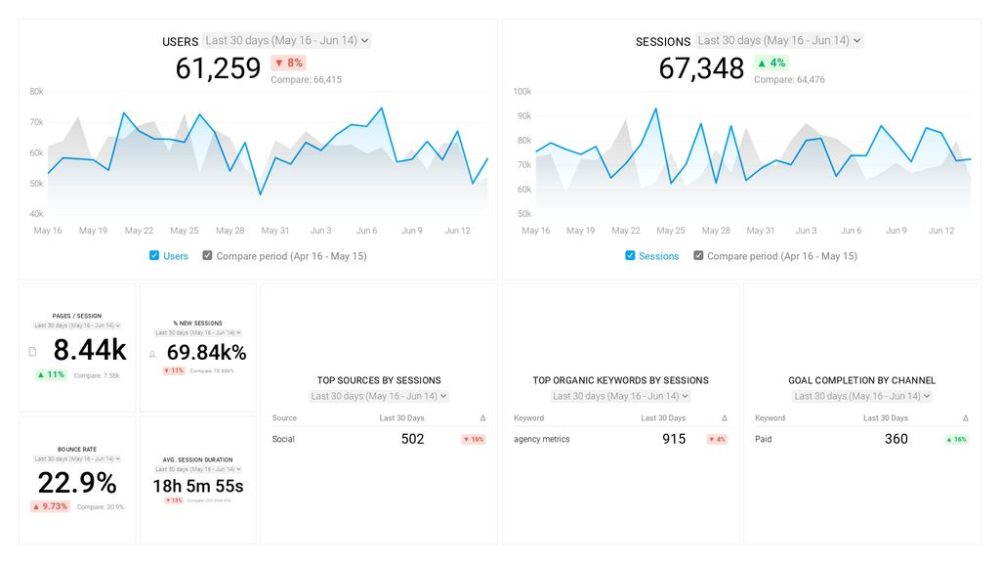
Sure, there are dozens (and dozens?) more Google Analytics 4 metrics you could track. But, starting with these 10 commonly tracked metrics will give you a pretty high-level view of how your marketing is working…
- Sessions: The number of sessions can tell you how many times people are returning to your website. Obviously, the higher the better.
- Sessions by organic keyword: Which organic keywords bring in the most traffic to your website? This may help you determine whether your SEO investments are paying off.
- Bounce rate: Do visitors leave shortly after landing on your website? Or do they stick around?
- Average session duration: How much time are people spending on your website? Users with a high average session duration are most likely relevant to your company.
- Goal completions: How many users responded to your call to action?
If you want to track these in Google Analytics, you might find the visualizations limiting. It’s also a bit time-consuming to combine all the metrics you need in one view.
To better understand how your website performs in terms of traffic growth and conversions, we’ve made this plug-and-play dashboard that contains all the essential metrics for understanding how successful you are at optimizing different aspects of your website.
You can easily set it up in just a few clicks – no coding required.
To set up the dashboard, follow these 3 simple steps:
Step 1: Get the template
Step 2: Connect your Google Analytics account with Databox.
Step 3: Watch your dashboard populate in seconds.
5. Learn what’s making your pages slow to load
“One of the most important insights we gained from analyzing a page on our site with high exit rates was the discovery of features that were causing things to load poorly,” comments Stephen Light of Nolah Mattress.
“We hadn’t noticed that a crucial infographic was loading incorrectly on the page, meaning that it was hindering our audience from gaining the valuable content they needed,” shares Light. “A simple fix and the exit rates for that page were back in the normal % range.”
Castos’ Craig Hewitt made a similar finding. “Our analytics showed us that three of our blog posts had above 60 percent bounce rates. After investigating the situation, we realized that these pages were loaded with high-resolution images which were taking too long to load.”
“Visitors were simply getting frustrated and exiting our site instead of waiting,” Hewitt explains.
“Our solution was to compress our images. We also used a CDN (content delivery network) that gave us access to multiple data centers around the world to speed up our image loading speeds. These two steps reduced the bounce rates of our blog posts to below 40%.”
To save yourself from the same trouble, make sure you optimize all images you upload using a plugin like TinyPNG.com. This way, the image file size goes down and your visuals and pages load fast.
Related: 15 Website Speed Optimization Tips That Anyone Can Implement
6. Optimize website architecture
By combining analyzing exit page report with bounce rate and session duration, you can optimize your site also.
In fact, this isn’t something to brush under the rug as our contributors say poor website performance is the leading cause behind unwanted exit rates. This is followed by poor quality content and poor SEO.

Biking Know How’s Rohan Kadam shares, “In my opinion, the exit pages report helps me understand underperforming pages within my website architecture.”
“By clubbing the Exit Pages report with Bounce Rate and Session Duration, I get a better understanding of pages that have high bounce rates, low session duration, and an increased number of exits.”
“Usually, such pages either need improvements or need to be 404’ed,” suggests Kadam. “Having a good website architecture is very important to SEO success, and the Exit Pages report helps to understand and improve the overall website architecture.”
Kadam isn’t alone in cross-referencing exit rates with bounce rates though. 80% of our respondents do the same.

7. Optimize product pages
Speaking of optimizing sites, your eCommerce store can use some help from the Google Analytics’ exit pages suggests FragranceX team.
Leanna Serras notes, “We run an eCommerce perfume store. We noticed that the product pages for one of our perfumes’ lines kept appearing in our exit pages.”
“After conducting an analysis, we realized that people were leaving these pages because they didn’t have the information they needed to make a purchase,” Seeras elaborates.
“By conducting some A/B testing we found that our customers wanted more detailed descriptions of the perfumes including some suggestions on how to wear them. After making the appropriate changes these product pages no longer appeared in our exit pages.”
Want to grow your product pages’ conversion rate? Try this:
- Share high-quality product pictures from multiple angles
- Share product dimension/size-related details
- Include details on deliver, return, and shipping costs
Related: 23 Ways to Improve Your Landing Page Conversion Rates
8. Learn what interests your audience
“A key insight we have gained from identifying and analyzing our exit pages is the amount of time spent by visitors,” notes Sergey Nikonenko of Purrweb.
“It gives us an idea about the visitor’s interest and how long they stay on the particular page of our website. If they don’t navigate or stay on the website and exit immediately, it could be several reasons such as poor visuals, slow speed, outdated content, etc.”
Nikonenko continues: “After analyzing our exit pages, we have found that customers frequently exit after spending a long time on a specific page; page content can be the issue.”
“We have solved this problem by ensuring that our website content is informative, engaging, relevant, and useful to the visitors. Our marketing team fixed the broken links and encouraged the customers not to leave the site but rather to make an order and then leave. Conversion optimization techniques have helped us to improve our exit rate.”
Put simply, use Google Analytics’ exit pages’ insights to identify how engaging your page is to your audience. After studying several reports, you’ll start seeing patterns in visitors’ interests. For example, a particular topic/content category on your blog might be succeeding at engaging your audience.
Watch the video below and learn how to properly track how effective your landing pages are at converting visitors to contacts.
Monitor Your Website’s Performance in Databox
From studying your audience’s interests to optimizing your site, there’s a lot that you can do by analyzing Google Analytics’ exit pages.
Want a shortcut to studying your Google Analytics metrics effectively? Create a Databox dashboard that shows all the essential metrics including bounce rate and session duration on one screen.
All you have to do is to plug in your GA into Databox. From there, the tool will display important metrics in real-time to keep you updated round the clock – without putting in any extra work.
Not just that but you can share the clutter-free, easy to study screen with your team. This way, you can all easily identify what’s working and what needs work.
Want to start today? Sign up for Databox for free now and start improving your conversion rate.


